Bibliographic Information
Research Article
Establishing Land Suitability Criteria for Cashew
(
Anacardium occidentale
L.) in Indonesia
Widiatmaka,
1Atang Sutandi,
1Anas Iswandi,
1Usman Daras,
2Muhammad Hikmat,
3and Ari Krisnohadi
41Department of Soil Science and Land Resources, Bogor Agricultural University, Campus of Dramaga, Bogor 16680, Indonesia 2Indonesian Agency for Agricultural Research and Development (IAARD), Ministry of Agriculture, Jl. Tentara Pelajar No. 3,
Bogor 16111, Indonesia
3Indonesian Center for Agricultural Land Resources Research and Development (ICALRRD), Ministry of Agriculture,
Jl. Tentara Pelajar No. 12, Bogor 16114, Indonesia
4University of Tanjungpura, Pontianak 78124, Indonesia
Correspondence should be addressed to Widiatmaka; widi.widiatmaka@yahoo.com
Received 19 February 2014; Revised 27 May 2014; Accepted 29 May 2014; Published 22 July 2014
Academic Editor: Davey Jones
Copyright © 2014 Widiatmaka et al. his is an open access article distributed under the Creative Commons Attribution License, which permits unrestricted use, distribution, and reproduction in any medium, provided the original work is properly cited.
Commodity development requires site selection which should be established prior to large scale development. he land suitability criteria for cashew are not presently available. he relationship between the biophysical aspects, especially land and soil with commodity productivity, is also not known in depth. he objective of this study is to establish the criteria of land suitability for cashew in Indonesia, based on its production and land characteristics. Cashew plantations in 5 provinces were sampled. he data of production per tree per year were obtained from farmers, while the soil was sampled and analyzed in the laboratory. Age-adjusted cashew production was used as the yield response and plotted against land characteristics. Boundary lines resulting from the scatter of points were described; these lines produced the limits of land suitability criteria. he criteria were established using a projection of the intersection between the boundary line and yield interval. he criteria were also built in accordance with the productivity index of FAO for the internal boundary inside the S (suitable) class and by calculating the break-event point production for the boundary between S (suitable) and N (nonsuitable) order. he main result of this research is land suitability criteria for cashew.
1. Introduction
he cashew (Anacardium occidentaleL.) is a prospective com-modity in Indonesia, and its cultivation issues are relevant to the country’s development both as an export commodity and in regard to environmental conservation. At the beginning of Indonesia’s agricultural development, planting of the cashew was implemented for greening programs and reforestation. With the increase of prices, issues of cashew development began to shit from land conservation to more economic considerations. Today, Indonesia is the ith largest cashew producer in the world ater Nigeria, India, Cote d’Ivoire, and Vietnam. Indonesia’s total cashew production in 2011 was 114,789 tons, originating from 575,841 Ha of plantations area [1].
One of the problems encountered in the development of cashew in Indonesia is the low productivity. Average Indonesian cashew productivity in 2011 was 367 kg⋅Ha−1[1, 2]. In comparison, the production in Keralla, India, reached 1,180 kg⋅Ha−1 [3], while Vietnam produced 672 kg⋅Ha−1 [4], and Nigeria produced 1,970 kg⋅Ha−1 [5]. Compared to the long-term target production of this commodity in Indonesia of>1,000 kg nuts⋅Ha−1⋅year−1 [6], actual average production is very low. One of the eforts to increase productivity is planting the commodity only on suitable land.
Land suitability analysis is a method generally used in site selection. he proper site selection should be established before any large scale development. Several methods have been developed in land suitability analysis, either qualitative or quantitative [7, 8]. Among the various systems used in
qualitative land evaluation, the maximum limitation system is the most common one used in Indonesia. In this system, the degree of land use limitations is imposed by land charac-teristics on the basis of permanent properties. his method expresses the land suitability class qualitatively for any given area. A simple table of criteria is used, by matching land requirements with land characteristics [7]. In other words, it is necessary to have criteria to assess the suitability of land utilization. As of yet, quantitative criteria for cashew site selection are not available. In many land evaluation references used in Indonesia [9–12], the criteria for this commodity have not been included. Development of accurate criteria is thus necessary.
Appropriate criteria should relect the production, as the use of inappropriate criteria may cause errors in the diagnosis of land being evaluated. he use of inappropriate criteria under certain circumstances assessment oten does not relect the factual growth in the ield as well as the production. In some cases, assessment of suitability results in an N (not suitable) class, although the commodity growth in the ield was good. In some other cases, the assessment of suitability that produces an S1 (highly suitable) class or an S2 (suitable) class was confronted by the fact that the plants do not grow as well as their suitability classes indicate. his has been frequently reported in much research [13]. Hence, criteria outlining plant growth should be developed on the basis of crop production.
In the maximum limitation method, the evaluations assess land qualities and land characteristics as compared to land use requirements, regardless of whether there is an inter-action between two or more land qualities or characteristics. If the correlation between land quality and land characteristic is built empirically, it will be costly and time-consuming to an excessive degree. herefore, it is necessary to look for quicker, cheaper, and more precise ways to develop criteria.
he objective of this study is to delineate the relationship between cashew production and land characteristics to estab-lish land suitability criteria for cashew plantation. he criteria developed should be relective of plant productivity.
2. Materials and Methods
2.1. Logical Framework. Many studies have been conducted to reveal the relationship between plant growth and pro-duction with land factors [14, 15]. If a speciic relationship between growth factors and plant response exists, then max-imum growth and production can be obtained by optimizing such growth factors. he relationship is oten tentatively established with the goal of deining diagnostic models [16]. Unfortunately, the relationship is oten established under controlled conditions, in which only one variable is varied, while all other factors remain stable. As a consequence, the relationship is valid only for speciic conditions under which the particular experiment was conducted. In fact, the inluence of growth factors changes when environment and conditions are changed due to other factors. hus, resulted models cannot be generalized.
108∘E 112∘E 116∘E 120∘E 124∘E
Regency of sampling locations
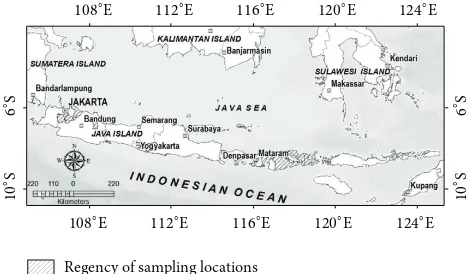
Figure 1: Sampling locations.
Alternatives can be posited using empirical models, in which data are collected from locations with a wide range of environmental characteristics, including soil and climate properties. his type of approach has already been done in several studies [17,18]. If a set of data such as production data were collected, the data could be plotted against any envi-ronmental factor in a scatter diagram. he data distribution would be enclosed by a boundary line which separates real data from hypothetical data: there is only a small chance that the data would be found outside such a boundary line. he outermost line is a response to the limiting factor of produc-tion being evaluated [19–21]. hat is why this study used this approach, rather than stepwise statistical analysis. he highest production will be achieved at the minimum limiting factor, which is presented by the conical boundary line. he pro-jection of point intersection between the boundary line with yield cut-of in abscissa can be used as the threshold criteria of land suitability classes. Yield cut-of is equal to the minimum limit of the FAO criteria [22]: the minimum border of the S1 class is 80% maximum production, and the minimum border of the S2 class is 60% maximum production. he border between S3 and N can be deined using break-even point production, calculated for the commodity being evaluated.
2.2. Methods. his study uses exploratory methods, by anal-ysis of cashew growth regions. Consideration of site selection was based on biogeophysical variability distribution. he study was conducted in 5 provinces in Indonesia, repre-sented by 12 regencies (Bogor Municipality, Bogor Regency, Karawang, and Majalengka in West Java Provice; West Lom-bok, East LomLom-bok, Central Sumbawa, Bima, and Dompu in West Nusa Tenggara Province; Gunung Kidul in Yogyakarta Province; Wonogiri in Central Java Province; and East Flores in East Nusa Tenggara Province) (Figure 1).
varying from alluvium quarter in Karawang, West Java to sedimentary karstic material in Gunung Kidul, Yogyakarta. he provisional criteria built using data from 2 provinces have been presented previously [23]. he present criteria are the inal criteria, developed from more diverse regions and a wider range of data.
In such a diverse environment, ield surveys were done to obtain soil properties and crop productivity. Data were taken on land characteristics and plant growth, demonstrating a diversity of land characteristics and production levels. he ield study was done from 2007 to 2011: from 2007 to 2009 for 9 regencies and from 2010 to 2011 for the 3 remaining regencies.
Soil samples (0–30 cm depth) were taken for laboratory analysis. All laboratory analysis was conducted in the laboratory of the Department of Soil Science and Land Resources, at Bogor Agricultural University, Indonesia. he soil laboratory analysis method followed the method described by [24]. he parameters analyzed were soil texture (pipette method), cation exchange capacity (CEC) (NH4OAc method), exchangeable Na, K, Ca, Mg (NH4OAc, atomic absorption spectrophotometry), soil pH (pH-meter, 1 : 1), organic carbon content (organic-C) (Walkley-Black combustion method), total nitrogen (total-N) (Kjeldahl method), available phosphorous (available-P) (Bray-1 method), and exchangeable potassium (exchangeable-K) (NH4OAc method). he land characteristics observed in the ield included drainage, efective soil depth, surface rocks, and slope. Climatic characteristics were obtained from meteorological stations in each regency.
Crop productivity was measured by units of weights of spindle nuts per tree per year. he data of production per tree per year were obtained from farmers who were asked to measure, ater trees in each sampling point were identiied and selected.
In the ield surveys, plant ages were diferent for each sam-ple. herefore, individual plant production data needs to be adjusted according to plant age. An age-adjusted production method can be done by using the following equation [25]:
�� = ̈Υ + (�� − ̂�) , (1)
where�� =age-adjusted production,�� =actual production based on observations, ̈Υ =general mean, and� =predicted production depending on age from the model, where the model relation between yield and age� = �(�), where� = time.
Age-adjusted production was then plotted with land char-acteristics to construct a scatter diagram and scatter plot of pertinent boundary lines. Boundary lines and equations were constructed from the outermost points so that the lines wrap around the data. For each land characteristic, at least 5 outliers were taken. he boundary equation model was selected according to the most suitable data, based on the highest determination coeicient (�2). he yield cut-of as a minimum value for the S1 class was 80% of maximum possible production, while the minimum value of the S2 was set at 60% and S3 class was limited by the level of production at the break-even point of cashew production. In previous
research [26], the break-even point cashew production level was 24% of maximum production. Projection of the inter-section between the boundary line and yield cut-of becomes criteria of land suitability in the relevant class.
We used the 5 as the number of outermost points with the following considerations: (i) to minimize the number of points above the boundary limits and (ii) to maximize the likelihood of developing statistically signiicant models. he choice of a number of boundary points to estimate a boundary line in one scatter diagram represents a compro-mise between the two targets of the big group sizes and a high number of boundary points [27]. For the same reason, other researches [28] used 10 points with a sample size of 252, which represented 3.97% of the samples. In our case, we used 5 points in a sample size of 92 or 5.43% of the samples.
A validity test was performed for the accuracy of the resultant land suitability criteria. he validity test was done by using a set of data not used in the preparation of the model, through the assessment of land suitability using the principle of maximum limiting factor, in which the inal value of the land suitability classiication was determined by the value of the lowest land characteristics. In this research, there were 92 samples used for model development and 20 samples were used for the validity test. he validation samples were selected by stratiied random sampling by taken 4 samples each from 5 provinces.
3. Results and Discussion
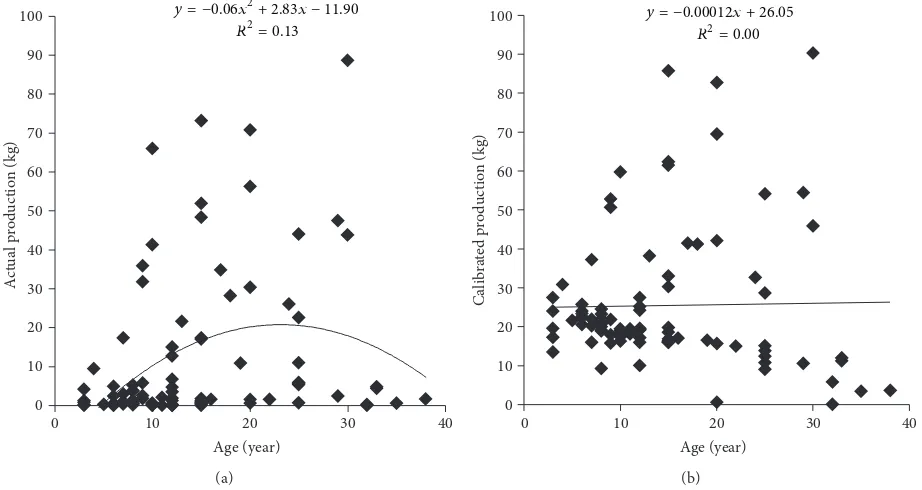
A summary of measurement results is presented inTable 1. Relationships between cashew production and tree age are presented inFigure 2. Production was correlated with age, although the determination coeicient (�2) was quite small (Figure 2(a)). he low�2was due to environmental factors. he plant growth varies not only due to the age of the plant, but also to other environmental factors. Ater calibration, age has no efect (Figure 2(b)) and thus, for subsequent analysis, confrontation was done between the data of land characteristics with age-adjusted production.
he distribution of age-adjusted production data shows that the maximum production reaches 90.24 kg⋅tree−1⋅year−1. Based on this value, an interval of age-adjusted production for each land suitability class can be obtained, namely, (1) production in the S1 class at >72.19 kg⋅tree−1⋅year−1, (2) production in the S2 class between 54.15 and 72.19 kg⋅tree−1⋅year−1, (3) production in the S3 class between 21.30 and 54.15 kg⋅tree−1⋅year−1, and (4) production in the N class at<21.30 kg⋅tree−1⋅year−1.
Land elevation can be used as an indicator of air or soil temperature. he higher the elevation is, the lower the air temperature is. he relationship between air temperature and elevation can be formulated using the Braak formula [29]. According to this reference, Indonesia’s lowland temperatures vary between 25–27∘C, and the formula used is� = 26∘C− (0.01×elevation in meters×0.6∘C).
A
p
p
lie
d
and
En
vir
o
nmen
ta
lS
o
il
S
cience
Table 1: Data summary of cashew production and several environmental factors, used for model construction.
No. Province � Age Production (kg⋅tree−1) Soil depth
(cm)
Surface rock
(%)
Slope (%)
Altitude (m)
Temperature
(∘C)
Dry month (month)
Rainfall
(mm⋅year−1)
Actual
Age-adjusted
1 West Java1 11
Min 5 0.16 1.62 60.00 0.00 5.00 76.00 25.10 0.00 1,974.00
Ave 11 4.92 8.37 139.09 4.55 38.91 214.55 25.63 1.82 2,505.09
Max 24 26.00 18.19 200.00 20.00 120.00 342.00 25.72 3.00 4,100.00
2 Yogyakarta2 14
Min 3 0.05 0.02 20.00 0.00 1.00 167.00 27.65 6.00 1,199.56
Ave 21 2.05 0.40 72.86 4.36 5.93 184.57 27.65 6.00 1,330.94
Max 38 5.75 7.69 160.00 30.00 23.00 195.00 27.65 6.00 1,403.92
3 Central Java3 5
Min 15 0.37 2.04 20.00 0.00 3.00 195.00 27.65 6.00 1,199.56
Ave 18 18.27 17.49 57.00 5.40 13.20 217.00 27.65 6.00 1,199.56
Max 30 88.63 75.55 100.00 15.00 22.00 245.00 27.65 6.00 1,199.56
4 West Nusatenggara4 23
Min 3 0.18 1.40 10.00 0.00 3.00 15.00 23.30 4.90 831.00
Ave 11 17.17 20.01 75.96 5.09 16.74 74.20 25.80 6.10 1,114.85
Max 20 56.28 55.48 120.00 40.00 70.00 285.90 26.30 7.70 1,470.00
5 East Nusatenggara5 39
Min 3 0.10 0.01 10.00 0.00 1.00 2.00 25.72 2.00 839.30
Ave 15 13.21 12.64 70.10 10.49 9.82 85.65 27.14 7.62 1,126.30
Max 30 73.20 71.43 200.00 80.00 49.00 473.00 27.23 9.00 1,974.00
Total 92
1Number of samples in each Regency in West Java: Karawang (� = 4), Bogor (� = 3), and Majalengka (� = 4).
2Number of samples in each Regency in Yogyakarta: Gunung Kidul (� = 14).
3Number of samples in each Regency in Central Java: Wonogiri (� = 5).
4Number of samples in each Regency in West Nusa Tenggara: West Lombok (� = 6), East Lombok (� = 1), Central Sumbawa (� = 6), Dompu (� = 8), and Bima (� = 2).
0
Figure 2: Relationships between age of cashew trees with production: before age-adjusted (a) and ater age-adjusted (b).
the higher the elevation, the lower the production. From the projected intersection of the production interval line and the outer boundary, the elevation values which become the limits between the S1 class and the S2 class can be obtained, which is 196 m above mean sea level (a.s.l.), the boundary between the S2 class and the S3 class is 324 m a.s.l., while the boundary between the S3 class and the N class is 456 m a.s.l.
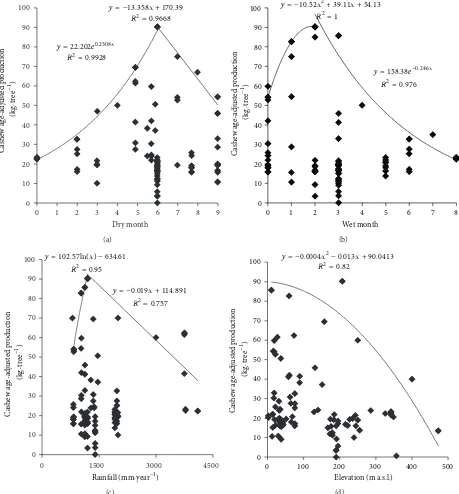
Land characteristics which relate to water availability include rainfall, number of dry months, and number of wet months. he dry and wet months follow the deinition currently used in Indonesia [30], in which dry months are those with rainfall <100 mm, while wet months are those with rainfall>200 mm. From data distribution of the relationship between calibrated production and such land characteristics, the outer boundary lines can be drawn, as shown inFigure 3. It appears that the higher the amount of rainfall, in correlation with dry and wet months, the higher the calibrated production, up to a certain extent and then decreases with certain land characteristics.
From the projected intersection between the yield cut-of and the equation model at boundary lines, it is obtained that the amount of precipitation, which becomes limit class between the S1 class and the S2 class, is 987 mm⋅year−1 and 2,247 mm⋅year−1 as the lowest and highest limits. he limits between the S2 class and the S3 class are 827 and 3,197 mm⋅year−1, and the limits between the S3 class and the N class are 601 and 4,926 mm⋅year−1. For the dry months, the limits between the S1 class and the S2 class are 5 months and 10 months for the lower and upper limits and the limits between the S2 class and the S3 class are 4 months and 11 months, while the limit between the S3 class and the N class is 11 months. For the wet months, the limit between the S1 class and the S2 class is 1 month and 3 months for the lower and upper
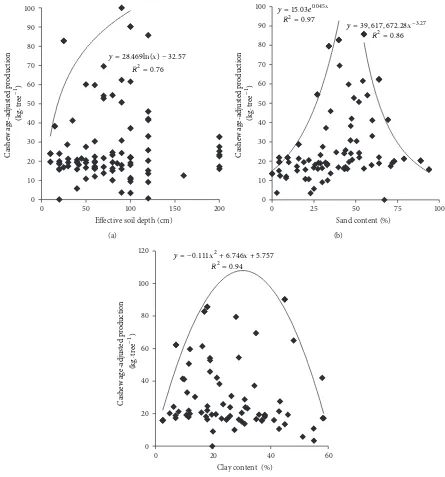
limits and the limit between the S2 class and the S3 class is 5 months, while the limit between the S3 class and the N class is 8.4 months. his result conirms the result obtained in Mozambique [31], which indicated that management aspect and moisture availability variation are factors that determine cashew yield variability. In such research, temporal variation of available soil moisture explains the yield variability of the cashew nuts by 17%. According to the research done in Keralla, India [32], there was a decline of 52% in Cashew productivity due to the warmest and drought conditions as a result of a decline in rainfall and an increase in temperature. Land characteristics that afect the land quality of rooting zones are soil efective depth, sand, and clay fraction content, together with silt content which determines the soil texture classes. Texture classes are obtained by overlaying the content of sand, clay, and silt with a texture triangle. he lines forming the outer boundary based on data distribution of land characteristics of rooting zone conditions and their relationship with production are presented inFigure 4. For soil efective depth, the outer boundary shows a trend that the deeper the efective soil depth, the higher the production. For sand and clay fraction contents, the boundary line shows a trend of increased production along with increased sand and clay contents up to a certain extent, which then decreases with increased sand or clay contents.
Based on the projected intersection of yield cut-of and equation at boundary lines, the soil efective depth obtained for limits between S1 class and S2 class is 40 cm below the soil surface (b.s.s.) and the limit between the S2 class and the S3 class is 21 cm b.s.s., whereas the limit between the S3 class and the N class is 7 cm b.s.s.
0
y = 22.202e0.2308x R2= 0.9928
y = 158.38e−0.246x R2= 0.976
0 1500 3000 4500
C
Rainfall (mm·year−1)
(c)
Figure 3: Relationships between productions of cashew with dry month (a), wet month (b), rainfall (c), and elevation (d).
respectively. he limit between the S2 class and the S3 class is 8% and 53%, and the limit between the S3 class and the N class is 2% and 58%, respectively. For the content of sand, the limits between the S1 class and the S2 class are 35% and 57% as the lower and upper limits, the limits between the S2 class and the S3 class are 29% and 62%, and the limits between the S3 class and the N class are 8% and 83%, respectively.
Based on the overlay results, it is obtained that the soil textures of clay loam, sandy clay loam, and loam belong to the S1 class. Soil textures of sandy clay and sandy loam belong
to the S2 class. Soil textures of clay, silty clay, and silty clay loam fall in the S3 class, while the textures in the N class are heavy clay, silt, loamy sand, and sand. Such results conirm previous studies which indicate that soil texture is critical for cashew production. Cashew production in Guatemala relate to well-drained soil with a sandy loam texture [33]. It seems that cashew growth thrives in a free-draining, light-textured, deep soil.
0
Effective soil depth (cm)
C
Figure 4: Relationships between productions of cashew with rooting zone condition: efective soil depth (a), sand content (b), and clay content (c).
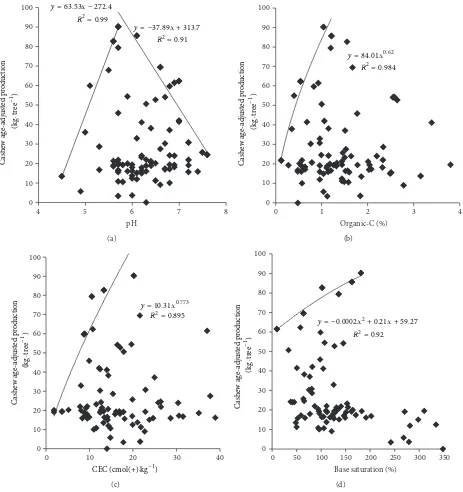
base saturation. he lines forming the outer boundaries based on data distribution of such land characteristics and their relationship with production are shown inFigure 5.
he projected intersection between yield cut-of and the boundary lines produces soil pH limits between the S1 class and the S2 class at pH levels of 5.4 and 6.4 as lower and upper boundaries and the limits between the S2 class and the S3 class are pH levels of 5.1 and 6.9, while the limits between the S3 class and the N class are pH levels of 4.6 and 7.7. As a comparison, research has reported that cashews grow well in Nigeria within a pH range of 3.0–6.5, while the best growth
is obtained between a pH range of 4.5–5.0, pH 4.5 being the optimal [34].
0
Base saturation (%)
C
Figure 5: Relationships between cashew age-adjusted productions with soil pH (a), organic-C (b), soil CEC (c), and base saturation (d).
the S2 class is 66%. his means that the S1 class has value of base saturation>66%, while the S2 class has a value of base saturation<66%.
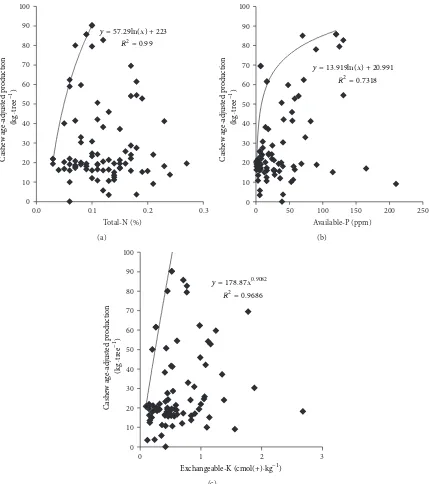
Nutrient availabilities which afect the productivity of cashew nuts include total-N, available-P, and exchangeable-K. he role of these elements is essential for the growth associated with vegetative performance and crop produc-tivity. he boundary lines of the data relationship between the production of cashew with total-N, available-P, and exchangeable-K are shown in Figure 6. Patterns of these boundary lines show a trend of increased production with
higher values of total-N, available-P, and exchangeable-K of soil.
0
y = 178.87x0.9082 R2= 0.9686
Exchangeable-K (cmol(+)·kg−1)
(c)
Figure 6: Relationships between cashew productions with nutrient available: total-N (a), available-P (b), and exchangeable-K (c).
genetic material of the cell nucleus. Phosphorus deiciency causes stunting, delayed maturity, and shriveled seeds [35]. Nitrogen appears necessary during the vegetative phase of the cashew tree [36]. Application of a high-nitrogen fertilizer was responsive in this vegetative phase.
he contents of exchangeable-K which became the limit of the S1 class and the S2 class is 0.37 cmol(+)⋅kg−1, the limit between the S2 class and the S3 class is 0.27 cmol(+)⋅kg−1, and the limit between the S3 class and the N class is 0.10 cmol(+)⋅kg−1. In general, in terms of nutrient retention, cashews are less particular in terms of soil type and fertility requirement compared to other crops [37, 38]. As a result
of its wide adaptability, cashews can also be grown in very poor-quality soil, and this has characterized its survival and establishment in diverse regions.
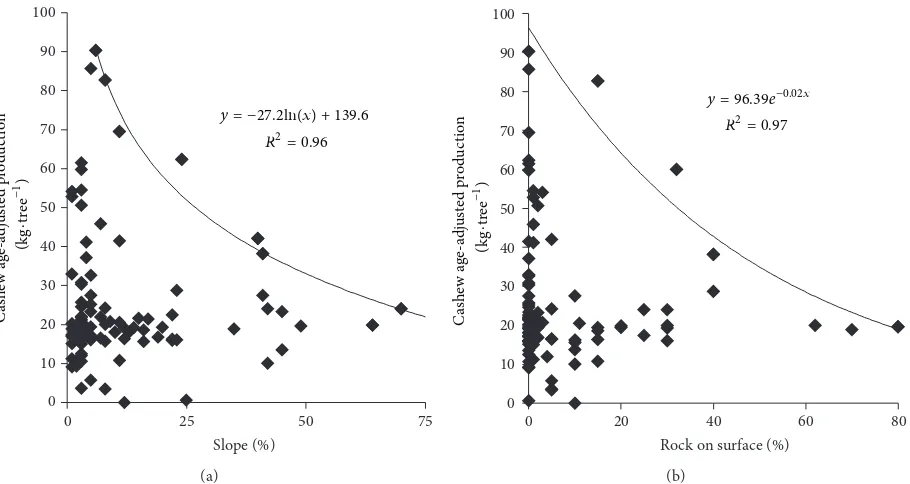
he terrain conditions which afect productivity are slope and the amount of rock on the surface. he boundary lines of the data relationship between age-adjusted production with slope and the amount of rocks on the surface are shown in Figure 7. he lines indicate that production decreases with increasing slope or excessive quantities of rocks on the surface.
0
Rock on surface (%)
C
Figure 7: Relationships between cashew productions with terrain conditions: slope (a) and rock on surface (b).
and the S3 class is 23%, and the limit between the S3 class and the N class is 77%. he content of the surface rocks to form the limit between the S1 class and the S2 class is 15% and the limit between the S2 class and the S3 class is 29%, while the limit between the S3 class and the N class is 76%.
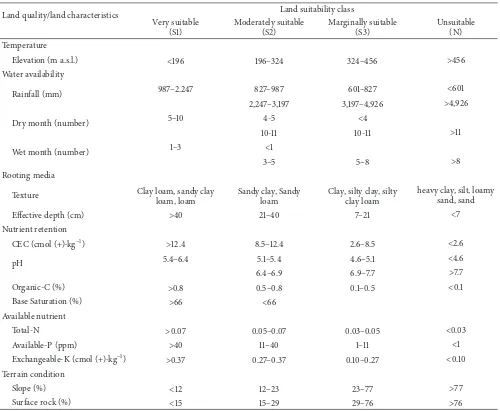
Based on the model, developed for any land character-istic, the land suitability criteria for cashew production can at last be established, as presented inTable 2. Land qualities which can not constitute criteria are air temperature, drainage, and Al-toxicity. his is due to the limited distribu-tion of cashew crops in the study areas. Cashew producdistribu-tion ranges from a few dozen meters to 470 m a.s.l., and so the temperature range in the study area varies by only 2 to 3∘C. Similarly for drainage class, criteria cannot be made, because cashews are generally developed as green plants or grown on degraded lands as conservation plants or to increase the economic value of dry land, so that the distribution of this plant is commonly spread on land with good drainage. In this research, this plant was never found in soil drainage with moderately well or worse. Criteria for Al-toxicity limits could not be determined also due to the distribution of Al saturation which was found in the narrow interval distribution.
he validity test used 20 data sets that were not used in the preparation of the model, which consists of data ields and production characteristics. he data used for validation are presented in Table 3. he results of this validity test indicate that overall land suitability criteria have generated an 80% accuracy rate. his means that as much as 80% of the data tested/generated are valid according to the postulated suitability criteria.
4. Conclusions
his study gives an analyis of the relationship between cashew production and the biophysical aspects of its growth. Pattern of this relationship was then used to deine the suitability of cashew within its growth environments.
Analysis of the relationship between cashew production and water availability indicates that, with higher rainfall (over 2,247 mm⋅year−1), crop productivity decreases. However, conditions of rainfall below 987 mm⋅year−1 also cause low productivity. he number of dry months which are strongly correlated with a level of productivity above 80% is 5 to 10 months.
In terms of the relationship between cashew production and conditions of the root zone of plants, our equation obtained (28.469 ln(�)−32.57) has a fairly high correlation (�2 = 0.76) for the relationship between crop production and efective soil depth. his means that 76% of cashew production variability is inluenced by efective soil depth. More efective soil depth of the plant roots resulted in better conditions, with a minimum efective soil depth of 40 cm yielding productivity above 80% (S1 class). Mean-while, the soil texture which was conducive to crop pro-ductivity over 80% of the average production is clay loam, sandy clay loam, and loam, with a determination coeicient
>0.86.
Table 2: Land suitability criteria for cashew.
Land quality/land characteristics Land suitability class Very suitable
(S1)
Moderately suitable (S2)
Marginally suitable (S3)
Unsuitable (N) Temperature
Elevation (m a.s.l.) <196 196–324 324–456 >456
Water availability
Rainfall (mm) 987–2.247 827–987 601–827 <601
2,247–3,197 3,197–4,926 >4,926
Dry month (number) 5–10 4-5 <4
10-11 10-11 >11
Wet month (number) 1–3 <1
3–5 5–8 >8
Rooting media
Texture Clay loam, sandy clay loam, loam
Sandy clay, Sandy loam
Clay, silty clay, silty clay loam
heavy clay, silt, loamy sand, sand
Efective depth (cm) >40 21–40 7–21 <7
Nutrient retention
CEC (cmol (+)⋅kg−1) >12.4 8.5–12.4 2.6–8.5 <2.6
pH 5.4–6.4 5.1–5.4 4.6–5.1 <4.6
6.4–6.9 6.9–7.7 >7.7
Organic-C (%) >0.8 0.5–0.8 0.1–0.5 <0.1
Base Saturation (%) >66 <66
Available nutrient
Total-N >0.07 0.05–0.07 0.03–0.05 <0.03
Available-P (ppm) >40 11–40 1–11 <1
Exchangeable-K (cmol (+)⋅kg−1) >0.37 0.27–0.37 0.10–0.27 <0.10 Terrain condition
Slope (%) <12 12–23 23–77 >77
Surface rock (%) <15 15–29 29–76 >76
above 0.8%, CEC above 12.4 cmol(+)⋅kg−1, and soil pH tends to neutral (5.4 to 6.4). he coeicient of determination of the model equations constructed is all>0.89.
For the nutrients available in soil, analysis of the rela-tionship between crop production and contents of soil N, available-P, and exchangeable-K showed a strong to moder-ate correlation (coeicients of determination of 0.99, 0.79, and 0.97, resp.). With higher levels of N, available-P, and exchangeable-K in soil, productivity also increases. If the levels of total-N are over 0.07%, available-P over 40 ppm, as well as soil exchangeable-K over 0.37 cmol(+)⋅kg−1, land is able to produce cashew at over 80% of the average productivity.
Some terrain parameters that afect the productivity of cashews are the percentage of surface rocks (�2 = 0.97) and percent of slope (�2 = 0.96). With decreasing percentage of surface rocks, cashew productivity increases.
From the models built, the land suitability criteria for cashew production have been constructed. Suitability criteria
for cashew production generated from this study are pro-posed to be applied in the selection of the plantation location. he criteria have been established through research in 5 (ive) provinces (West Java, West Nusa Tenggara, East Nusa Tenggara, Yogyakarta, and Central Java) with diferent char-acteristics. Nonetheless, it was realized that the biophysical characteristics across Indonesia vary suiciently to merit research in 5 provinces. hese criteria could be generalized; however, considering the wide range of Indonesian resources, more complete research of other regional biophysical proper-ties would strongly recommended.
A
Table 3: Data summary of cashew production, used for validity test.
Site
Note:∗using the principle of maximum limitation method.
∗∗1 means valid, where result of land suitability class according to production give the same result with the land suitability class according to land characteristics.
plantation in areas having suitability rates from fair to highly suitable.
Conflict of Interests
he authors declare that there is no conlict of interests regarding the publication of this paper.
Acknowledgments
he authors would like to acknowledge Ministry of Agricul-ture, Republic of Indonesia, for the funding of this research under the Project of Agricultural Research Partnership Coop-eration with Universities during 2007–2009 as well as Min-istry of Research and Technology, for the funding of this research during 2010-2011 under the Project of Research and Technology Incentive.
References
[1] D. J. P. Ditjenbun, “Perkembangan Luas Areal Perkebunan 2008–2013,” Direktorat Jenderal Perkebunan, Departemen Per-tanian, 2013.
[2] S. Kurniati and E. A. Hadad, “Perkembangan penelitian bahan tanaman jambu mete,” inProsiding Forum Komunikasi Ilmiah Komoditas Jambu Mente, pp. 104–114, Balai Penelitian Tanaman Rempah dan Obat, 1996.
[3] E. V. V. B. Rao, “Integrated production practices of Cashew in India,” FAO Corporate Document Repository, 2013,http://www
.fao.org/docrep/005/ac451e/ac451e04.htm.
[4] N. M. Chau, “Integrated production practices of Cashew in Vietnam,” FAO Corporate Document Repository, 2013,http://
www.fao.org/docrep/005/ac451e/ac451e0a.htm.
[5] FAO (Food and Agricultural Organization of the United Nations),Major Food and Agricultural Commodities and Pro-ducers—Countries by Commodity, 2011,http://www.fao.org/. [6] Balitro (Balai Penelitian Tanaman Rempah dan Aneka
Indus-tri), “Program Penelitian Balitro,” Balai Penelitian Tanaman Rempah dan Aneka Tanaman Industri, 2009.
[7] D. de la Rosa and C. van Diepen, “Qualitative and quantitative land evaluation,” in1.5. Land Use and Land Cover, W. Verheye, Ed., Encyclopedia of Life Support System (EOLSS-UNESCO), EOLSS, Oxford, UK, 2002.
[8] H. George,An Overview of Land Evaluation and Land Use Plan-ning at FAO, FAO, Rome, Italy, 2005.
[9] D. Djaenudin, H. Marwan, H. Subagjo, and A. Hidayat, Techni-cal Guidance of Land Evaluation for Agricultural Commodities, Soil Research Institute, Agricultural Research and Development Agency, 2003.
[10] M. L. Rayes,Metode Inventarisasi Sumberdaya Lahan, Penerbit Andi, Yogyakarta, Indonesia, 2006.
[11] S. Hardjowigeno and Widiatmaka,Land Suitability Evaluation and Landuse Planning, Gadjahmada University Press, Yogya-karta, Indonesia, 2007.
[12] S. Ritung, F. Wahyunto, F. Agus, and H. Hidayat, Evaluasi Kesesuaian Lahan dengan Contoh Peta Arahan Penggunaan Lahan Kabupaten Aceh Barat, Balai Penelitian Tanah dan World Agroforestry Centre (ICRAF), Bogor, Indonesia, 2007, (Indone-sian).
[13] A. Sutandi and B. Barus, “Permodelan kesesuaian lahan tana-man kunyit,”Jurnal Tanah dan Lingkungan, vol. 9, no. 1, pp. 20– 26, 2007.
[14] J. Letey, “Relationship between soil physical properties and crop production,”Advances in Soil Science, vol. 1, pp. 277–294, 1985. [15] S. Zare, M. Jafari, A. Tavili, H. Abbasi, and M. Rostampour,
“Relationship between environmental factors and plant distri-bution in arid and semiarid area (Case Study: Shahriyar Ran-gelands, Iran),” American-Eurasian Journal of Agriculture & Environmental Science, vol. 10, no. 1, pp. 97–105, 2011.
[16] C. R. Escano, C. A. Jones, and G. Uehara, “Nutrient diagnosis in corn grown on hydric dystrandepts: I. Optimum nitrient tissue concentrations,”Soil Science Society ofAmerica Journal, vol. 45, pp. 1135–1139, 1981.
[17] A. Etzinger, “Using empirical and mechanistic models to predict crop suitability and productivity in climate change research,” in
Decision and Policy Analysis, DAPA, CIAT, Nairobi, Kenya, 2013. [18] E. A. Machado-Machado, “Empirical mapping of suitability to dengue fever in Mexico using species distribution modeling,”
Applied Geography, vol. 33, no. 1, pp. 82–93, 2012.
[19] J. L. Walworth, W. S. Letzsch, and M. E. Sumner, “Use of bound-ary lines in establishing diagnostic norms,”Soil Science Society of America Journal, vol. 50, no. 1, pp. 123–128, 1986.
[20] M. E. Sumner and P. M. W. Farina, “Phosphorous interactions with nutrients and lime in ield cropping systems,”Advance in Soil Science, vol. 5, pp. 201–236, 1986.
[21] A. E. Milne, R. B. Ferguson, and R. M. Lark, “Estimating a boundary line model for a biological response by maximum likelihood,”Annals of Applied Biology, vol. 149, no. 2, pp. 223– 234, 2006.
[22] Food and Agricultural Organisation, A Framework for Land Evaluation, Soils Bulletin NO.32, Food and Agriculture Orga-nization, Rome, Italy, 1976.
[23] Widiatmaka, A. Sutandi, U. Daras, I. Anas, and A. Krisnohadi, “Exploration of land quality and productivity for development of land suitability criteria for cashew (Anacardium occidentale, L.),” inProceedings of the 9th Congress of Indonesian Soil Science Association, pp. 270–279, 2007.
[24] K. H. Tan,Soil Sampling, Preparation and Analysis, Marcel Dek-ker, New York, NY, USA.
[25] R. A. Rathfon and J. A. Burger, “Diagnosis and Recommen-dation Integrated System (DRIS) nutrient norms for fraser ir Christmas trees,”Forest Science, vol. 37, no. 4, pp. 998–1010, 1991. [26] A. Krisnohadi,Pembangunan Kriteria Kesesuaian Lahan untuk Jambu Mete (Anacardium occidentale L.) dan Optimalisasi Man-ajemen Spesifik Lokasi Usaha Tani Jambu Mete di Kabupaten Dompu [M.S. thesis], Program Pascasarjana, Institut Pertanian Bogor, Bogor, Indonesia, 2008.
[27] U. Schmidt, H. h¨oni, and M. Kaupenjohann, “Using a bound-ary line approach to analyze N2O lux data from agricultural soils,”Nutrient Cycling in Agroecosystems, vol. 57, no. 2, pp. 119– 129, 2000.
[28] F. R. Blanco-Mac´ıas, R. D. Magallanes-Quintanar, R. Valdez-Cepeda et al., “Comparison between CND norms and bound-ary-line approach nutrient standards:Opuntia ficus-indicaL. Case,”Revista Chapingo Serie Horticultura, vol. 15, no. 2, pp. 217– 223, 2009.
[29] E. C. J. Mohr, F. A. van Barren, and J. van Schuylenborgh, Tropi-cal Soils, W. Van Hoeve, he Hague, he Netherlands, 1972. [30] R. L. Oldeman and I. Las,he Agroclimatic Maps of Kalimantan,
Central Research Institute for Agriculture, Bogor, Indonesia, 1980.
[31] T. D. Tolla,Efect of moisture conditions and management on pro-duction of Cashew: a case study in lower Limpopo, Mozambique [M.S. thesis], International Institute for Geo-Information Sci-ence and Earth Observation, Enschede, he Netherlands, 2004. [32] C. S. Gopakumar, G. S. L. H. V. P. Rao, and P. B. Pushpalatha, “Efect of dry spell on cashew production in the humid tropics,” inProceeding of the National Workshop on Drought Management in Plantation Crops, E. V. Nybe and G. S. L. H. V. P. Rao, Eds., pp. 108–109, 2005.
[33] I. E. Duncan, “A review of the potential for development of cashew production in Zona Paz region, Guatemala, Central America,” AGIL PROGRAM (Apoyo a la Generacion de Ingre-sos Locales), US Aid/Guatemala CAP income Generation Activities in Rural Areas, Guatemala City, Guatemala, 2001. [34] A. R. Owaiye and O. A. Olunloyo, “he efect of NPK fertilizer
combinations on incidence of inlorescence blight disease of cashew at Ochaja,” inAnnual Report of Cocoa Research Institute of Nigeria, p. 31, 1990.
[35] L. hompson and F. Troeh,Soils and Soils Fertility, Mc-Graw-Hill, New York, NY, USA, 4th edition, 1978.
[36] P. O’Farrell, J. Armour, and D. Reid, “he efect of nitrogen on cashew in north Queensland,” RIRDC Publication no W02/001, RIRDC Project no DAQ-257A, 2002.
[37] J. G. Ohler, “Cashew Koninklijk Instituut Voor de Tropen Arm-sterdam,”Nigeria Agricultural Journal, p. 260, 1979.
[38] O. S. Ibiremo, M. O. Ogunlade, O. J. Oyetunji, and B. D. Adewale, “Dry matter yield and nutrient uptake of cashew seedlings as inluenced by arbuscular mycorrhizal inoculation, organic and inorganic fertilizers in two soils in Nigeria,”ARPN : Journal of Agricultural and Biological Science, vol. 7, no. 3, pp. 196–205, 2012.
Submit your manuscripts at
http://www.hindawi.com
Forestry Research
International Journal ofHindawi Publishing Corporation
http://www.hindawi.com Volume 2014
Public Health
Hindawi Publishing Corporation
http://www.hindawi.com Volume 2014
Hindawi Publishing Corporation
http://www.hindawi.com Volume 2014
Ecosystems
Journal ofMeteorology
Hindawi Publishing Corporation
http://www.hindawi.com Volume 2014
Advances in
Hindawi Publishing Corporation
http://www.hindawi.com Volume 2014
Marine Biology
Journal of Hindawi Publishing Corporationhttp://www.hindawi.com Volume 2014
Hindawi Publishing Corporation http://www.hindawi.com
Applied &
Environmental
Soil Science
Volume 2014
Advances in
Hindawi Publishing Corporation
http://www.hindawi.com Volume 2014
Environmental Chemistry Atmospheric Sciences
International Journal of
Hindawi Publishing Corporation
http://www.hindawi.com Volume 2014
Hindawi Publishing Corporation
http://www.hindawi.com Volume 2014
Hindawi Publishing Corporation
http://www.hindawi.com Volume 2014
International Journal of
Geophysics
Hindawi Publishing Corporation http://www.hindawi.com
Volume 2014
Geological ResearchJournal of
Earthquakes
Journal ofHindawi Publishing Corporation
http://www.hindawi.com Volume 2014 Hindawi Publishing Corporation
http://www.hindawi.com
Volume 2014
Biodiversity
International Journal ofScientifica
Hindawi Publishing Corporationhttp://www.hindawi.com Volume 2014
Oceanography
International Journal ofHindawi Publishing Corporation
http://www.hindawi.com Volume 2014
The Scientiic
World Journal
Hindawi Publishing Corporationhttp://www.hindawi.com Volume 2014
Journal of Computational Environmental Sciences
Hindawi Publishing Corporation
http://www.hindawi.com Volume 2014
Hindawi Publishing Corporation
http://www.hindawi.com Volume 2014