Research Journal of Applied Sciences, Engineering and Technology 8(2): 235-242, 2014 ISSN: 2040-7459; e-ISSN: 2040-7467
© Maxwell Scientific Organization, 2014
Submitted: April 08, 2014 Accepted: April 28, 2014 Published: July 10, 2014
Corresponding Author: M.H. Jali, Faculty of Electrical Engineering, Universiti Teknikal Malaysia Melaka, Hang Tuah Jaya, 76100 Durian Tunggal, Melaka, Malaysia
Classification of EMG Signal Based on Human Percentile using SOM
M.H. Jali, Z.H. Bohari, M.F. Sulaima, M.N.M. Nasir and H.I. Jaafar
Faculty of Electrical Engineering, Universiti Teknikal Malaysia Melaka, Hang Tuah Jaya, 76100 Durian Tunggal, Melaka, Malaysia
Abstract: Electromyography (EMG) is a bio signal that is formed by physiological variations in the state of muscle fibre membranes. Pattern recognition is one of the fields in the bio-signal processing which classified the signal into certain desired categories with subject to their area of application. This study described the classification of the EMG signal based on human body percentile using Self Organizing Mapping (SOM) technique. Different human percentile definitively varies the arm circumference size. Variation of arm circumference is due to fatty tissue that lay between active muscle and skin. Generally the fatty tissue would decrease the overall amplitude of the EMG signal. Data collection is conducted randomly with fifteen subjects that have numerous percentiles using non-invasive technique at Biceps Brachii muscle. The signals are then going through filtering process to prepare them for the next stage. Then, five well known time domain feature extraction methods are applied to the signal before the classification process. Self Organizing Map (SOM) technique is used as a classifier to discriminate between the human percentiles. Result shows that SOM is capable in clustering the EMG signal to the desired human percentile categories by optimizing the neurons of the technique.
Keywords: Biceps brachii, classification, electromyography, human percentile, pattern recognition, self organizing map
INTRODUCTION
Research on EMG classification is essential in the field of ergonomics, sports science, rehabilitation, medical research and human technology interaction. It required a strong foundation of the neuromuscular system, signal properties and impact of the tools used during signal acquisition in order to collect meaningful data.
Historically, human percentile is used to establish the portion of user population for specific design. It allow the subjects with specific percentile to fit on any critical dimensions Human percentile is an anthropometric dimensions for each population that are ranked by size. For instance, 5th percentile represents smallest measurement while 95th percentile represents largest dimensions (Scott and Erin, 2006). Different human percentile definitively varies the arm circumference size. Variation of arm circumference is due to fatty tissue that lay between active muscle and skin.
There are several external factors that could influenced the behaviour of EMG signal such as tissue characteristics, physiological cross talk, changes in the geometry between muscle belly and electrode site, external noise and selection of electrode and amplifiers. In this study, the focus is the tissue characteristics. Principally, human body is a very good electrical
conductor but the conductivity is highly dependent to the tissue characteristics. Several reasons that affect the tissue performance are thickness, type, physiological change and temperature. Thus, the EMG signals vary from subject to subject that avoid direct quantitative comparison of EMG amplitude (Peter, 2006).
This research used SOM technique to cluster the EMG signal according to the human body percentile. SOM is an unsupervised learning (learning by observation) refers to the method that learns by itself according to input attributes and also applies competitive learning that made the output nodes to compete to be activated. Only one of the node will activated at any one time or we called winning neuron (Bohari et al., 2014). Such a competition can be induced through negative feedbacks between neurons. All nodes are forced to be self-organized through the feedback path.
LITERATURE REVIEW
Res. J. Appl. Sci. Eng. Technol., 8(2): 235-242, 2014
EMG signal and the arm gesture movement (Wang and Buchanan, 2002; Hudgins et al., 1993; Kelly et al., 1990; Chiharu et al., 2012). Tsuji et al. (1992) implement neural network based on statistics structure while Kentarou et al. (2006) use combination of chief ingredient analysis and fast fourier transform. Other uses the hybridization of multivariate auto regression model and hidden Markov Model (Joyce et al., 2008). K-NN algorithm that has been used by Killer et al. (1986) is widely is for EMG classification which based on the distance similarity matching. This technique has advantage of simplicity but it cannot cater complicated features.
Simon (1999) use back propagation neural network that seems more robust because it can learn the relationship between inputs and desired outputs. However the downside of it is the complexity increased exponentially when the number of inputs increases. Chan et al. (2000) design a fuzzy inference that applied back propagation algorithm to train the fuzzy rules for classification. Hamedi et al. (2012) used FCM techniques due to its flexibility, fast training, easy to use and low cost of calculation.
Bartuzi et al. (2010) has conducted a study on the effect of the fatty tissue on EMG signal in young women. They describe the influence of fatty tissue on EMG signal as a function of force level. Fatty tissue layer also could cause inaccuracy in the measurement because it decrease the EMG signal amplitude and increase the cross-talk in muscles adjacent to activated muscle as well as attenuate the potential distribution present at muscle force. The tissue overlying the muscle, fatty tissue and skin thickness would change the EMG signal shape. When muscle is surrounded by fatty tissue, extracellular fluid and skin, the current field will be inflected and the level of impedance will be
Fig. 1: Research strategy
varies because the skin tissue acts as a filter for a signal. Subject with great body fat will have more signals filtered before reaching the electrode that will cause the amplitude of the signal greatly drop.
METHODOLOGY
Figure 1 shows a flow diagram of our research methodology that consists of four major phases. It started with the EMG data acquisition. Second phase is EMG signal post processing. Third phase is the time domain features extraction and finally classification using SOM technique.
EMG data acquisition: Historically, human percentile is used to establish the portion of user population for specific design. It allows the subjects with specific percentile to fit in any critical dimensions. Human percentile is calculated based on the distribution of data which multiply the standard deviation SD by a factor z then add the product to the mean m. The formula is
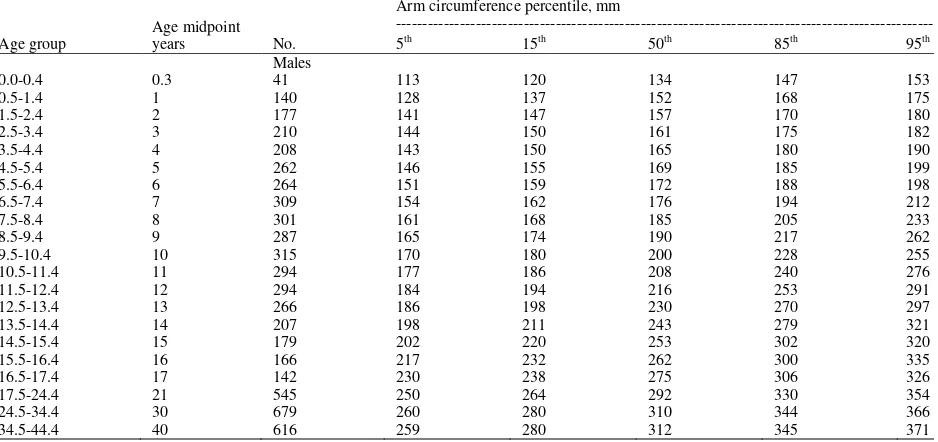
Table 1: Percentile of upper arm circumference (Frisancho, 1974)
Res. J. Appl. Sci. Eng. Technol., 8(2): 235-242, 2014
Table 2: Predefined subject details
Subject 1 2 3 4 5
Subject Label Status
1 T1 Random data
12 T12 Predefined data for 50th percentile
13 T13 Predefined data for 5th percentile
14 T14 Random data
15 T15 Random data
Survey conducted by Frisancho (1974) shows the relationship between the human percentiles with the right upper arm circumference for male and females. As the arm circumference increase, the subcutaneous fat also increase which affect the EMG signal behaviour. This is proved by the measurement done to the 5637 males and 6759 females aged 0 to 44 years. This study has produced a relationship between human body percentiles with average arm circumference size as shown in Table 1.
Three male subjects that represent five arm circumference percentiles which are 5, 15, 50, 85 and 95th,respectively are selected based on guidelines in Table 1. The EMG signals from these subjects are used as predefined data for signal classification later on. The subject’s particular detail is tabulated in Table 2.
The predefined data is included randomly into sample of 15 healthy male subjects as shown in Table 3. From the human anatomy studies, the movements of upper limb with elbow as the reference is depend on relation of agonist and antagonist. In this study is focusing on the behaviour of biceps muscle as agonist and the triceps as the antagonist, respectively. Muscle that involved in this movement is biceps and triceps, however in this study to understand the electrical activity during muscle contraction, the biceps is the only muscle that taking into account. The movements’ ranges in between position of arm flexion until arm fully extend.
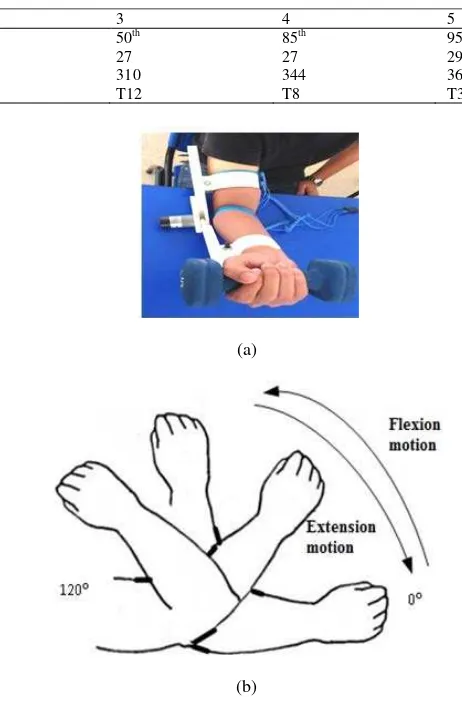
The environment is in a room with low lighting especially the fluorescent light, any electromagnetic devices is away from the experiment equipment and the environment is in silent room. Then, the experimental is set up with the subject sit on the chair while the hand is on the table. The assistive devices (white in colour on Fig. 2a) helps to keep the position of the elbow joint
(a)
(b)
Fig. 2: (a) subject is set-up with arm assistive device for experiment, (b) simulation of subject’s to lift up the dumbbell 2.268 kg of weight
and the wrist joint in line. Mostly, the EMG signal is obtained after several trials of the movements. These movements are specified from angle of 0° (arm in rest position), up to 120° (arm is fully flexion). The subject has to complete the task of lift up the dumbbell with 2.268 kg of weigh in Fig. 2b. Normally, the appearance of EMG signal is chaos and noisy depends on the type of electrodes also the noise factor. To simplify the difference of amplitude response for the motion, the dumbbell is functioned to amplify the amplitude in analysing the electrical activity during rest and contract. These electrodes are connected to the combination of Olimex EKG-EMG-PA and Arduino Mega for data collection (Jali et al., 2014).
Res. J. Appl. Sci. Eng. Technol., 8(2): 235-242, 2014
(a) (b)
(c) (d)
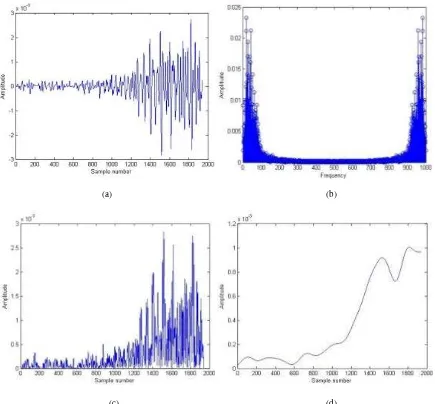
Fig. 3: (a) raw EMG signal, (b) power spectral density, (c) rectified signal, (d) smooth signal
applied to eliminate the interference from line AC and radio frequency. Then, a high pass filter in a range of 5-10 Hz is applied for DC offset. The filter preserves the wave shape of any filtered signals across the group
delay in the pass band. The DC offset of the EMG
signal is removed and rectified to obtain its absolute value as shown in Fig. 3c. In order to observe the variation of signal in different frequency components, the FFT signal is represented by Power Spectral Density (PSD). From the PSD we can describes how the signal energy or power is distributed across frequency. Figure 3b shows that most of the power is in the range of below 10 Hz, Finally, the signal is smoothed and normalized passing it through a 5th order Butterworth type low-pass filter with cut off frequency 10 Hz as shown in Fig. 3d.
Time-domain features extraction: In order to achieve an efficient EMG pattern recognition, multiple features
need to be employed as input to the classifier. Each feature reflects a unique character individually. Therefore, a combination of several features capable to describe the classification system more accurately (Ahsan, 2011). A feature extraction is very important to transform the raw signal into reduced representation set of features. These features could complement each other to exhibit the behavior of the EMG signal itself which is very useful for classification process. Five time domain feature extraction methods which are Standard Deviation (STD), Root Mean Square (RMS), Mean Absolute Value (MAV), Variance (VAR) and Zero Crossing (ZC) are chosen for this study.
Res. J. Appl. Sci. Eng. Technol., 8(2): 235-242, 2014
Root mean square: The RMS represents the square root of the average power of the EMG signal for a given period of time. It is known as a time domain variable because the amplitude of the signal is measured as a function of time:
∑
=Mean absolute value: The MAV is the computer calculated equivalent of the Average Rectified Value (ARV). The MAV is known as a time domain variable because it is measured as a function of time. It represents the area under the EMG signal once it has been rectified, it is defined by the negative voltage values have been made positive. The mean absolute value is calculated using a moving window. It is calculated for each window of data according to the equation:
���= 1
�∑�1|�(�)| (3) Standard deviation: The STD of a set of data is the square root of the variance, where �̅ refers to the mean of the sample. The STD is often used as the fluctuation for a sample when data is being collected in an experiment. The results taken from data are frequently written as the mean±STD:
Variance: VAR is a feature that utilizes the EMG signal power. It takes the mean value of the square of the deviation. However, mean of EMG signal is close to zero. In consequence, variance of EMG can be calculated by:
Zero crossing: ZC is a feature that represents the number of times that the amplitude value of EMG crosses the zero y-axis. It provides an approximation of frequency domain properties. The threshold condition is used to abstain from the background noise. It can be formulated as:
Classification using SOM: Based on neurological studies, all human sensory inputs are mapped onto
certain areas at the cerebral cortex that form a map called Topographic Map (Bohari et al., 2014). It has two most essential assets:
• At each stage of processing, every each information is reserved in its proper environment.
• Close related information nodes will be close to each other to ensure short synaptic connections.
SOM primary purpose is to transform incoming input patterns into a one or two dimensional discrete map. This process must be performing in orderly approach. In this study, SOM is used to classify the EMG signal that has been randomly collected from 15 subjects according to their body percentile.
For this SOM clustering hexagonal lattice is selected and numbers of neurons is increased from 100 to 300 to optimize SOM result. Normalization method used in this research in ‘range’ normalization. The performances of each combination of feature are evaluated according to their quantization error, topographic error and training time.
Architecture of SOM network: SOM structure built from two main layers; input and output layer that sort in two-dimensional preposition. SOM algorithms resemble Learning Vector Quantization (LVQ). In LVQ all neurons are arranged on a grid together with selected neurons whereas SOM has a feed-forward structure with a single computational layer arranged in rows and columns. Each neuron is fully connected to all the source nodes in the input layer. Neighbouring nodes will be updated to perform neurons order. This indicates that SOM as a multidimensional scaling method from input space to two-dimensional output space. Visual format of SOM help researcher to define clusters, relations and structures in complex input database (Bohari et al., 2014).
Best Matching Unit (BMU): Number of neuron may vary from a few dozen up to several thousands. Each neuron is represented by a d-dimensional weight vector (prototype vector, codebook vector) m = [m1,...., md],
where d is dimension of input vectors. Neurons connected to the adjacent neurons through neighbourhood relation that dictates its topology.
SOM is then subjected to iteration for training the network. In the iteration process, one sample vector s from the input data will be selected randomly and the distances between all the nodes are then calculated by particular distance measures. The neurons that have closest weight vector to the selected sample sis called Best Matching Unit (BMU) and denoted by c:
‖� − ��‖=����‖� − ��‖ (7)
where,
Res. J. Appl. Sci. Eng. Technol., 8(2): 235-242, 2014
Upon determining BMU, SOM weight vectors are updated so that the BMU will be closer to the input vector in input space. This adaptation process will stretch the BMU and its topological neighbours towards the sample vector (Bohari et al., 2014).
RESULTS AND DISCUSSION
In order to optimize the SOM performance, different numbers of neurons are simulated until achieved the satisfactory results. Satisfactory result is defined as the best tradeoff between each performance variable. For instance, the lowest value of topographic error, quantization error and training time does not mean the number of neurons is the best performance unless the U-Matrix mapping result shows the best
quality in term of clarity of separation and boundary between the SOM clustering.
From Table 4, it can be seen that training time keep on rising when the number of neurons increase. However based on simulation, training time surge abruptly up to 8 sec when the number of neurons larger than 300. Thus, the simulation stops at the number of neurons 300. Training time of 5 sec is still acceptable because it produce value of both quantization and topographic error around zero. Further investigation need to be conducted in term of U-Matrix mapping to select the best number of neurons.
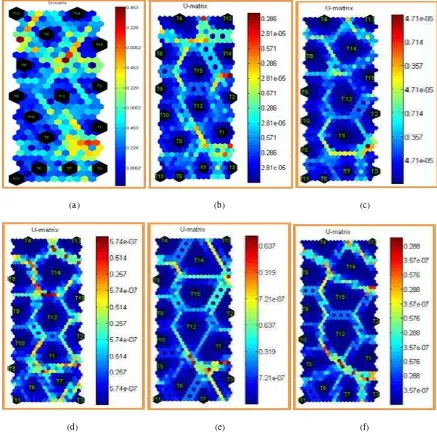
Figure 4a to f depicted U-Matrix mapping result that represent the number of neurons of 100, 150, 200, 250, 280 and 300, respectively. By using hexagonal topology, it can be observed that the clarity of
(a) (b) (c)
(d) (e) (f)
Res. J. Appl. Sci. Eng. Technol., 8(2): 235-242, 2014
Table 4: SOM clustering performance No. of
neurons
Quantization
error Topographic error
Training time (sec)
100 0.017 0.000 0
130 0.004 0.067 1
150 0.004 0.000 1
180 0.004 0.133 1
200 0.001 0.000 2
230 0.001 0.000 3
250 0.000 0.067 3
280 0.000 0.133 4
300 0.000 0.067 5
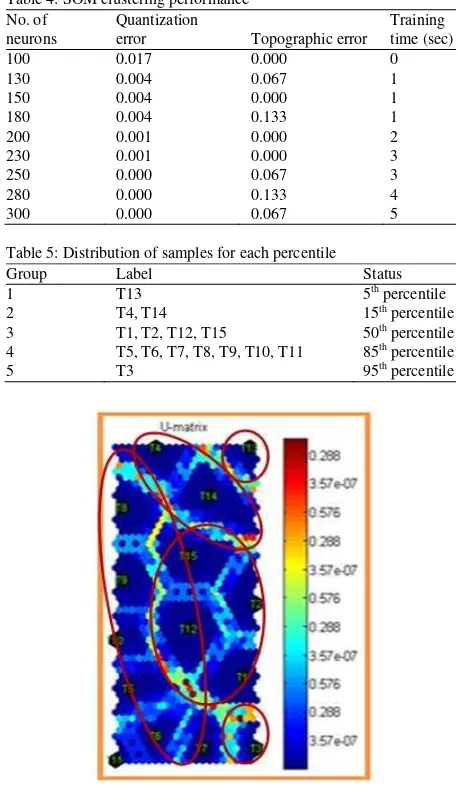
Table 5: Distribution of samples for each percentile
Group Label Status
1 T13 5th percentile
2 T4, T14 15th percentile
3 T1, T2, T12, T15 50th percentile 4 T5, T6, T7, T8, T9, T10, T11 85th percentile
5 T3 95th percentile
Fig. 5: U-matrix that has clustered into five groups
Fig. 6: Maximum EMG amplitude of the subjects and band categories of human percentile
separation and boundary of the mapping is improved when the number of neurons increases. Since we were targeting to classify the EMG signal into five categories, Fig. 4f that represents number of neurons of
300 is the best contender for the U Matrix mapping result. The clarity and quality of mapping is the best since it produce the clearest boundary or separation between different categories produced by SOM clustering. Figure 5 shows a clearer view of U-Matrix that has been clustered into five groups.
Next, the predefined data that has been declared earlier is utilized to identify the group that has been clustered fall under which categories of human percentile. Table 5 summarize that the distribution of the samples is distinguishable for each percentile.
Finally, the SOM classification result needs to be verified to ensure that all subjects have been clustering in an appropriate category. Based on the literature that has been described in the early section, the higher human percentile would definitively have the bigger arm circumference size. The size of the arm circumference is due to the fatty tissue lay between skin and active muscle. Fatty tissue would cause the amplitude of EMG signal decreased. Figure 6 shows the maximum amplitude of each subject. It shows direct relationship between EMG signal amplitude and the human percentile by taking into account the subject that has been clustered in a group by SOM techniques in Table 5. The subject above the green band represent 5th percentile, green band represent 15th percentile, yellow band represent 50th percentile, blue band represent 85th percentile and finally below the blue band is 95th percentile.
CONCLUSION
Based on the experimental result, it can be concluded that the SOM technique has successfully classify the EMG signal into the appropriate human percentile categories. The number of neurons needs to be optimized to produce the best SOM clustering result. In this research, number of neurons of 300 has produced the best tradeoff between the performance parameters as well as the U-Matrix mapping result. In addition, the clustering result also has been verified with the correlation of EMG signal amplitude with the human percentile size. Thus, it is proven that the SOM classification technique is capable to clustering the EMG signal based on the human percentile. It is recommended to enhance the features extraction for the classifier input to improve the U-Matrix clarity on the separation and boundary for each cluster.
ACKNOWLEDGMENT
Res. J. Appl. Sci. Eng. Technol., 8(2): 235-242, 2014
REFERENCES
Ahsan, M.R., 2011. Electromygraphy (EMG) signal based hand gesture recognition using Artificial Neural Network (ANN). Proceeding of the International Conference on Mechatronics (ICOM), Vol. 4.
Angkoon, P., L. Chusak and P. Pornchai, 2009. A novel feature extraction for robust EMG pattern recognition. J. Comput., 1(1): 71-80.
Bartuzi, P., T. Tomasz and R.L. Danuta, 2010. The effect of the fatty tissue on EMG signal in young women. Acta Bioeng. Biomech., 12(2): 87-93.
Bohari, Z.H., S. Ab Ghani, M.F. Baharom, M.N.M. Nasir, M.H. Jali and Y.H. Md Thayoo, 2014. Feature analysis of numerical calculated data from Sweep Frequency Analysis (SFRA) traces using self organizing maps. J. Teknol., 67(3).
Chan, F.H.Y., Y.S. Yang, F.K. Lam, Y.T. Chang and P.A. Parker, 2000. Fuzzy EMG classification for prothesis control. IEEE T. Rehabil. Eng., 8(3): 305-311.
Chiharu, I., S. Satoru, Sasaki and H. Hiroshi, 2012. Distinction of finger operation for myoelectric prosthetic hand on the basis of surface EMG. Proceeding of the 16th CSI International Symposium on Artificial Intelligence and Signal Processing (AISP), pp: 428-434.
Frisancho, A.R., 1974. Triceps skin fold and upper arm muscle size norms for assessment of nutritional status. Am. J. Clin. Nutr., 27(10): 1052-1058. Graupe, D., J. Magnussen and A.A.M. Beex, 1978. A
microprocessor system for multifunctional control of upper limb prostheses via myoelectric signal identification. IEEE T. Automat. Contr., 23(4): 538-544.
Hamedi, M., S.H. Salleh, A.M. Noor, T.T. Swee and I.K. Afizam, 2012. Comparison of different time-domain feature extraction methods on facial gestures' EMGs. Proceedings of the Progress in Electromagnetics Research Symposium, pp: 1897-1901.
Hudgins, B., P.A. Parker and R.N. Scott, 1993. A new strategy for multifunction myoelectric control. IEEE T. Biomed. Eng., 40(1): 82-94.
Jali, M.H., M.F. Sulaima, T.A. Izzuddin, W.M. Bukhari and M.F. Baharom, 2014. Comparative study of EMG based joint torque estimation ANN models for arm rehabilitation device. Int. J. Appl. Eng. Res., 9(10): 1289-1301.
Joyce, C., Z. Jane Wang and J.M. Martin, 2008. A Hidden Markov, multivariate autoregressive (HMM-mAR) network framework for analysis of surface EMG (sEMG) data. IEEE T. Signal Proces., 56(8): 4069-4081.
Kelly, M.F., P.A. Parker and R.N. Scott, 1990. The application of neural networks to myoelectric signal analysis: A preliminary study. IEEE T. Biomed. Eng., 37(3): 211-230.
Kentarou, N., A. Keiiti, Y. Masahumi and M. Kazushige, 2006. Recognition of hand motions based on multi-channel SEMG employing the Monte Carlo method for channel selection. T. Jpn. Soc. Med. Biol. Eng., 44(1): 138-147.
Killer, J.M., M.R. Gray and J.A. Givens, 1986. A fuzzy k-nearest neighbor algorithm. IEEE T. Syst. Man Cyb., 15(4): 580-585.
Lee, S. and G.N. Saridis, 1984. The control of a prosthetic arm by EMG pattern recognition. IEEE T. Automat. Contr., 29(4): 290-302.
Peter, K., 2006. The ABC of EMG: A Practical Introduction to Kinesiological Electromyography. Version 1.4, Noraxon Inc., U.S.A.
Scott, O. and T. Erin, 2006. Ergonomics and Design: A Reference Guideline. Diane Publishing, New York. Simon, H., 1999. Neural Networks: A Comprehensive
Foundation, Prentice Hall, New Jersey.
Tsuji, T., D. Mori and K. Ito, 1992. Motion discrimination method from EMG signals using statistically structured neural networks. T. Inst. Electr. Eng. Jpn., 112-C(8): 465-473(in Japanese). Wang, L. and T.S. Buchanan, 2002. Prediction of joint