EffEct of cooling RatE on thE
MicRostRuctuREs and haRdnEss of fe-ni-cr
supERalloy
J. Ridhwan1, E. hamzah2, H. Efendy3, M.Z. selamat4, Z. Zulfatah5
1,3,4,5Faculty of Mechanical Engineering,
Universiti Teknikal Malaysia Melaka, Hang Tuah Jaya, 76100 Durian Tunggal, Melaka, Malaysia
2Faculty of Mechanical Engineering, Universiti Teknologi Malaysia, 81310 UTM Skudai, Johor Bahru, Malaysia
Corresponding email: 1[email protected]
ABSTRACT
Fe-Ni-Cr superalloy is a heat resistant material that shows good mechanical strength and resistance to oxidation and corrosion at high temperature. Heat treatment was conducted on Fe-Ni-Cr superalloy to observe its efect on the microstructures and mechanical property namely hardness. Solution treatment were carried out at 900oC, 975oC, 1050oC, and 1125oC followed by two cooling methods i.e quenching and air cool. The samples were analyzed by using materials characterization techniques such as SEM, XRD, and optical microscope. The Fe-Ni-Cr superalloy formed mainly dendritic austenitic structure with Cr23C6 precipitated along the
grain boundaries. Increase in solution treatment temperature results in dissolution of chromium carbide, coarser grain, and lower hardness. Diferent cooling rate ater solution treatment shows that fast cooling produces fewer and iner chromium carbide (Cr23C6) precipitates, iner
grain, and higher hardness as compared with slow cooling rate. Highest hardness value which is 213.5 Hv was recorded on sample solution treated at 900oC followed by water quenched.
KEYWORDS: Fe-Ni-Cr superalloy, Solution treatment, Cooling rate,
Precipitation
1.0 intRoduction
Heat resistant material is one type of superalloy that extensively used in engineering design especially in high temperature application. The high temperature strength of all superalloys is based on the principle of a stable face-centered cubic (FCC) matrix combined with either precipitation or strengthening and solid-solution strengthening (ASM Handbook, 1991). Iron-Nickel-Chromium alloy (Fe-Ni-Cr) is one type of super alloy which is being used as heat resistant material. The combination of iron, nickel, and chromium provides a desired characteristic needed for this material to operate in high temperature environment.
This research is carried out to determine the efects of diferent cooling rate during heat treatment on the microstructures and hardness of Fe-Ni-Cr superalloy.
2.0 MEthodology
All samples prepared for heat treatment was cut into 10 x 10 x 10 mm dimensions. The cuting process was conducted by using abrasive cuter with continuous supply of coolant in order to avoid microstructure change from excessive heat.
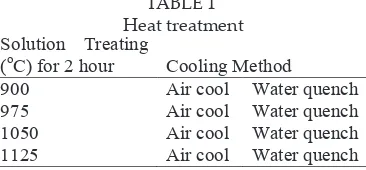
In order to study the efects of heat treatment on the microstructure and hardness of Fe-Ni-Cr superalloy, the types of heat treatments selected were solution treating followed by two diferent cooling method.
Table 2.1 shows the heat treatment temperature and time as well as cooling method conducted.
The heat treated samples were analyzed by several materials characterization techniques which are optical microscope, scanning electron microscope (SEM), energy dispersive x-ray spectroscopy (EDX), x-ray difraction (XRD), volume fraction analysis and hardness test.
from 240, 320, 400, 600, 800, 1200, and 2400. Once grinding was completed where only sot scratch was detected on the surface, the specimen undergone polishing processed with alumina solution in order to produce deformation free surface which are lat, scratch free, and mirror appearance. Finally, etchant was applied to the specimen surface to reveal the microstructure of specimen. The etchant used was combination of 45 ml glycerol, 30 ml hydrochloric acid, and 15 ml nitric acid.
Hardness test was conducted by using Vickers Hardness machine on specimen before and ater heat treatment process. The load used was 30 kgf and indentation duration was 15 seconds. In order to obtain an accurate and reliable result, 5 indentations placed on each specimen and average reading was taken.
Grain size is the diameter of individual grain on microstructure of material. However, Fe-Ni-Cr superalloy has a dendritic structure, thus, the grain size was measured according to Dendritic Arm Spacing (DAS). Technically, the measurement will be conducted perpendicularly along the dendrite and DAS is calculated by division of total length with number of dendrite intercepted. Average value was calculated from 15 measurements on diferent dendrites.
Volume fraction of carbide was measured by using image analyzer sotware, Omnimet. SEM micrograph was analyzed by measuring the area fraction of carbide on microstructure. Area fraction is the fraction of carbide area with respect to the matrix area.
According to ASTM E1245-03, the relationship between volume fraction and area fraction are as follows;
AA = the area fraction of the inclusion or constituent Ai = the area of the detected feature
AT = the measurement area (ield area)
3.0 REsults and discussion
3.1 optical Micrograph observation
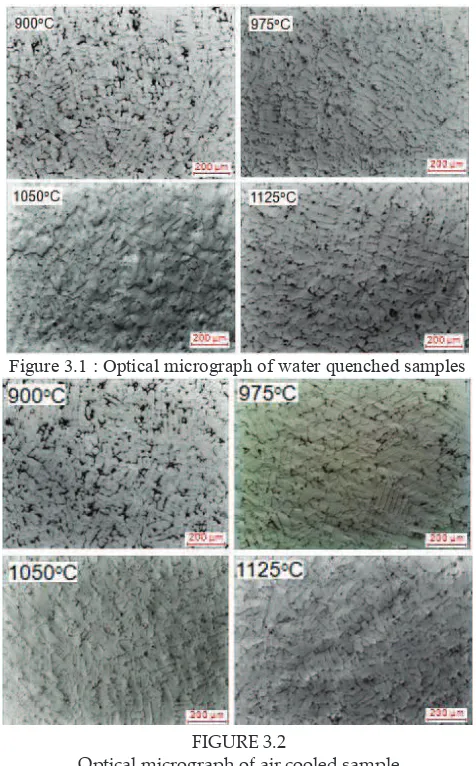
Figure 3.1 : Optical micrograph of water quenched samples
FIGURE 3.2
Optical micrograph of air cooled sample FIGURE 3.2 Optical micrograph of air cooled sample
Due to its dendritic structure, the grain size measurement was conducted by measuring the dendritic arm spacing (DAS). Figure 3.3 shows the graph ploted on the DAS of heat treated samples. All samples show an increasing trend of DAS as temperature increase. This is because grain size is controlled by thermally activated process through the migration of grain boundary where the free energy of the boundaries acts as the major driving force for grain growth (Koul, 1982). Thus, an increase in solution temperature provides more free energy to the boundary which promote grain growth and results to grain coarsening.
nucleation will caused the grain become coarser. During continuous cooling, transformation occurred at certain temperature range. This range decreases with an increase in cooling rate. Thus, when cooling rate increase, grain size will decreased due to the increase in nucleation rate and decrease in growth rate. As cooling rate increases, the growth kinetic also become sluggish which causes the growth rate to decrease. This theory explained the reason of ine grain ater accelerated cooling. Furthermore, as cooling rate decrease, the grain has suicient time to grow and produces growth that is larger than fast cooling rate. As a result, the grain size of slower cooling rate samples is larger as compare to fast cooling rate.
of slower cooling rate samples is larger as compare to fast cooling rate.
FIGURE 3.3
Effect of cooling rates on Dendritic Arm Spacing (DAS ) FIGURE 3.3
Efect of cooling rates on Dendritic Arm Spacing (DAS )
SEM micrograph of all samples shows presence of chromium carbide, Cr23C6 which determined by EDX analysis. Figure 3.4 shows the EDX analysis of Cr23C6. SEM micrograph of heat treated samples was shown in igures 3.5 and 3.6.
FIGURE 3.4
FIGURE 3.4
FIGURE 3.5
Cr23C6 carbide Matrix
Carbide dissolved from grain boundary
FIGURE 3.5
SEM micrograph of water quenched samples
FIGURE 3.6
SEM micrograph of air cooled samples FIGURE 3.6
SEM micrograph of air cooled samples
Volume fraction analysis was conducted by using image analyzer to obtain an accurate volume of the carbide phase. The amount of carbide phase observed for water quenched and air cooled samples was decreased (dissolved from grain boundary) as solution temperature increased, this inding is similar as being observed by Jacuinde et.al. (2003).The reason for this behavior is at higher temperatures (above 1000oC), austenite tend to dissolve higher carbon contents, thus, the amount of secondary carbides retained is also minor (Jacuinde et.al, 2003). Meanwhile, in terms of diferent cooling rate, a curve is ploted to study the efect of cooling rate on precipitation of chromium carbide.
FIGURE 3.7
Effect of cooling rates on volume fraction of chromium carbide, Cr C Efect of cooling rates on volume fraction of chromium carbide, CrFIGURE 3.7
23C6
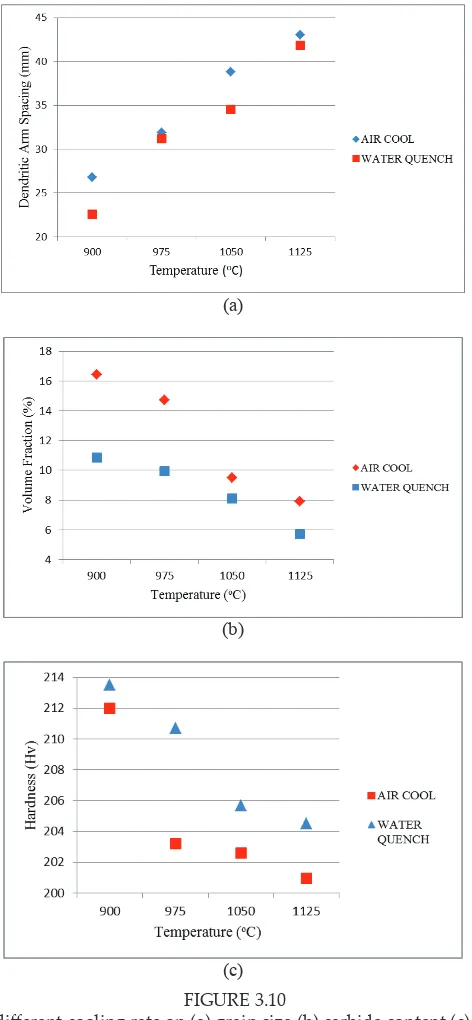
The result shown in Figure 3.7 illustrates higher carbide content in air cooled sample than water quenched sample. Larger diferences of carbide content are noticed at temperatures 900oC and 975oC where the diferences become smaller as the temperature increases.
Fast cooling rate from water quench produced lower carbide content because during fast cooling from solutioning temperature, the carbide did not have enough time to form and grow completely. This was due to suppression process that prevented the dissolved carbide to precipitate again when subjected to fast cooling. In fact, one of the main reasons to apply quenching was to minimize precipitation efects during cooling.
Meanwhile, slower cooling rate produced higher amount of carbide content because during cooling the carbide had enough time to form and grow ater being dissolved during solutioning. However, in certain cases, this method is not preferable since the precipitation process cannot be controlled and might produced uneven precipitation.
However, it should be noted that chromium carbide is a very hard phase and would not easily dissolved due to heating, especially at low temperature. Thus, at lower heating temperature, the carbide dissolution was not complete and thus some carbide remain in the material which during cooling will continue to grow provided signiicant time is given. This could be the reason of large diferences between air cool and water quenched sample at lower solution temperature as compare to high temperature since for water quenched sample, the carbide did not have enough time to precipitate compare to air cooled sample.
(a)
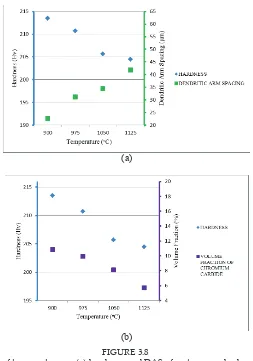
(b) FIGURE 3.8
Effect of temperature on (a) hardness and DAS of water quenched sampleFIGURE 3.8
Efect of temperature on (a) hardness and DAS of water quenched samples
(b) hardness and volume fraction of chromium carbide (Cr23C6) of water
quenched samples
(b) (b)
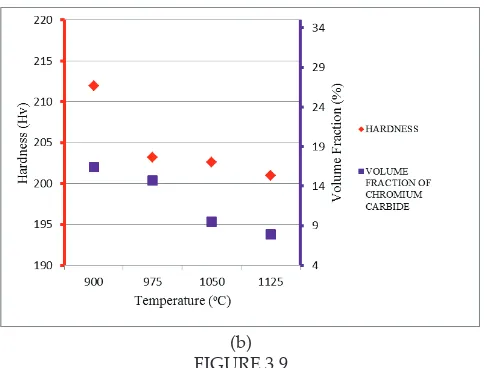
FIGURE 3.9
Efect of temperature on (a) hardness and DAS of air cooled samples (b)
hardness and volume fraction of chromium carbide (Cr23C6) of air cooled samples
As shown in Figures 3.8(a) and 3.9(a), the increment in grain size of both water quenched and air cooled samples is inversely proprtional to the hardness value. This shows that grain coarsening occured due to increases in temperature had lower the hardness of material. This is because increase in grain size had reduced the grain boundary strengthening efect (Koul, 1982). Meanwhile, iner grain causes more build up of dislocation at the grain edge. Since it requires a lot of energy to move dislocation to another grains, this dislocation will build up along the boundary which increase strength of alloy (Zhang et.al, 2008). This strengthening theory also known as Hall-Petch strengthening. Thus, Hall-Petch strengthening efect is reduced as grain size increased.
On the other hand, carbide content also afects the hardness of material. Figure 3.8 (b) and 3.9 (b) shows that hardness of heat treated sample was decreases as carbide content decrease. This inding is similar as being observed by Jacuinde et.al, 2003. This is due to presence of carbide precipitates will increased yield strength of alloy by blocking dislocation within the crystal (Orlova, 1981). Since dislocation can only move through this particle either by shearing or climbing, thus, this interruption in dislocation motion increase the strength of material.
by accelerated cooling. Grain size is determined by the number of nuclei until transformation is complete. Thus, large number of nuclei will caused the grain size become iner; meanwhile, small number of nucleation will caused the grain become coarser. During continuous cooling, transformation occurred at certain temperature range. This range decreases with an increase in cooling rate. Thus, when cooling rate increase, grain size will decreased due to the increase in nucleation rate and decrease in growth rate. As cooling rate increases, the growth kinetic also become sluggish which causes the growth rate to decrease. This theory explained the reason of ine grain ater accelerated cooling. Furthermore, as cooling rate decrease, the grain has time to grow and produces growth that is larger compare to fast cooling rate. As a result, the grain size of slower cooling rate is larger as compare to fast cooling rate.
Figure 3.10(b) illustrates higher carbide content in air cooled sample than water quenched sample. Larger diferences of carbide content are at temperatures 900oC and 975oC. As the temperature increases, the diferences become smaller. Fast cooling rate from water quench produced lower carbide content because during fast cooling from solutioning temperature, the carbide did not have enough time to form and grow completely (Stallybrass et.al, 2004). This was due to suppression process that prevented the dissolved carbide to precipitate again when subjected to fast cooling. In fact, one of the main reasons to apply quenching was to minimize precipitation efects during cooling.
Meanwhile, slower cooling rate produced higher amount of carbide content because during cooling the carbide had enough time to form and grow ater being dissolved during solutioning (Das et.al, 2003). However, in certain cases, this method is not preferable since the precipitation process cannot be controlled and might produce uneven precipitation. However, it should be noted that chromium carbide is a very hard phase and would not easily dissolved due to heating, especially at low temperature. Thus, at lower heating temperature, the carbide dissolution was not complete and thus some carbide remain in the material which during cooling will continue to grow provided signiicant time is given. This could be the reason of large diferences between air cool and water quenched sample at lower solution temperature as compare to high temperature since for water quenched sample, the carbide did not have enough time to precipitate compare to air cooled sample.
beter strengthening efect compare to coarse precipitate. These two theories explained the reason of higher hardness and strength of fast cooling rate as compare to slow cooling rate samples.
(a)
(b)
(c)
FIGURE 3.10 FIGURE 3.10
Efect of diferent cooling rate on (a) grain size (b) carbide content (c) hardness
In addition, XRD analysis shows that there is no phase formation or phase transformation occurred during heat treatment with diferent cooling rate. Figure 3.11 shows the XRD patern of water quenched and air cooled samples.
FIGURE 3.11 FIGURE 3.11
XRD patern of water quenched and aged sample
4.0 conclusion
The efects of cooling rate during heat treatment on microstructure and hardness of Fe-Ni-Cr superlloy have been investigated. Analysis of the results leads to few major indings. In terms of solution treatment, increase in temperature leads to increase in grain size but reduce the chromium carbide, Cr23C6 content and hardness value. In addition, grain coarsening behavior lower the hardness value due to its low grain boundary strengthening efect. Higher amount of ine chromium carbide in microstructure increase the hardness value due to precipitation strengthening efect while reduce amount of ine chromium carbide lower the hardness value. In terms of cooling rate, fast cooling rate produces slightly iner grain as compare to slow cooling which result to higher hardness. In addition, fast cooling rate also reduce the amount of chromium carbide precipitate by suppression due to heating. Highest hardness value which is 213.5 Hv was recorded on sample solution treated at 900oC followed by water quenched. XRD patern shows that there is no phase formation nor phase transformation during all series of heat treatment.
5.0 acKnoWlEdgEMEnts
6.0 REfEREncEs
M.M. Jabbari Behnama, P. Davamia, N. Varahram. 2010. Efect of cooling rate on
microstructure and mechanical properties of gray cast iron. Journal of Materials Science and Engineering A 528, 583–588.
L.Y. Zhang, Y.H. Jianga, Z. Ma, S.F. Shan, Y.Z. Jia, C.Z. Fan, W.K. Wang. 2008. Efect of cooling rate on solidiied microstructure and mechanical properties of
aluminium-A356 alloy. Journal of Materials Processing Technology 207, 107–111.
C. Sims, N. Stolof, W. Hagel. 1987. Superalloys II: High Temperature Materials for Aerospace and Industrial Power, John Wiley & Sons.
A. K. Koul, F. B. Pickering. 1982. Grain coarsening in Fe-Ni-Cr alloys and the inluence
of second phase particles. Acta metal, Vol. 30, 1303 to 1308.
A. B. Jacuinde, L. Arias, B. Hernández. 2003. Kinetics of Secondary Carbides
Precipitation in a High-Chromium White Iron, Journal of Materials Engineering and Performance, Volume 12(4), 371-382.
ASM Specialty Handbook. 1997. Heat-Resistant Materials, Editor(s): J.R. Davis. Wang, Xiong, Fan. 2009. Efects of high temperature and cryogenic treatment on the
microstructure and abrasion resistance of a high chromium cast iron. Journal of Materials Processing Technology 209, 3236–3240.
ASM Handbook Vol. 4. 1991. Heat Treating of Superalloy.
C. Stallybrass, G. Sauthof. 2004. Ferritic Fe–Al–Ni–Cr alloys with coherent precipitates
for high-temperature applications. Journal of Materials Science and Engineering A 387–389, 985–990.
S. Das, A. Ghosh, S. Chaterjee, P. Ramachandra Rao. 2003. The efect of cooling rate on
structure and properties of a HSLA forging. Scripta Materialia 48, 51–57.
Y. H. Lu, Q. Xing, H. Zhang. 1995. Efect of heat treatment temperature on tensile
