i
„I/We* admit that I/We* have
read this report and in my/our* opinion this report is fulfilled the scope and quality for award condition of Bachelor of Mechanical Engineering (Thermal-Fluids)’
Signature : ... Supervisor 1’s Name : ... Date : ...
Signature : ... Supervisor 2’s Name : ... Date : ...
ii
RESEARCH STUDY ON THE NOISE LEVEL AT THE NGV ENGINE
AHMAD RAZIF BIN RABUDIN
This report is being proposed as a
partial fulfillment in the requirement for bestowal of Degree in Bachelor of Mechanical Engineering (Thermal-Fluids)
Faculty of Mechanical Engineering Universiti Teknikal Malaysia Melaka
iii
“I hereby, declare this report is the result of my own research except as cited in the references”
Signature : ………..
Writer Name : ………..
iv
v
ACKNOWLEDGEMENTS
First of all, thank to Allah S.W.T for His blessing and His Messenger Muhammad S.A.W for His bonds of love in order to allow me completing this research report for the Projek Sarjana Muda (PSM). I would like to address my deepest gratitude and special thanks to Puan Rafidah Bt. Hassan, as my supervisor for this project for her guidance and kindness for helping and assisting me to complete this task.
Besides that, I also want to dedicate my special thanks to Fakulti Kejuruteraan Mekanikal, Universiti Teknikal Malaysia Melaka (UTeM) and the lab management staffs especially from the technicians for the cooperation and guidance throughout my project. I really appreciated all of their support and kindness.
Besides that, I would like to express my appreciation to my beloved family for the moral support and for staying firmly beside me through obstacles and also to all my truly beloved friends for the courage and strength that all of them gave to me during this project period. Thanks.
vi
ABSTRACT
vii
ABSTRAK
viii
CONTENT
CHAPTER ITEM PAGE
CONFESSION i
DEDICATION iv
ACKNOWLEDGEMENT v
ABSTRACT vi
ABSTRAK vii
CONTENT viii
LIST OF TABLE xiii
LIST OF FIGURE xiv
LIST OF SYMBOL, UNIT AND xvii
NOMENCLATURE
LIST OF APPENDIX xix
CHAPTER 1 INTRODUCTION 1
1.1 Background 1
1.1.1 Details of NGV 1
1.1.2 Details of Noise 2
1.2 Problem Statements 4
1.3 Objectives 4
1.4 Scope 4
1.5 Flow Chart 5
ix
CHAPTER ITEM PAGE
CHAPTER 2 LITERATURE REVIEW 7
2.1 Natural Gas Vehicles (NGV) 7
2.1.1 NGV development 8
2.1.2 Chemical composition 9
2.1.3 Energy content 9
2.1.4 Storage 9
2.1.5 Transport 10
2.1.6 Types of NGV engines 10
2.2 Noise 12
2.2.1 Noise level 13
2.2.2 Noise effect 13
2.2.3 Sources of noise 13
2.2.4 Signal noise 14
2.2.5 Noise measurement 15
2.2.6 Standards of noise measurement 15
2.2.7 Stage of Noise 16
2.2.8 Noise Descriptors 16
2.2.8.1 The n-Percent 17
Exceeded Level, Ln
2.2.8.2 L10, L50 and L90 18
2.2.8.3 Equivalent Continuous 19 Sound Pressure Level,
Leq
2.3 Sound Level Meters 20
x CHAPTER ITEM PAGE
2.3.3 Exponentially averaging 22
sound level meter
2.3.4 LAT or Leq: Equivalent 23
continuous sound level
2.3.5 Short Leq 24
2.3.6 International standards 25
2.3.7 Application of Sound Level 25
Meters
CHAPTER 3 METHODOLOGY 26
3.1 Equipments, apparatus and parameter 26
3.1.1 Equipments 27
3.1.2 Apparatus 28
3.1.2.1 Push key Definition 29 on Sound Level Meter
3.1.2.2 Setting for the Sound 31 Level Meter
3.1.3 Parameter 32
3.2 Experimental Procedure 33
3.3 Experimental Data Table 35
CHAPTER 4 ANALYSIS OF RESULT 37
4.1 Sound level test 37
4.2 Formula of calculation for Table 39
xi 4.3.1 Data Collection on Noise Level Measurement 40
for Proton Iswara
4.3.1.1 Graph on Noise Level 41
Measurement of NGV for Proton Iswara
4.3.1.2 Graph on Noise Level 42
Measurement of non-NGV for Proton Iswara
4.3.1.3 Comparison on the Noise 43 level for Proton Iswara
4.3.1.4 Percentage Difference for 44 Proton Iswara
4.3.2 Data Collection on Noise Level Measurement 46 for Proton Wira
4.3.2.1 Graph on Noise Level 47
Measurement of NGV for Proton Wira
4.3.2.2 Graph on Noise Level 48
Measurement of non-NGV for Proton Wira
4.3.2.3 Comparison on the Noise level 49 for Proton Wira
4.3.2.4 Percentage difference for 50 Proton Wira
CHAPTER 5 DISCUSSION 52
5.1 Result Overview 52
xii
5.2.1 NGV Engine Process 54
5.2.2 Petrol Engine Process 55
5.3 Source of error 56
CHAPTER 6 CONCLUSION AND SUGGESTION 58
6.1 Conclusions 58
6.2 Suggestions 59
REFERENCES 60
BIBLIOGRAPHY 62
xiii
LIST OF TABLE
NUMBER TITLE PAGE
1.1 Several property between Natural Gas, Gasoline 8 and Diesel (Source: Murphy, 1994).
3.1 Sample of Data Collection on Noise Level Measurement 35 for Proton Iswara
3.2 Sample of Data Collection on Noise Level Measurement 36 for Proton Wira
4.1 Data Collection on Noise Level Measurement for 40 Proton Iswara
xiv
LIST OF FIGURE
NUMBER TITLE PAGE
1.1 NM102 Noise Meter (Left) and Noise Meter 3
with Optional Calibrator (Right) (Source: Internet reference/13.09.2008)
1.2 The flow chart for the entire PSM activities 6
2.1 Range of sound pressure level 16
(Source: Internet references/16.09.2008).
2.2 Graph of the change of magnitude of a sound 17
or noise over time
(Source: Internet references/16.09.2008).
2.3 Graph illustrates the L10, L50 and L90. 18
(Source: Internet references/16.09.2008)
2.4 Graph of sound pressure level against time 19
(Source: Internet references/16.09.2008).
3.1 Standard specifications for Proton Iswara 27
xv 3.3 The model of 2238 Mediator of Sound Level Meter 29
4.1 The model of Proton Iswara Aeroback 1.3L 38
4.2 The model of Proton Wira 1.6L 38
4.3 The engine part and the Sound Level Meter 38
4.4 Graph of Noise level (dB) against Speed (rpm) of NGV 41 for Proton Iswara
4.5 Graph of Noise level (dB) against Speed (rpm) of non-NGV 42 for Proton Iswara
4.6 Graph of Comparison on the Noise level for Proton Iswara 43
4.7 Graph of Percentage Difference of Noise level (%) against 44 Speed (rpm) of NGV for Proton Iswara
4.8 Graph of Noise level (dB) against Speed (rpm) of NGV for 47 Proton Wira
4.9 Graph of Noise level (dB) against Speed (rpm) of non-NGV 48 for Proton Wira
4.10 Graph of Comparison on the Noise level for Proton Wira 49
4.11 Graph of Percentage Difference of Noise level (%) against 50 Speed (rpm) of NGV for Proton Wira
xvi
5.2 Process for Petrol Engine 55
xvii
LIST OF SYMBOL, UNIT AND NOMENCLATURE
NGV = Natural Gas Vehicle
CNG = Compressed Natural Gas
LNG = Liquefied Natural Gas
°F = Degree Fahrenheit
BTU = British Thermal Unit
CH4 = Methane
C2H6 = Ethane
C3H8 = Propane
C4H10 = Butane
H2S = Hydrogen sulfide
MJ = Mega Joule
kWh = Kilo Watt hour
lbf/in², = Pound feet per inches square
°C = Degree Celcius
dB = Desibel
dB(A) = Desibel (Ampere)
dBm = Desibel meter
Ln = n-percent exceeded level
LAn = n-percent exceeded level with A-weighting scale
L10 = 10-percent exceeded level
L50 = 50-percent exceeded level
L90 = 90-percent exceeded level
Leq = Equivalent Continuous Sound Pressure Level
xviii
RMS = Root Mean Square
LAT = Equivalent continuous sound level
xix
LIST OF APPENDIX
NUMBER TITLE PAGE
A Gantt Chart for PSM 1 63
1
CHAPTER 1
INTRODUCTION
1.1Background
The NGV and noise will be introduced as parts of the basic general information before this project proceed any further. The details of description between these two characteristics for this project are important as a guideline throughout the research that is being studied.
1.1.1 Details of NGV
2
Substantial savings (50%) in fuel cost
Lower operating cost
Contributes to a cleaner environment
Extended travel range
NGV is supported by the government with incentives and legislation to encourage vehicles owner to use NGV. NGV price is only 63.5 cent/litre equivalent of petrol, which make it cheaper than other fuels. NGV conversion kits are exempted from import duty and sales tax. Besides that, the reduction of road tax from existing levels also offers:
Monogas vehicle (NGV only) - 50% off.
Bi-fuel vehicle (Petrol & NGV) - 25% off.
Dual-fuel vehicle (Diesel & NGV) - 25% off.
All of these reasons are major factors for potential owners to consider when making their vehicle fuel choices. However, many owners may not be aware of the safety record of NGV vehicles. NGV vehicles safety record compares favorably to other traditional fuels or alternative fuels available today. This is due to the superior (and still improving) technology, higher safety standards and the physical properties of NGV itself which makes it as safe as or safer to use than petroleum-based fuels (Internet reference, 03/08/2008).
1.1.2 Details of Noise
3 sound level meter is designed to accurately measure the noise that we can hear, putting a real value to something that is so affected by perception (Internet reference, 04/08/2008).
The NM102 Noise Meter has been one of most popular noise measurement products in the following areas:
Police Departments (vehicle noise, community noise)
Factories and industrial complexes
Housing associations
Fire alarms and other alarm systems
Sound system installation
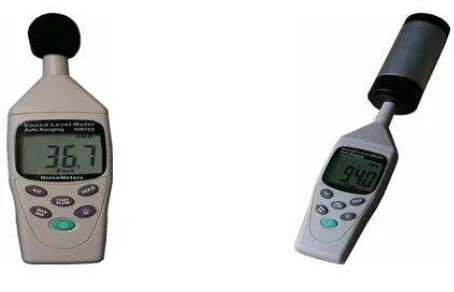
[image:23.612.222.449.457.603.2]Figure 1 below shows some example of the Noise Meter or Sound Level Meter. It shows the models from NM102 Noise Meter and Noise Meter with Optional Calibration manufactured by NoiseMeters Limited Company located at North Yorkshire, in United Kigdom.
Figure 1.1: NM102 Noise Meter (Left) and Noise Meter with Optional Calibrator (Right)
4 1.2 Problem Statements
This project is to determine and identify the sequences of the NGV and merely focus it from the noise level area in the aspects of safety, durability and stability that might come from the usage of NGV. Even though the NGV has been proven to save the money and fuel respectively, there are still few researches on the safety, durability and stability mainly on the sound or noise level which can necessarily resulting in the sound pollution and other side effects which can probably reduces the vehicle’s performance.
1.3 Objectives
There are several objectives which are carried out while doing this research and needs to be fulfilled. The objectives are:
To determine the noise levels of NGV engines and compare the differences with the petrol and diesel engines.
To determine the aspect of safety, durability and stability that might come from the usage of NGV
To familiarizes with the equipments that are being used to measure the noise level such as the noise level detector.
To gain experiences in conducting and operating experiments such as follows sequence procedure, collecting data, analyzing results and making final conclusion.