ISSN: 1693-6930
accredited by DGHE (DIKTI), Decree No: 51/Dikti/Kep/2010 411
Steady-State Stability Assessment Using Neural
Network Based on Network Equivalent
Indar Chaerah Gunadin*1, Muhammad Abdillah2, Adi Soeprijanto2, Ontoseno Penangsang2
1
Institut Teknologi Sepuluh Nopember, Universitas Hasanuddin, Makasar, Indonesia 2
Institut Teknologi Sepuluh Nopember, Surabaya, Indonesia
e-mail: [email protected], [email protected], [email protected], [email protected]
Abstrak
Sistem tenaga di seluruh dunia mengalami peningkatan pada ukuran dan kompleksitas yang diakibatkan oleh pengembangan sistem interkoneksi secara luas. Situasi ini akan membawa sistem tenaga lebih sering beroperasi mendekati batas kestabilan steady-state yang berakibat pada peningkatan ketidakstabilan tegangan atau voltage collapse. Paper ini menjelaskan perbaikan Steady-state Stability Limit (SSSL) pada system tenaga menggunakan kombinasi metode REI-Dimo dan Artificial Neural Network (ANN). REI-Dimo equivalent digunakan untuk memperoleh indeks SSSL pada sistem tenaga. Selanjutnya hasil dari REI-Dimo akan diajarkan pada metode ANN secara on-line. Studi ini dilakukan pada sistem Jawa-Bali 500kV. Dari simulari terlihat bahwa metode yang diusulkan dapat memprediksi SSSL pada sistem tenaga secara akurat. Metode melakukan perhitungan lebih efisien dan cocok digunakan untuk memonitor secara on-line kondisi kestabilan steady-state pada sistem tenaga.
Kata kunci: neural network,REI-Dimo,steady-state stability limit, voltage collapse
Abstract
Power systems in all over the world have increased in size and complexity due to rapid growth of widespread interconnection. This situation will make power system operated closer to steady-state stability limit (SSSL) resulting in higher probability voltage instability or voltage collapse. This paper presents SSSL assessment in power system using Artificial Neural Network (ANN) model based on REI-Dimo method. The equivalent REI-Dimo is used to determine SSSL indexof the power systems. Then, the result of REI-Dimo will be taught on ANN method via online. Studies were carried out on a Java-Bali 500kV system. The simulation showed that the proposed method could accurately predict the proximity to SSSL in power system. The method was computationally efficient and suitable for online monitoring of steady-state stability condition in the power systems.
Keywords: neural network,REI-Dimo,steady-state stability limit, voltage collapse
1. Introduction
The steady-state stability limit (SSSL) of a power system is “a steady-state operating condition for which the power system is steady-state stable but an arbitrarily small change in any of the operating quantities in an unfavorable direction causes the power system to loose the stability". An earlier definition refers to this concept as “the stability of the system under the conditions of gradually or relatively slow changes in the load". Voltage collapse, units getting out of synchronism, and instability caused by self amplifying small-signal oscillations are all forms of steady-state instability [3].
Empirically, the risk of steady-state instability is associated with low real or reactive power reserves, low voltage levels, and large bus voltage variations for small load or generated power changes. Recurring "temporary faults”, i.e. where breakers trip without apparent reason and which is disconnected by a protection without being able to identify the fault, might also be an indication of steady-state instability. Breaker trips can happen when loads increase due to "balancing rotors" of generators that are operated near instability trip and then get back in synchronism[1]-[7].
Equivalent REI (Radial, Equivalent and lndependent) has also been used to speed up and simplify the complex computational algorithms. For example, the rigorous solution of the steady-state stability problem is predicated on detailed machine model and entails an alternate sequence of load flow and eigenvalues calculating until the point of instability is found. However, determining eigenvalues for successively deteriorated load-flow cases is computationally intensive and has the inconvenience that load-flow may not converge near the instability. The use of equivalent in conjunction with appropriate simplifying assumptions is the only way to overcome such difficulties and Dimo's method has been successfully implemented and is currently used in several SCADA/EMS installations to compute the system load ability limits in real-time and to continuously monitor the distance to instability [8]-[9].
Recently, there has been considerable interest in the application of Artificial Neural Network (ANN) to power system [10-14]. ANN has the ability to classify complex relationships properly. The relationships classified by ANN are highly non linear and often result from large mathematical models. Once trained, the ANN can classify new data much faster than it would be possible by solving the model analytically: An integrated based systems, ANN, and conventional power system solution methodologies have potential to provide real-time optimization and control of power system [10]-[11].
This paper presents the application of ANN to provide fast indication of steady stability limit with the use of REI-Dimo result as training data. For online steady-state stability monitoring, it is essential to identify the maximum power of loading faster calculation so that the ANN method can be a alternative solution.
2. Research Method
2.1. REI-Dimo Approach For Steady-State Stability Assessment
Many references that are available describe the approach to steady-state stability assessment developed by Paul Dimo, starting, of course, with the books and papers written by Dimo himself. ln order to avoid overlap with already-published material, in this section we just briefly discuss just the key aspects of the technique and emphasize the assumptions that provide computational speed while preserving precision and accuracy. The theoretically oriented reader is directed to review reference [1,6], in which the more subtle aspects of Dimo's methodology are addressed in detail, including the generalization of Dimo's formulation of the reactive-power steady-state stability criterion.
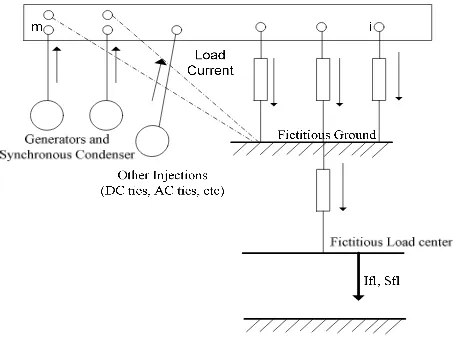
A power system consists of a linear sub-system, i.e., transmission lines, transformers, reactor, capacitors, and the bus-to-ground admittances to represent line charging and transformer taps; and a non-linear subsystem, i.e., generators, loads and synchronous condensers. Bus can divided into non-essential buses, which are to be eliminated, and essential buses, which are to be retained unchanged[1].
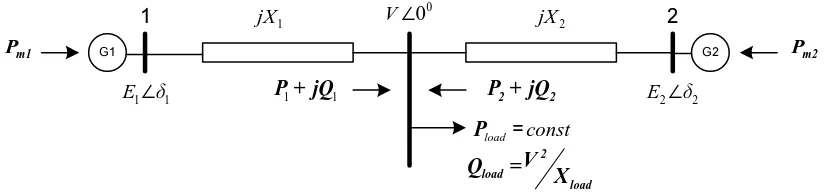
G1 G2 Pm2
Figure 1. Radial network of generators connected to the nodal point
The generators G1 and G2 the mechanical powers Pm1 and Pm2 equal the electrical MW generated powers, which are given by equations (1) and (2):
1
The generated real powers are entirely absorbed by the load Pload, as shown in equation (3):
1 2
And the reactive power of the load Qload is supplied by:
2 2 2
∂ because Qload is a function of V only, we obtain Jacobian matrix of the system [1]:
1 1
Then, we obtain the determinant D of Jacobian matrix:
Paul Dimo has shown that, for system of 1,..., m generators and synchronous condenser connected radially to a single-load bus (either actual or equivalent) through the admittance Y1,...,Yi,...,Y6, the derivative can be computed with formula [1]:
- 2 adjustments made under steady-state stability conditions)
= internal angles of the machines with reference to the voltage V on the load bus (either fictitious or actual)
V = Voltage in the load center YLoad = Load center admittance
Figure 2. Transition from the meshed power system network to radial scheme
to simplify, the formula in equation (8) will be separated be two component, such as:
D = m m d∆Q/dV is determined by changes in the parameters V and cosδm. The closer the distance load to the power plant that supplies the value cosδm, the greater it will be because the difference of angle bus that sends and receives is smaller. The result will be worth the value of D and E will be smaller and greater value. The small value of D and the greater value of E results in the distance to D = E or d∆Q/dV =0 which becomes more distant. Therefore, this method can increase the steady-state stability limit [15].
2.2. Neural Network Algorithm
the network. Once the error gradient is calculated, the weights are adjusted by using, for example, a descent gradient method.
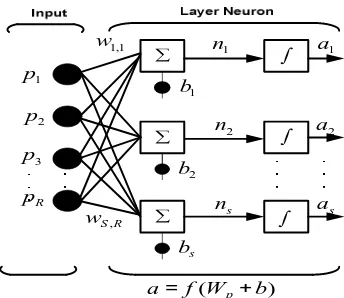
In this paper, a backpropagation neural network is utilized to map the highly non-linear relationship between network voltage profile of load center from REI-Dimo Equivalent and the corresponding steady-state stability limit of power system. First, the simulation starts with running the power flow program for Java-Bali system. Then, by using REI- Dimo equivalent, the system will be reduced into simple network by reducing all load buses into a representative load center buses. Network voltage profile of reduced model is provided by REI-Dimo.
∑
Figure 3. Architecture of ANN
The input pattern of steady-state stability is assessed by neural network (SSSANN). The number of input neurons of SSSANN is determined based on the size of the reduced model that obtained from REI-Dimo. There two output neurons which give the estimated SSSL. The number of hidden neurons is determined based on the trial and error. Generally, one of the drawbacks of neural network application in power system problems depends on its training on the power and load center voltage. Therefore, this dependency necessitates updating the training process in the case of any change in network parameter due to the increase of load center power. The input pattern of the proposed SSSANN is selected in such ways to obtain the representative of system. Therefore, in the case of load power change, network voltage profile, including the effect of network topology, load generation pattern, and reactive power compensation, remains as representative of system stability.
2.3 Structure of The Proposed Approach
Figure 4 shows the structure of the proposed approach. This approach consists of four
The parts of the structure of the proposed approach are as follows: reducing the Java-Bali system be a simplify power system using REI- Dimo; determining the index steady-state stability limit using REI-Dimo; changing the power in the load center to obtain the parameter of system such as: real power and reactive power generation, magnitude and phase of bus voltage, D and E constant, and SSSL index. All data obtained from steps (3) will be used to train, validate and test the ANN; and evaluating index SSSL using ANN
Table 1. Line Data of 500 kV Java-Bali Power System
From Bus To Bus R (pu) X(pu) B (pu)
1 2 0,000626496 0,007008768 0
1 4 0,006513273 0,062576324 0,01197964
2 5 0,013133324 0,146925792 0,007061141
3 4 0,001513179 0,016928309 0
4 5 0,001246422 0,01197501 0
4 18 0,000694176 0,006669298 0
5 7 0,00444188 0,0426754 0
5 8 0,0062116 0,059678 0
5 11 0,00411138 0,04599504 0,008841946
6 7 0,001973648 0,01896184 0
12 13 0,00699098 0,0671659 0,01285827
13 14 0,013478 0,12949 0,024789624
14 15 0,01353392 0,15140736 0,007276522
14 16 0,01579856 0,1517848 0,007264438
14 20 0,00903612 0,0868146 0
15 16 0,037539629 0,360662304 0,017261339
16 17 0,00139468 0,0133994 0
22 23 0,004435823 0,049624661 0,009539693
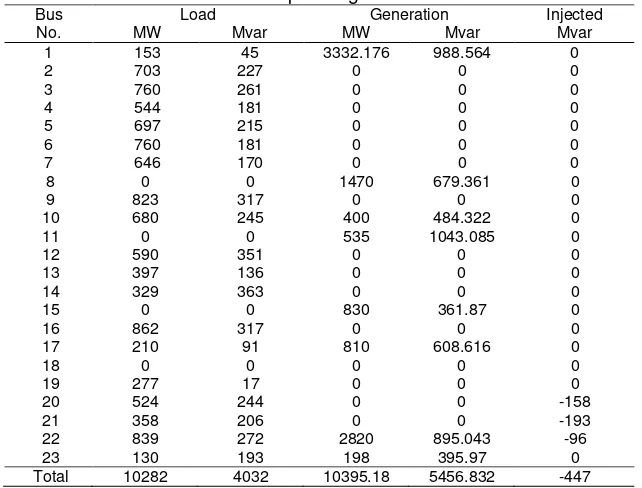
Table 2. Operating Condition
Bus No.
Load Generation Injected
2.4. Test Power System
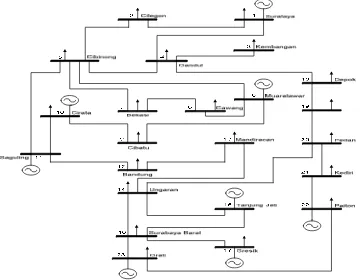
The Plant as the case for simulation is the 500 kV Java-Bali Power System as shown in Figure 5. The data of generator characteristics and cost, line impedances and an operating condition are shown at Tables 1-2.
Figure 5. Single Line Diagram of500 kV Java-Bali Power System
3. Results and Analysis
3.1 REI-Dimo Equivalent for Java-Bali System
Figure 6, shows the single load REI equivalent of Java Bali system with 8 generator bus and one load centre. The Y bus of equivalent system after Gaussian Elimination and REI-Dimo parameter are given in Table 3 and Table 4.
Table 3. Y Bus of REI-Dimo Single Load Equivalent of Java Bali System
Table 4. REI-Dimo Parameter
No Bus Y re G (pu) Y im B (pu) REI MW REI MVAr V (pu) V ang(0) the value of SSSL of Java-Bali system using REI-Dimo.
1 1.1 1.2 1.3 1.4 1.5 1.6 1.7 1.8
PV Curve - Steady State Stability Margin of 500 kV Java-Bali System
P Load Center (MW)
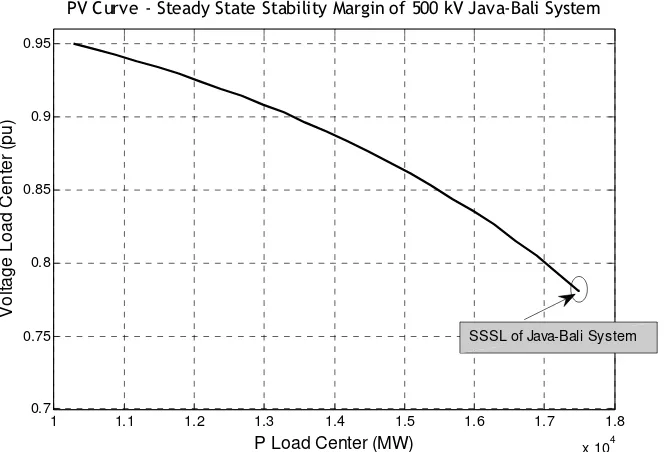
Figure 7. SSSL of Java-Bali System
3.2 Steady-state Stability Using ANN for Java-Bali power system
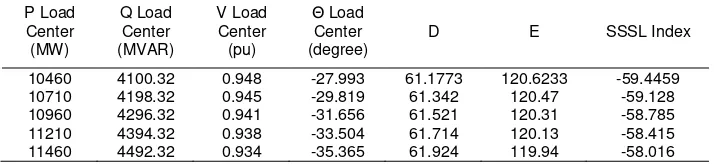
Table 5. A few data that obtained from REI-Dimo
P1 Q1 V1 Θ1 . . . P Load Q Load V Load ΘLoad D E SSSL
Index
1657.62 898.594 1.02 0 . . . 10282 4032 0.95 -26.7 61.07 120.7 -59.657
1905.77 969.249 1.02 0 . . . 10582 4148.14 0.946 -28.88 61.26 120.6 -59.294
2149.54 1046 1.02 0 . . . 10882 4265.74 0.942 -31.08 61.46 120.4 -58.895
2388.82 1128.7 1.02 0 . . . 11182 4383.34 0.938 -33.3 61.69 120.1 -58.458
2623.35 1217.23 1.02 0 . . . 11482 4500.94 0.934 -35.53 61.94 119.9 -57.98
2852.83 1311.47 1.02 0 . . . 11782 4618.54 0.929 -37.78 62.22 119.7 -57.456
3076.92 1411.29 1.02 0 . . . 12082 4736.14 0.924 -40.05 62.53 119.4 -56.883
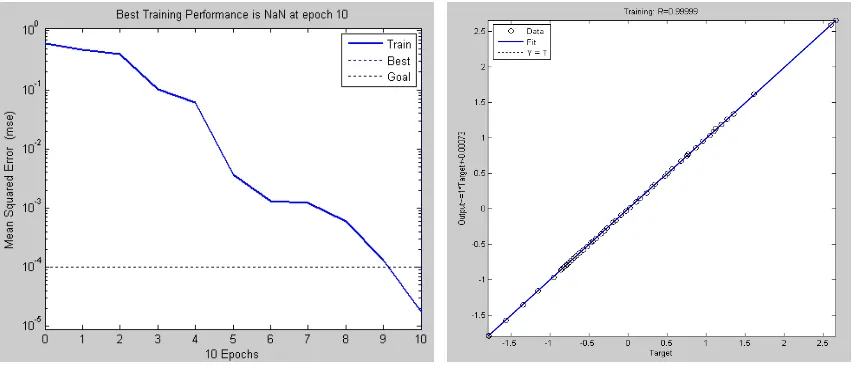
Using REI-Dimo method, maximum voltage obtained in the load center (V load(max)) area is 0.781 (pu) and the SSSL is -1.2376. All data obtained from REI-Dimo will be trained to ANN. Training process in NN needs epoch is 10, and obtained (V load(max)) is 0.7807 (pu) and SSSL is 1.3111.
Figure 8. Training Performance Figure 9. Regression Plot
To illustrate the effectiveness of the proposed ANN steady stability limit, the Java-Bali power system, shown in Figure 8 dan Figure 9, is considered. ln addition to training, validating and testing errors, another post-training analysis denoted as a regression analysis has been performed, relating SSSANN response to the actual values to investigate the performance of the trained SSSANN. For this purpose, linear regression between SSSANN outputs and exact values is used to determine the accuracy of SSSANN. ln table 6 , the outputs of SSSANN are compare with the exact values that, while its Vload(max) errors and SSSL errors are about 0.00038 and 0.05 respectively which are indicating good performance of SSSANN. Figure 10 and 11 show the estimated SSSL by SSSANN compared to the exact value of REI-Dimo method.
After training and testing SSSANN, it is used in the working mode of the proposed algorithm as shown in Table 7. In this mode, for any given operating point of power system by parameter measurement of bus voltages, voltage magnitudes and phase angles are extracted as input data to estimate SSSL by SSSANN.
.
Figure 10.Comparation P vs Stability Index between REI-Dimo and ANN
1 1.1 1.2 1.3 1.4 1.5 1.6 1.7 1.8
Figure 11. The Comparation P vs Stability Index between REI-Dimo and ANN
Table 6. The Comparison of REI-Dimo and ANN Result
No Output REI-Dimo ANN Method Error
1. VLoad(max) 0.781 0.7807 0.00038
2. SSSL -1.2376 -1.2265 0.00897
Table 7. A few of Data Testing from REI-Dimo
Table 8. The Comparison of Data Testing and Target for Index SSSL
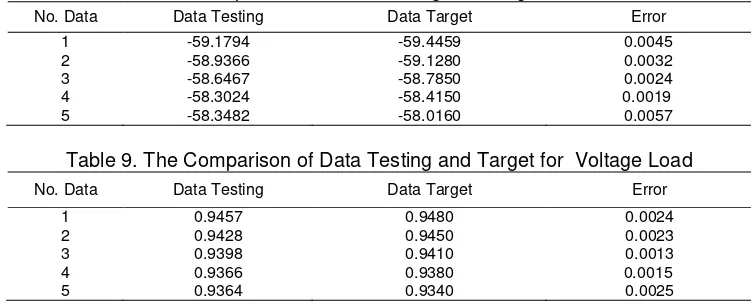
Table9. The Comparison of Data Testing and Target for Voltage Load
No. Data Data Testing Data Target Error
The estimated results obtained from ANN showed that this technique is able to predict the steady-state stability limit with a reasonable degree of accuracy. Since ANNs had high computation rates, parallel distributed processing, fault tolerance, and adaptive capability, they were excellent alternatives for real-time application combined with REI-Dimo method. The result showed that REI-Dimo and ANN had overall error in the output values was less than 0.5% which would be acceptable and it meant that the SSSANN method had strong potential for steady-state stability assessment. And by considering the training time and accuracy of the networks, it could be safely concluded that SSSANN was well-suited for online steady-state stability assessment of power systems.
Acknowledgments
The authors acknowledge the financial assistance granted by the Direktorat Jenderal Pendidikan Tinggi (DIKTI) – Hibah Guru Besar in support of this research project.
References
[1] Savu C.Savulescu. Real-Time Stability Assessment in Modern Power System Control Center. IEEE Press. Wiley. 2009
[2] Cornel Aldea, Savu C.Savulescu. Evaluation Of The Stability Reserve Of Transelectrica’s Transmission System By Using Quickstab Professional. National Conference of Energy CNE. 2004 [3] Ching-Yin Lee, ShaoHong Tsai, Yuan-Kang Wu. A New Approach to The Assessment os
Steady-State Voltage Stability Margin Using P-Q-V Curve. Electrical Power and Energy System. 2010 [4] Yang Wang, Wenyuan Li, Jiping Lu. A New Node Voltage Stability Index Based on Local Phasors.
Electrical Power and Energy System. 2009; 79; 265-271
[5] M.Moghavveni, M.O. Faruque. Power Systm Security and Voltage Collapse: A Line Outage Based Indicator for Prediction. Electrical Power and Energy System. 1999; 21; 455-461
[6] Hiendro A. A Quantities Method of Induction Motor Under Unbalanced Voltage Conditions. TELKOMNIKA Indonesian Journal of Electrical Engineering. 2010; 8(2): 73-80.
[7] Tumiran, Nandar CSA.Power Oscillation Damping Control using Robust Coordinated Smart Devices. TELKOMNIKA Indonesian Journal of Electrical Engineering. 2011; 9(1): 65-72.
[8] M.H. Haque. A Fast Method for Determining The Voltage Stability Limit of a Power System. Electrical Power and Energy System. 1995; 32; 35-43
[9] Savu C. Savulescu. Solving Open Access Transmission And Security Analysis Problem with The Short-Circuit Current Method. Latin America Power Conference, Mexico. 2002. Page: 1-5
[10] B.Jeyasurya. Artificial Neural Network fo Power System Steady-State Voltage Instability Evaluation. Electrical Power and Energy System. 2010, 29: 85-90
[11] Anna Larsson, Alain Germond, Boming Zhang. Application of Neural Networks to the Identification of Steady-state Equivalents of External Power Systems. International Conference On Power System Technology,Chongqing October 2006
[12]. Ferdinando H, Pasila F, Kuswanto H. Enhanced Neuro-Fuzzy Architecture for Electrical Load Forecasting. TELKOMNIKA Indonesian Journal of Electrical Engineering. 2010; 8(2): 87-96.
[14]. Gupta M, Kumar R, Gupta RA. Neural Network Based Indexing and Recognition of Power Quality Disturbances. TELKOMNIKA Indonesian Journal of Electrical Engineering. 2011; 9(2): 227-236. [15] Savu C. Savulescu. Equivalent for Security Analysis of Power System. IEEE Transactions on Power