DOI: 10.12928/TELKOMNIKA.v13i3.1733 820
Simple, Easy-use and Low-cost Software for Design of
Single and Cascaded Microring Resonators Using
Semi-numerical Method
Budi Mulyanti1*, Lilik Hasanah2, Tommi Hariyadi1, Arjuni B Pantjawati1, Heru Yuwono3, P. Susthita Menon4, Sahbudin Shaari4
1
Department of Electrical Engineering Education
2
Department of Physics Education, Universitas Pendidikan Indonesia (UPI), Jalan Dr. Setiabudhi 207, Bandung 40154, Indonesia, Telp/fax: 022 2013163/022 2011576
3
Arsari Group, Jalan Jend. Sudirman, Kav 10-11, Jakarta Selatan, Indonesia
4
Institute of Microengineering and Nanoelectronics (IMEN), Universiti Kebangsaan Malaysia (UKM), 43600 UKM Bangi, Selangor, Malaysia
*Corresponding author, e-mail: [email protected]
Abstract
Development of a simple, easy and low-cost software for designing of waveguide-coupled single and cascaded microring resonator (MRRs) using semi-numerical calculation based on transfer matrix method (TMM), is presented in this paper. The software uses a device model which is embedded on the high index contrast (HIC) structure of silicon-on-insulator (SOI) with monomodal cavity for TE-mode polarizations, operating around 1550 nm optical wavelength. The main aim of the software is to estimate the microring resonator performance parameters, such as free spectral range (FSR) and quality factor (Q-factor). The software is very simple and easy to use. With a standard laptop computer, it only takes few seconds to obtain transmission response, FSR and Q-factor of single MRR for varied waveguides separation distance and ring radius. The results were then verified using simulation method based on finite integration technique using 3D electromagnetic simulator, which need a high memory and processor of computer and take days to execute the simulation. We found only small discrepancy, which in averages are about 4.25% and 10.80% for FSR and Q-factor, respectively. In general, the results obtained from this software are closer to 3D electromagnetic simulation results.
Keywords: microring, semi-numerical method, matrix transfer, free spectral range, quality factor
Copyright © 2015 Universitas Ahmad Dahlan. All rights reserved.
1. Introduction
Microring resonators (MRRs) is a very important device that is being developed nowadays because of their ability to support the creation of high density integrated circuits. Various applications of MRRs have been developed, such as wavelength filter [1], multiplexing [2], sensors [3], modulation wave, [4] and biomedical [5] applications. For sensing application, there are many types of sensor that have been developed such as for Wireless Sensor Network (WSN) application [6, 7]. MRRs has several advantages that of interest to many researchers in this field, that are (1) its smaller and compact size, (2) can be integrated with other components (light source, detector, coupler, and many others), and (3) very easy to mass produced [8].
For designing single and cascaded MRRs as well as other MRRs configurations, several numerical methods have been developed, such as transfer matrix method (TMM) [9], finite-difference time-domain (FDTD) [10], conformal transformation method [11] or modeling in terms of semi-analytic coupled-mode theory (CMT) [12-15], with each method has its advantages and disadvantages. The CMT in space and time domains is implemented usually in two space dimensions (2D) and rarely in 3D [16]. The FDTD method is the most popular simulation tool for that purpose, but due to its inherent weaknesses (stair casing error and numerical dispersion), other solutions are looked for. The 3D FDTD analysis of an add-drop filter configuration, described in the study of Fujii et al. [17], illustrates high requirements in terms of computer resources.
semi-numerical method, namely the transfer matrix method (TMM) to estimate the values of MRRs’ properties, namely FSR and the Q-factor. The results are then verified by a FDTD’s most popular commercial software CST Microwave Studio, using 3D electromagnetic simulator based on finite integration technique, which needs a high memory and processor of computer and takes days to execute the simulation.
2. Research Method 2.1. Device Model
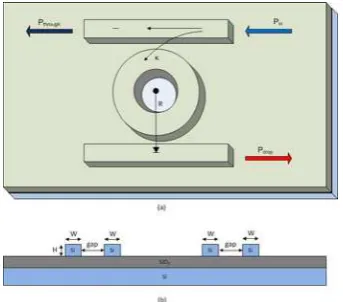
MRRs device model used in this study, was based on SOI structure with high refractive index contrast and operating at 1550 nm of wavelength as schematically shown in Figure 1 which comprises of a ring waveguide closely coupled to double straight bus waveguides (Figure 1(a)) and the cross section of the waveguide structure is shown in Figure 1(b). The bus waveguides serve as evanescent light input and output couplers, while the ring waveguide acts as the wavelength selective element. R depicts the ring radius, gap is the separation distance between straight and ring waveguide, W is the waveguide width and H is the total waveguide height. The fully etched waveguide structure is considered throughout this study. The cross-section of the MRRs device is 0.30 m x 0.55 m, on top of 1 m-thick buried oxide (BOX) layer. The cross-section of such waveguides was chosen to ensure single-mode propagation near 1550nm telecommunications wavelengths [20].
Figure 1.(a) Lay out and (b) cross section of single MRR with double straight waveguides
2.2. Calcution of MRR characteristics using CMT and TMM Effective refractrive index, , can be derived using [19]:
(1)
Figure 2. Coupling effect between the straight waveguide and the ring with radius R
In Figure 2, it can be seen that the coupling length, , between the straight and ring waveguides, in which the input signal of straight wavelength is coupled with the ring wavelength. The amount of coupling is determined by the magnitude of the coupling coefficient, k. Therefore, the coupling length, , can be calculated using [21]:
(2)
Where is operating wavelength, and are effective refractive index for even and odd wavelength, respectively. And by using:
(3)
The value of coupling coefficient, , can be calculated.
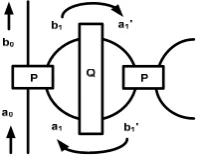
Figure 3. MRRs configuration and represented coupling matrix P and Q
MRRs configuration can be formed by one or two straight waveguides and one or more than one ring waveguides. The input signal enters one end of a straight waveguide and goes forth at the other end. During its travel in a straight waveguide, most signal will be coupled and towards the ring waveguide. If there is more than one ring, the signal will be coupled again towards the next ring, or it could be coupled towards another straight waveguide. In Figure 3, P is assumed to be a coupling matrix between the straight and ring waveguides or a coupling matrix between the two ring waveguides, while Q is a coupling matrix of signal propagation along the waveguide ring, then the transfer equation for MRR can be expressed in the following equation [19]:
′
∗ ∗
′
, | | | | (4)
Where is a normalized coupling coefficient and t is signal transmitted in the ring waveguide. Furthermore, the coupling matrix can be obtained using [19]:
′
⁄ (7)
Where L is a circumference of microring circle and c is speed of light in a medium that can be expressed as:
(8)
Where is speed of light in the vacuum.
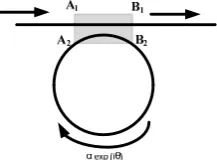
Based on Figure 4 and by using boundary condition of [19]:
∝ (9)
Where α is absorption coefficient per unit length, accordingly the transmitance in the straight waveguide is [19]:
| | | |
| | | | (10)
Figure 4. Light wave transmitted in the straight waveguide
And the total power in the microring is [19]:
| | | |α | || | (11)
If ⁄ , then from equation (10), full width at half maximum (FWHM) can be obtained from:
∆ ≅ | | ; | | (12)
And the Q-factor can be expressed as:
∆ | | | | (13)
3. Results and Discussion
MRR devices, was resulted in this study. The GUI page of the software can be seen in Figure 5. All of the design parameters, such as ring radius, gap, width of waveguide, refractive indexes can be easily incorporated into the GUI preceded by choosing the MRR configuration. The results of the simulation, namely frequency response, FSR, the Q-factor, finesse, and FWHM will be soon shown in the GUI page.
Figure 5. The GUI page of software resulted in this study.
3.1. Single MRR
The simulations were done by varying ring radius and waveguide separation distance of 4-12 µm and 100-150 nm, respectively at incident wavelength of 1.55 µm. The other parameters are kept constant, including SiO2 and Si refractive index of 1.5277 and 3.4777, respectively, SiO2 and Si height of 1.0 and 0.55 µm, respectively and the waveguide width of 0.30 µm. The results were then verified by results of simulation using simulation method based on finite integration technique using 3D electromagnetic simulator, which needs a high memory and processor of computer and takes days to execute the simulation. The frequency performance for single microring for different values of ring radius and 100 nm of waveguide separation distance, is shown in Figure 6.
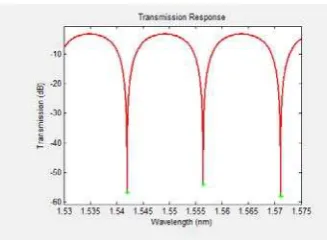
Figure 6. Single MRR transmission respone of the drop port for different values of ring radius, R = 6 and 10 µm at waveguide separation distance, waveguide width, and waveguide height are
100nm, 0.30 µm and 0.55 µm, respectively
between two adjacent resonant peaks.
From our TMM simulation and CST simulation, the highest FSR obtained at the smallest ring radius, therefore the value of FSR is inversely proportional to the effective length microring, L (= 2πR). On the average, the difference between semi-numerical simulations with and CST simulations is 4.25%, as shown in Figure 7. We may conclude that only small discrepancy between both simulations.
Figure 7. FRS values of Single MRR for different valus of ring radius
3.2. Double and Triple Serially Cascaded MRR
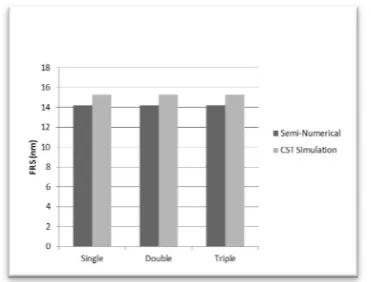
The analysis was also done with double and triple serially cascaded microring for the same values of separation distance and ring radius, i.e: 0.1 µm and 6 µm, respectively. The device performance of the double and triple cascaded microrings are simulated and compared to a single microring and the results are interpreted in Figure 8. Two resonant peaks occur at 1.5520 and 1.5663 giving FSR equal to 14.5 nm regardless the number of microrings order. To verify the results, we confirmed the simulations results with CST simulation.
Figure 8. The FSR values for different for the single, double and triple cascaded microrings at ring radius and separation distance of 6 µm and 100 nm respectively.
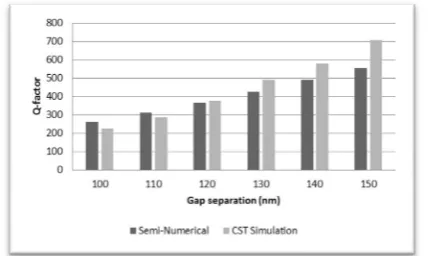
Figure 9. The plots of Q-factor to separation distance in the range of 0.1 m and 0.15 m at constant ring radius of 6 m of semi-numerical and CST simulations.
It is shown that greater Q-factor occurs at larger separation distance. The observable Q-factor difference in the separation distance of 0.1 m and 0.15 m is 375 and 610, respectively. Clearly, the gap size has a significant effect on the Q-factor, yet the FSR unaffected. Despite the low loss produced at the narrow gap, it is difficult to fabricate and fine etching is required. Furthermore, we found a mismatch in the Q-factor values for both simulations. The largest difference was found for the gap size of 120 nm with 20.5% difference. This again due to different in effective refractive index values where there is no straightforward way of calculating the effective refractive index, especially in bend waveguide. Thereby, approximations are considered in the MRR modeling. However, both results experienced the same trend, which the Q-factor raised as the separation gaps widens. The observable Q-factor difference across the separation gap of 0.12 m is 10, which contribute to 2.6% in percentage, while the average of deviation is 10.80%, which can be considered relatively low.
4. Conclusion
The simple, easy-use and low-cost software for design of single and serial cascaded microring resonators (MRRs) using the semi-numerical method has been developed in this study. The software can be used to estimate the MRRs performance parameters, such as FSR and Q-factor in only few seconds using a standard laptop computer. The results of the simulation were then verified using simulation method based on finite integration technique using 3D electromagnetic simulator. In general, we found only small discrepancy, which in averages are about 4.25% and 10.80% for FSR and Q-factor, respectively.
References
[1] Kazmierczak A, Boaerts W, Thourhout DV, Drouard E, Rojo-Romeo P, Giannone D, Gaffiot F.
Analysis of Silicon on Insulator (SOI) Optical Microring Add-Drop Filter Based on Waveguide Intersection. Proceedings of SPIE. Strasbourg. 2008; 6996.
[2] Paloczi GT, Huang Y, Yariv A. Free-standing all Polymer Microring Resonator Optical Filter.
Electronics Letter. 2003; 39(23): 1650-1665.
[3] Xiao S, Khan SM, Shen H, Qi M. Multiple-channel silicon micro-resonator based filters for WDM applications. Optics Express. 2007; 15(12): 7489-7498.
[4] Chao CY, Guo LJ. Design and Optimization of Microring Resonators in Biochemical Sensing Applications. Journal of Lightwave Technology. 2006; 24(3): 1395-1402.
[5] Chao CY, Fung W, Guo LJ. Polymer Microring Resonators for Biochemical Sensing Applications.
IEEE Journal of Selected Topics in Quantum Electronics. 2006; 12(1): 134-142
[6] Hariyawan MY, Gunawan A, Putra EH. Wireless Sensor Network for Forest Fire Detection.
TELKOMNIKA Indonesian Journal of Electrical Engineering. 2013; 11(3): 563-574.
[7] Haseeb K, Abu Bakar K, Abdullah AH, Ahmed A. Grid Based Cluster Head Selection Mechanism for
Wireless sensor network. TELKOMNIKA Telecommunication Computing Electronics and Control.
2015; 13(1): 269-276.
[13] Bogaerts W, De Heyn P, Van Vaerenbergh T, DeVos K, Selvaraja SK, Claes T, Dumon T, Bienstman P, Van Thourhout D, Baets R. Silicon microring resonators. Laser Photonics Rev. 2012; 6: 47-73. [14] Benson T, Boriskina S, Sewell P, Vukovic A, Greedy S, Nosich A. Micro-Optical Resonators for
Microlasers and Intergrated Optoelectronics-Recent Advances and Future Challenges. In Frontiers of Planar Lightwave Circuit Technology: Design, Simulation and Fabrication. Springer, London. 2005: 39-70.
[15] Hiremath K, Hammer M. Circular Integrated Optical Microresonators-Analytical Methods and
Computational Aspects. In Photonic Microresonator Research and Applications. Springer Series in Optical Sciences. Springer Verlag, London. 2010; 156: 29-59.
[16] Stoffer R, Hiremath KR, Hammer M, Prkna L, Ctyrok J. Cylindrical integrated optical microresonators - modeling by 3-D vectorial coupled mode theory. Opt. Commun. 2005; 256: 46-67.
[17] Fujii M, Freude W, Russer P. Efficient High-Spatial-Order FDTD Analysis of 3D Optical Ring
Resonator Filters. In Proc. 19th Annual Rev. Progress in Appl. Comput. Electromagnetics. Montrey, CA. 2003: 739-744.
[18] Masi M. Modeling of Sequences of Silicon Micro-Resonators for On-Chip Optical Routing and Switching. PhD Thesis. Trento: Univ of Trento. 2011.
[19] Yariv A. Coupled-Mode Theory for Guided-Wave Optics. IEEE Journal of Quantum Electron. 1973; 9: 919-933.
[20] Mulyanti B, Hariyadi T, Hasanah L, Hazura H, Sahbudin S, Menon PS, Abang AE, Mahmudin D, Wiranto G. Design and Optimization of Coupled Microring Resonators (MRRs) in Silicon-on-Insulator.
Journal Sains Malaysiana. 2014; 43(2): 247-252
[21] Paloczi GT, Huang Y, Yariv A, Mookherjea S. Polymeric Mach-ZehnderInterferometer Using Serially Coupled Microring Resonators. Optics Express. 2003; 11(21): 2666-2671.
[22] Mookherjea S. Optical Devices for Computing: Modeling Photonic Circuits. Lecture. San Diego: University of California. 2012.