ContentslistsavailableatSciVerseScienceDirect
Ecological
Modelling
j ou rna l h o m e pa ge :w w w . e l s e v i e r . c o m / l o c a t e / e c o l m o d e l
Variance-based
sensitivity
analysis
of
a
forest
growth
model
Xiaodong
Song
a,b,∗, Brett
A.
Bryan
b, Keryn
I.
Paul
c, Gang
Zhao
b,d aInstituteofUrbanEnvironment,ChineseAcademyofSciences,Xiamen361021,ChinabCSIROEcosystemSciences,WaiteCampus,Urrbrae,SA5064,Australia cCSIROEcosystemSciences,BlackMountain,Canberra2601,Australia
dInstituteofGeographicSciencesandNaturalResourcesResearch,ChineseAcademyofSciences,Beijing100101,China
a
r
t
i
c
l
e
i
n
f
o
Articlehistory: Received31May2012
Receivedinrevisedform21July2012 Accepted7August2012
Keywords: 3-PG2
Sensitivityanalysis Variance-based Elementaryeffects Groupeffect
a
b
s
t
r
a
c
t
Computermodelsareincreasinglyusedtosimulateandpredictthebehaviourofforestsystems. Uncer-taintiesinbothparametercalibrationandoutputsco-existinthesemodelsduetoboththeincomplete understandingofthesystemundersimulation,andbiasedmodelstructure.Weusedsensitivityanalysis, includingbothscreeningandglobalvariance-basedmethods,toexploretheseuncertainties.Weapplied thesetechniquestothewidelyusedforestgrowthmodelPhysiologicalPrinciplesforPredictingGrowth (3-PG2)usingfielddatafrom141plotsofCorymbiamaculataandEucalyptuscladocalyxinAustralia.The screeningmethodwasusedtoselectinfluentialinputparametersforthesubsequentvariance-based analysisandtherebyreduceitscomputationalcost.Weassessedmodeloutputsincludingbiomass parti-tioningandwaterbalance,andthesensitivitiesofthesoiltexturegroup,whichincludes7parameters.We alsocomparedthescreeningandvariance-basedmethods,andassessedtheconvergenceofthe variance-basedmethod,andthechangeinsensitivitiesovertime.Usingthesetechniques,wequantifiedtherelative sensitivitiesofeachmodeloutputtoeachinputparameter.Thevariance-basedmethodexhibitedgood convergenceandstablesensitivityrankings.Theresultsindicatedchangesininputparameter sensitiv-itiesoverlongersimulationperiods.Thevariance-basedglobalsensitivityanalysiscanbeveryeffective incalibrationandidentificationofimportantprocesseswithinforestmodels.
© 2012 Elsevier B.V. All rights reserved.
1. Introduction
Computermodelsareroutinelyusedtounderstandforest sys-tems(Battagliaetal.,2004;LandsbergandWaring,1997;Panetal., 2011;Whiteetal.,2000).Thisisinpartduetotheirabilityto incor-poratehighlevelsofcomplexitythat arecharacteristicof these systems.Althoughacomputermodelcanbeseenasseriesof math-ematicfunctionsthatconnectcertaininputsandoutputs,theyare oftencomplex,andthispresentsabarriertothequantitative anal-ysisofmodelperformance(Morris,1991).Anotherconsequence ofcomplexmodelsis thattheuncertaintiesin modelstructure, estimatesofthemodelparameters,andtheunexplainedrandom variationinobservedvariablesallincreasegreatly(Chatfield,1995). Formodelparameterswithhighuncertaintyandhighsensitivity, asmallperturbationinparametervaluesmayhaveexaggerated effectsontheoutputs(Makler-Picketal.,2011;XuandGertner, 2007).Thus,understandingthecontributionofmodelstructureand parameterestimationtothetotalmodeluncertaintyisimportant inbothmodelapplicationanddevelopment(Caribonietal.,2007;
∗Correspondingauthorat:InstituteofUrbanEnvironment,ChineseAcademyof
Sciences,Xiamen361021,China.Tel.:+865926190663;fax:+865926190977. E-mailaddress:[email protected](X.Song).
Makler-Picketal.,2011;SaltelliandAnnoni,2010;Saltellietal., 2008).
Toquantifytheeffectofdifferentsourcesofuncertaintyinforest modelinputsonvariabilityofmodeloutputs,sensitivityanalysis (SA)canbeapplied(Saltellietal.,2008).SAevaluatestherelative importanceofeachinputparameterandcanbeusedtoidentify themostinfluentialparametersindeterminingthevariabilityof modeloutputs.Uninfluentialparameterscanalsobeidentifiedand besafelysetinrelativelywideranges(Caribonietal.,2007).In general,SAmethodscanbecategorizedaseitherlocalorglobal. LocalSAisusuallyderivative-basedandbelongstotheclassof “one-factor-at-a-time”(OAT).OATmethodsinvolvechangingoneinput parameteratatimewhilstholdingallothersattheircentralvalues andvariationintheoutputsismeasured.AcritiqueofOATmethods is thattheyareonlyinformativeatthecentralpointwherethe calculationisexecutedanddonotcoverthewholeinputparameter space.Thus,localSAmethodsareinadequateforanalysingcomplex biophysicalprocessmodelswhichmayhavemanyparameters,and maybehigh-dimensionaland/ornon-linear(SaltelliandAnnoni, 2010;Yang,2011).Amodel-independentglobalSAtechniqueis preferableforthesemodels(Heltonetal.,2006;Nossentetal.,2011; Saltelli,2000;SaltelliandAnnoni,2010).
ComparedwithlocalSA,globalSAexploresthefullinput param-eterspace,andthecontributionofeachinputparametertothe
Table1
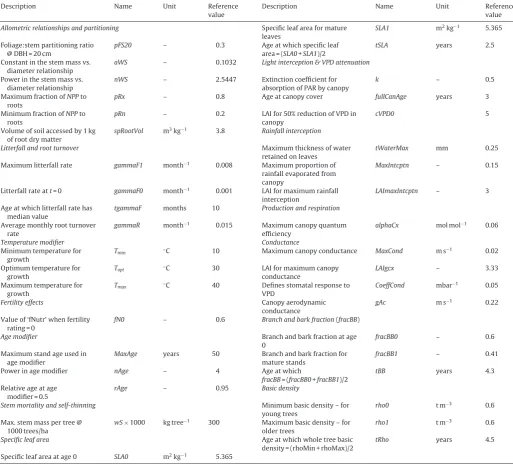
Inputparametersof3-PG2,includingdescription,classificationandvaluesforC.maculata/E.cladocalyx,subjectedtothesensitivityanalysis.
Description Name Unit Reference
value
Description Name Unit Reference
value
Allometricrelationshipsandpartitioning Specificleafareaformature
leaves
SLA1 m2kg−1 5.365
Foliage:stempartitioningratio @DBH=20cm
pFS20 – 0.3 Ageatwhichspecificleaf
area=(SLA0+SLA1)/2
tSLA years 2.5
Constantinthestemmassvs. diameterrelationship
aWS – 0.1032 Lightinterception&VPDattenuation
Powerinthestemmassvs. diameterrelationship
nWS – 2.5447 Extinctioncoefficientfor
absorptionofPARbycanopy
k – 0.5
MaximumfractionofNPPto roots
pRx – 0.8 Ageatcanopycover fullCanAge years 3
MinimumfractionofNPPto roots
pRn – 0.2 LAIfor50%reductionofVPDin
canopy
cVPD0 5
Volumeofsoilaccessedby1kg ofrootdrymatter
spRootVol m3kg−1 3.8 Rainfallinterception
Litterfallandrootturnover Maximumthicknessofwater
retainedonleaves
tWaterMax mm 0.25
Maximumlitterfallrate gammaF1 month−1 0.008 Maximumproportionof
rainfallevaporatedfrom canopy
MaxIntcptn – 0.15
Litterfallrateatt=0 gammaF0 month−1 0.001 LAIformaximumrainfall interception
LAImaxIntcptn – 3
Ageatwhichlitterfallratehas medianvalue
tgammaF months 10 Productionandrespiration
Averagemonthlyrootturnover rate
gammaR month−1 0.015 Maximumcanopyquantum
efficiency
alphaCx molmol−1 0.06
Temperaturemodifier Conductance
Minimumtemperaturefor growth
Tmin ◦C 10 Maximumcanopyconductance MaxCond ms−1 0.02
Optimumtemperaturefor growth
Topt ◦C 30 LAIformaximumcanopy
conductance
LAIgcx – 3.33
Maximumtemperaturefor growth
Tmax ◦C 40 Definesstomatalresponseto
VPD
CoeffCond mbar−1 0.05
Fertilityeffects Canopyaerodynamic
conductance
gAc ms−1 0.22
Valueof‘fNutr’whenfertility rating=0
fN0 – 0.6 Branchandbarkfraction(fracBB)
Agemodifier Branchandbarkfractionatage
0
fracBB0 – 0.6
Maximumstandageusedin agemodifier
MaxAge years 50 Branchandbarkfractionfor
maturestands
fracBB1 – 0.41
Powerinagemodifier nAge – 4 Ageatwhich
fracBB=(fracBB0+fracBB1)/2
tBB years 4.3
Relativeageatage modifier=0.5
rAge – 0.95 Basicdensity
Stemmortalityandself-thinning Minimumbasicdensity–for
youngtrees
rho0 tm−3 0.6
Max.stemmasspertree@ 1000trees/ha
wS×1000 kgtree−1 300 Maximumbasicdensity–for oldertrees
rho1 tm−3 0.6
Specificleafarea Ageatwhichwholetreebasic
density=(rhoMin+rhoMax)/2
tRho years 4.5
Specificleafareaatage0 SLA0 m2kg−1 5.365
variation in outputs is averaged over thevariation of allinput parameters,i.e.allinputparametersarechangedtogether(Saltelli etal.,1999).Themostpopularvariance-basedmethods include theFourieramplitudesensitivityanalysistest(FAST)(Cukieretal., 1973;Xuand Gertner,2007),theSobol’ method(Sobol’, 1990), andSaltelli’smethod(Saltellietal.,2010).Inthisstudy,weused Saltelli’smethodwhichhasbeendemonstratedtobeeffectivein identifyingboththemainsensitivityeffects(first-ordereffects)(the contributiontothevarianceofthemodeloutputbyeachinput)and thetotalsensitivityeffects(thefirst-ordereffectplusinteractions withotherinputs)ofinputparameters.However,asit relieson MonteCarlosimulationtosampleovertheentireparameterspace, amajorbarriertotheuseofthismethodisitshighcomputational cost(Nossentetal., 2011;Saltelli etal.,2010).Fortunately,the increasingavailabilityofhigh-performancecomputingresources hasreducedthisbarrier(Bryan,2012).
GlobalSAmethodscanhelptoidentifyinfluentialmodel param-eters and processes which constitute the major portionof the
[image:2.595.37.551.99.565.2]toseverallocalsensitivitystudies(Almeidaetal.,2007;Espreyetal., 2004;SandsandLandsberg,2002).Duetothehighcomputational requirementofthevariance-basedSAforparameter-richmodels, weuseda 2-stageevaluationstrategy(CampolongoandSaltelli, 1997).First,alow-costscreeningmethod—elementaryeffects(EE) (Campolongoetal.,2007;Morris,1991)—wasusedtoscreenout theleastimportantparameters.AsanextensionoftheEEmethod, weanalysedthesensitivitiesofagroupofsoil-relatedparameters tomodeloutputs(Campolongoetal.,2007;Saltellietal.,2008). Wethen usedthevariance-basedmethodtocalculatethe first-orderandtotalsensitivitiesofthemostinfluentialinputparameters onthemajormodeloutputs(Saltellietal.,2010).Toevaluatethe distributionsofthesensitivitymetrics,abootstraptechniquewas applied(EfronandTibshirani,1993).Wealsoassessedthe conver-genceinsensitivitiesasthemodelwasrunoveralongersimulation period.TheadvantagesofglobalSAforunderstandingforestmodel structureandsensitivitiesarediscussed.
2. Materialsandmethods
2.1. Overviewofthe3-PG2model
The3-PG2modelsimulatesthegrowthofeven-aged,relatively homogeneous forests or plantations through the simplification of well-establishedand richlyparameterized physiological pro-cesses. The model has been calibrated for a few specific tree species,suchasEucalyptusspecies(Almeidaetal.,2004b,2010; Pauletal.,2007;SandsandLandsberg,2002),loblollypine(Pinus taedaL.)(Landsbergetal.,2001)andDouglas-Fir(Pseudotsuga men-ziesii (Mirb.)Franco) (Coopset al., 2010). Thismodel has been widelyusedtoquantifyforeststandgrowthforarangeof appli-cationsincluding assessing land usetrade-offs betweencarbon bio-sequestrationandbiodiversityconservation(Crossmanetal., 2011),agricultural production (Paterson and Bryan, 2012) and bioenergy(Bryanetal.,2008,2010).
2.1.1. Structure
The3-PG2modelestimatesbothbiomassproductionand par-titioningbetweenvariouscomponentsoftrees(Coopsetal.,1998; Landsbergetal.,2003).Biomassproductionisdrivenbythe radi-ationinterceptedbythecanopyandcanopyphotosynthesis.The gross primary production (GPP) is determined by the canopy quantumefficiency(QE)andabsorbedphotosyntheticallyactive radiation(APAR).QEis,inturn,determinedbycanopyconductance, air temperature, frost, vapour pressure deficit (VPD), available soilwater,soilnutritionalstatusandstandage.Aconstantratio betweennet primary production (NPP)and GPPis assumed so thatthecalculationofrespirationisnotnecessary(Landsbergand Waring, 1997).TheNPP partitioning betweenroots and above-ground is determined by soil fertility rate and several growth modifiers(e.g.temperature,soil waterand age).Forthe above-groundbiomass,aseriesofallometricequationsrelatedtostem diameteratbreastheight(DBH)areappliedtodeterminecarbon allocationbetweenfoliageandstem(LandsbergandWaring,1997; Landsbergetal.,2003).
2.1.2. Inputsandoutputs
The 3-PG2 model runs in a monthly time step. The model requires climatic data specified as monthly average values for short wave solar radiation, mean maximum and minimum air temperature,VPD,frostdaysandrainfall.Othersite-specific param-etersincludelatitude,soiltexture,maximumavailablesoilwater, soil fertility rating and initial number of stems per hectare. Speciesparametervalueshaveusuallybeendeterminedbyfield observations and combined with empirical formulas. Detailed parameterizationscanbefoundinPauletal.(2008),Sandsand
Table2
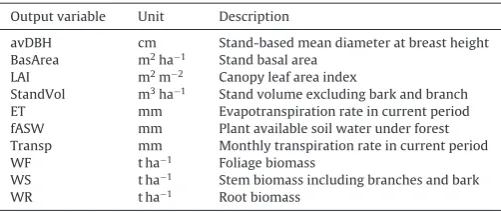
Alistofthemajor3-PG2outputvariablesusedinthesensitivityanalysis.
Outputvariable Unit Description
avDBH cm Stand-basedmeandiameteratbreastheight BasArea m2ha−1 Standbasalarea
LAI m2m−2 Canopyleafareaindex
StandVol m3ha−1 Standvolumeexcludingbarkandbranch
ET mm Evapotranspirationrateincurrentperiod
fASW mm Plantavailablesoilwaterunderforest Transp mm Monthlytranspirationrateincurrentperiod
WF tha−1 Foliagebiomass
WS tha−1 Stembiomassincludingbranchesandbark
WR tha−1 Rootbiomass
Landsberg(2002)andAlmeidaetal.(2004a).Inthisstudy,weused theinputparameterslistedinTable1.Thisselectioncovers:(1) allometricparameterswhichdeterminethebiomassallocationin differentpartsofatree(e.g.aWS,nWS,pRx,pRnandfracBB1)and parameterswhichdeterminethestandvolume(e.g.rho1);(2)leaf area,photosynthesisandwateravailabilityrelatedparameters(e.g. SLA1,k,alphaCx,MaxCond,LAIgcx,CoeffCondandtWaterMax);and (3)biomassremoval/turnoverratesinabove-groundcomponents androot(e.g.gammaF1,gammaR).
Outputscanbespecifiedasmonthlyorannual.Weanalysedthe sensitivityoftenselectedoutputvariablesfrom3-PG2(Table2)to eachoftheinputparameters(Table1).Forclaritybelow,weused normalfontforoutputvariablesanditalicsforinputparameters. Thetenselectedoutputvariablescanbeclassifiedintothree cate-gories:(1)growth/volumerelatedvariables(i.e.avDBH,BasArea, LAI and StandVol); (2) water related variables (i.e. ET, Transp, fASW);and(3)biomassallocationrelatedvariables(i.e.WF,WS, WR).
2.2. Datasourcesforsensitivityanalysis
We used growth measurements for Corymbia maculata and Eucalyptuscladocalyxplantationsfrom141sitesacrossAustraliato undertakeSAfor3-PG2.Thesetwospeciesweregroupedintoone datasetduetotheirsimilaritiesingrowthrates(Pauletal.,2008). Foreach site,standdataincludedplantingdate,initialandfinal stocking,initialavailablesoilwaterandinitialbiomass(foliage,root andstem).Additionally,sitefactorsincludinggeographiclocation, climaticdataandsoilproperties(e.g.depth,textureandfertility rating)werealsorecorded.Themonthlyaverageclimaticdata dur-ingtheplantgrowthperiodwereobtainedandsummarisedfrom dailyclimaticdata(Jeffreyetal.,2001).Forallthesitesduringthe studyperiods,themeanannualairtemperaturevariedbetween8 and25◦C,andthemeanannualrainfallvariedbetween100and
2974mm.
In3-PG2,theavailablesoilwaterisdeterminedbysoildepth andtexture.Asoilterrainanalysistechnique(MRVBF)wasused todeterminesoilprofilesdeeperthan2m.Atotalof12soil text-uralclassescanbeusedin3-PG2(Almeidaetal.,2007;Polglase etal.,2008).Foreachsoiltexture(SoilTexture)therearesevensoil attributes,which includethecriticalsoilwatercontent(i.e.soil water contentatsaturation(SWsat),fieldcapacity(SWfcap)and permanent wiltingpoint(SWwilt));thegrowthmodifyingeffect ofrelativeavailablesoilwater(cThetaandnTheta),and;kDrainand kSCondthatdefinethediffusionofwaterfromnon-rootedtorooted zoneofthesoilprofile(Almeidaetal.,2007).Soilfertilityrating (FR)isanempiricalindexbetween0and1todescribenutrient availability.
[image:3.595.313.564.97.203.2]independentuniformdistributionforeachparameterwithbounds varying30%eithersideofitsreferencevalue(Espreyetal.,2004; vanOijenetal.,2005).Someofthemorereliablyestimatedinput parameterswerekeptconstant,suchasambientCO2concentration
andtheratiobetweenNPPandGPP(Almeidaetal.,2007;Landsberg andWaring,1997).
2.3. Elementaryeffects(EE)method
TodescribetheEEmethod,let’sassumeamodelwithinputXi,
i=1,...,k,whichvariesacrosspselectedlevels.Foragivenvalue ofX,theelementaryeffectsofthei-thinputparameterisdefined asfollows:
EEi(X)=
f(x1,...,xi−1,xi+,...,xk)−f(X)
(1)
where is a predefined valuein {1/(p−1),...,1−1/(p−1)}, andX=(x1,...,xi−1,xi,...,xk)isanyrandomsampleintheinput
parameterspacewhilstthetransformedpoint (x1,...,xi−1,xi+
,...,xk)isstillintheinputparameterspace.Asampling
strat-egysuggestedbyMorris(1991)wasappliedtorandomlysample differentXfromtheinputparameterspace,witheachprovidingn elementaryeffectscorrespondingtoeachinputparameter,forming aso-calledtrajectory,r.Inpractice,anevenvalueforpispreferred and=p/2(p−1).Weadoptedaschemeofp=4,=2/3and r=10(Saltellietal.,2008).ForEEanalysiswithrtrajectoriesandk inputparameters,thetotalmodelsimulationnumberisr(k+1).
Morris(1991)proposedastatistic,torepresentthemeanof thedistributionoftheEEi.Alargervalueforrepresentsahigher
overallinfluenceofacertaininputparameterontheoutput. How-ever,formodelsthatarenon-monotonicorhaveinteractioneffects, itiscommonthatsomeelementaryeffectsmaycanceloutdueto oppositesigns,thusincreasingtheriskoffailingtoidentify impor-tantparameters (Saltelli etal.,2008).Campolongoet al.(2007) proposedarevisedversionof,termed∗,whichisthemean
oftheabsolutevalueoftheelementaryeffects,i.e.|EEi|,toaddress
theaboveproblemwithusing.
WealsoadoptedtheextensiontotheEEmethodusingthe∗
measureproposedbySaltellietal.(2008)toaddressthecasesin whichgroupsofparametersneedtobeevaluatedsoastoproduce overallsensitivityindicestoeachgroup.Thebasicideaistomoveall theparametersbelongingtothesamegroupsimultaneously.This differswiththeoriginalEEmethodinwhichonlyoneparameteris incrementedperelementaryeffectcalculation(Campolongoetal., 2007).
2.4. Variance-basedsensitivityanalysis
The variance-based global sensitivity analysis approach can beusedtoquantifythefirst-ordereffectandtotaleffect(which includestheinteractionswithotherparameters)onthevarianceof modeloutput(Nossentetal.,2011).Moreformally,givenamodel
Y=f(X),whereYisthemodeloutput,X=(X1,X2,...,Xk)isthe
inputparametervector.Avariancedecompositionoff suggested bySobol’(1990)is:
V(Y)= k
i=1
Vi+ k
i=1
k
j=i+1
Vij...+V1,...,k (2)
whereXisrescaledtoak-dimensionalunithypercube˝k,˝k= {X|0≤Xi≤1, i=1,...,k};V(Y)isthetotalunconditional
vari-ance;Viisthepartialvarianceor‘maineffect’ofXionYandgiven
byVi=V[E(Y|Xi)];VijisthejointimpactofXiandXjonthetotal
varianceminustheirfirst-ordereffects.
Here,thefirst-ordersensitivityindexSiandtotaleffect
sensi-tivityindexSTiaregivenas(Saltellietal.,2008):
Si= Vi
V(Y)=
V[E(Y|Xi)]
V(Y) (3)
STi=Si+
j=/iSij+...=
E[V(Y|X∼i)]
V(Y) (4)
whereX∼idenotesvariationonallinputparametersbutXi,Sijis
thecontributiontothetotalvariancebytheinteractionsbetween parameters.
FollowingSaltellietal.(2010),tocomputeSiandSTi,wecreated
twoindependentinputparametersamplingmatricesPandQwith dimension(N,k),whereNisthesamplesizeandkisthenumberof inputparameters.EachrowinmatrixPandQrepresentsapossible valueofX.TheMonteCarloapproximationsforV(Y),SiandSTiare
definedasfollows(Jansen,1999;Nossentetal.,2011;Saltellietal., 2010):
ˆ
f0=
1
N
Nj=1f(P)j (5)
ˆ
V(Y)= 1
N
N j=1(f(P)j)2
−fˆ02 (6)
ˆ
Si=
1
N
N j=1f(Q)j(f(PQ(i))j−f(P)j)
ˆ
V(Y) (7)
STi=
1 2N
N j=1(f(P)j−f(P(Qi))
j)
2
ˆ
V(Y) (8)
where·
··meanstheestimate; ˆf0istheestimatedvalueofthemodel
output;P(Qi)representsallcolumnsfromPexceptthei-thcolumn whichisfromQ,usingaradialsamplingscheme(Campolongoetal., 2011;SaltelliandAnnoni,2010).
Wegeneratedaquasi-randomsequencematrixofsize(N,2k), wherePandQaretheleftandrighthalfofthismatrix, respec-tively (Saltelli etal., 2010;Sobol’, 1967;Tanget al.,2007).The quasi-randomsequencehelpstodistributethesamplingpointsas uniformlyaspossibleintheparameterspaceandavoidclustering, andtoincreasetheconvergencerate.TocomputeSiandSTi
simul-taneously,aschemesuggestedbySaltelli(2002)wasusedwhich reducedthemodelrunstoN(k+2).
2.5. Convergenceandsensitivityranking
For each plantation field site, the elementary effects and variance-based SA return a single value for each input/output parametercombination.Togetthemeanvaluesofbothofthese measures,a bootstrapwithreplacementtechnique wasapplied (EfronandTibshirani,1993).Forthei-thinputparameter,the sam-ples,whichincludedtheelementaryeffectsandsensitivityindices
SiandSTi,wereresampledwithreplacement10,000times—alarge
enoughnumber toguarantee thefrequencydistributions ofthe meansofEEi,SiandSTi calculatedfromeachresampledsetwill
approachtheiractualprobabilitydistributions.Wethentookthe meansofthesethreefrequencydistributions asthe representa-tivevaluesofEEi,Siand STi,respectively.Weselectedasample
sizeof214(16,384)whichwaslargeenoughtotestthe
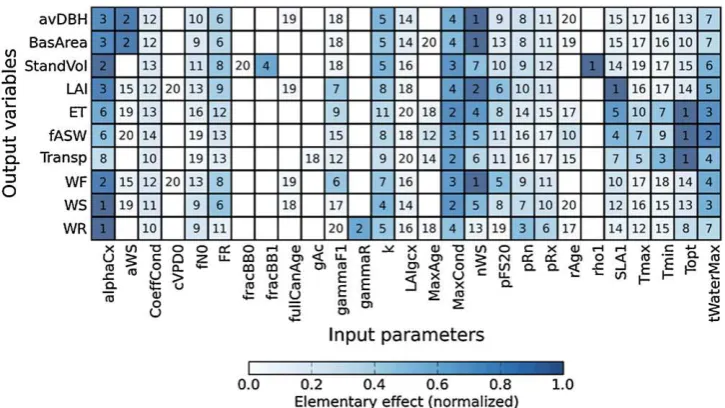
Fig.1.Elementaryeffectsof3-PG2inputparametersonoutputvariables.The20mostinfluentialinputparametersareshown.Numbersindicatetherankofelementary effects∗foreachinputparameteroneachoutputvariablefromhighest(1)tolowest(20)bydescendingorderofEEvalue.Colourshadingisusedtosymbolizeelementary effectsusingnormalizedvaluesof∗.NotethatforavDBHandBasArea,becausetheEEvaluesofnWSaremuchhigherthantheotherinputparameters,theremaininginput parameterswerenormalizedbetweentherangeof0and0.9.
2.6. Modelsimulationandcomparison
Thecurrentversionof3-PG2isaMicrosoftExcelextension writ-teninVisualBasicforApplications.Weportedthe3-PG2modelinto Python(http://python.org)forthisanalysis.TheEEmethodwasrun for400(=r(k+1))modelsimulations,wherer=10andk=39.Forthe variance-basedmethod,360,448(N(k+2))modelsimulationswere run,whereNisthesamplesizeandequals214,andkisthe
num-berofinputparametersselectedthroughEEanalysisandequals 20.WeranthesimulationsinparallelonaLinuxcomputercluster. TochecktheconsistencyofthesensitivityrankingderivedfromEE andvariance-basedmethodsforeachoutputvariable,aSpearman’s rankcorrelationmethodwasused(MyersandWell,2003).
3. Results
3.1. Elementaryeffects
Elementaryeffectsofinputparameterscorrespondingtoeach modeloutputarepresentedinFig.1.Theinfluentialparameters andtheirrankings(asmeasuredbytheelementaryeffects)forthe modeloutputsavDBHandBasArea,andforLAIandWF,werevery similar.Forthewater-relatedmodeloutputsET,fASWandTransp, theparametersTopt andtWaterMaxhadthehighestsensitivities.
Forthebiomass-relatedoutputvariableslistedinTable2,nWSwas arelativelysensitiveparameter.Muchofthevariationin biomass-relatedmodeloutputswasdeterminedbycanopyparameters(e.g. alphaCx,MaxCondandk),limitingparameterstoplantgrowth(e.g. tWaterMaxandFR),andbiomasspartitioningparameters(e.g.pRn andpRx).ForStandVol,bothrho1andfracBB1,whichdeterminethe densityandbiomasspartitioningofthestem,hadhigher sensitivi-ties.
3.2. EEmethodappliedtogroupparameters
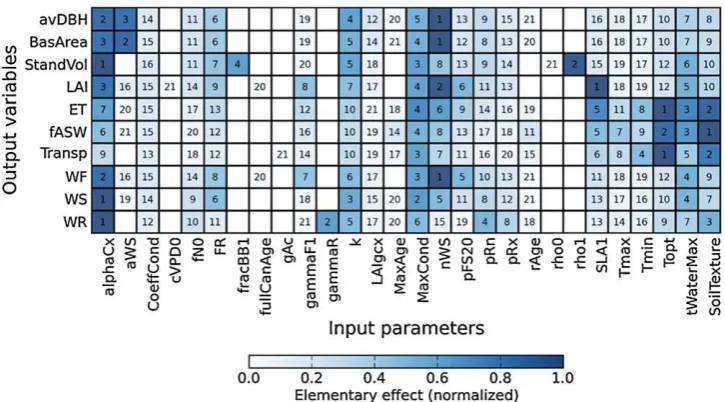
TheSoilTexturegroupparametershadastronginfluenceonthe variationsinthewaterrelatedoutputvariablesET,fASW,Transp, andonrootbiomassWR(Fig.2).EspeciallyforfASW,the SoilTex-turegroupparametershadamuchhighersensitivitythantheother
Table3
Rankingcorrelationsbetweencorrespondinginputparametersusedinelementary effectsbefore(Section3.1)andafter(Section3.2)addingsoiltextureasagroup(EE vs.EE-SoilTexture),andelementaryeffectsandvariance-basedmethods(EEvs.SA) usingSpearman’srankcorrelation.
Outputvariable EEvs.EE-SoilTexture EEvs.SA
avDBH 0.995 0.929
BasArea 0.998 0.980
StandVol 0.995 0.871
LAI 0.998 0.968
ET 0.998 0.955
fASW 0.995 0.913
Transp 0.996 0.913
WF 0.998 0.964
WS 0.998 0.902
WR 0.996 0.952
inputparameters (morethan 5times ashighasthenextmost sensitiveparameterTopt).
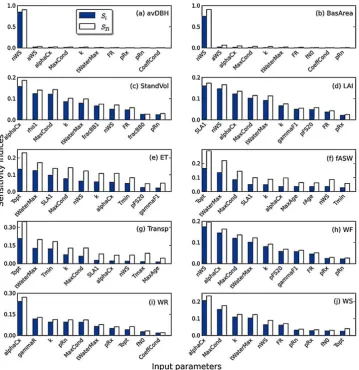
3.3. Sensitivityresultsforthevariance-basedmethod
Forthefirstfewhundredsimulations,Siexhibitedlarge
oscil-lations,butafterwhichbegantoconverge(Fig.3).MostSivalues
stabilized ataround8000–10,000simulations.STi oscillatedless
thanSiandstabilizedmorequickly.
DifferencesbetweenSiand STi,asevaluatedbythe
variance-basedmethod(Fig.4),indicatedthatinteractionsbetweenmodel parameterswerecommon.Inparticular,thetotaleffect sensitivi-tiesweresubstantiallygreaterforET,fASWandTranspthantheir first-ordersensitivities.
3.4. ComparingEEandvariance-basedsensitivities
[image:5.595.122.485.77.281.2] [image:5.595.312.565.387.490.2]Fig.2.Elementaryeffectswhilsttreatingsoiltextureparameters(seeSection2.2)asagroupfactor(SoilTexture,thelastcolumnonthefigure).ForcomparabilitywithFig.1, the20inputparameterswiththehighestEEvaluesplusSoilTextureareshown.
variance-basedmethod,forfASW,Tmin wasmore sensitivethan
Tmax,butthisisreversedundertheEEmethod.Inaddition,fASW
andTranspweremoresensitivetotheforeststandagemodifiers (e.g.MaxAge,rAge)underthevariance-basedmethodthanunderEE. farcBB0hadsomeinfluenceonStandVolunderthevariance-based methodbutnegligibleinfluenceunderEE(rankingis20).
4. Discussion
Weimplementedasystematicsensitivityanalysisfora process-basedforest model 3-PG2,using a largesetof field datafor C. maculataandE.cladocalyxbysequentiallycombiningascreening method(elementaryeffects)andaglobalvariance-basedmethod. Ourassessmentoftheconsistencyofsensitivityrankingsderived fromtheEEandvariance-basedmethods(Table3)suggestedthat theEEmethodcanestimatethesensitivityrankingsatarelatively highaccuracybutwithamuchlowercomputationalcost,although thereweresomediscrepanciesasmentionedinSection3.4. How-ever,duetoitslimitedexplorationoftheinputparameterspace,it isnotsuitablefortheaccuratemeasurementofthecontributionsof
eachinputparametertothevarianceinmodeloutputs.Anefficient androbustSAstrategycouldinvolveascreeningofthemost influ-entialparametersusingtheEEmethod.Initialscreeningshouldnot betooconservativebutrather,amoreinclusiveparameter selec-tionshouldbemadetoavoidmissingsomeimportantparameters ordetailsofthemodelstructure.Influentialparametersshouldthen beinputtothevariance-basedSA.
Ourresultsshowedcommonalitieswith,andadvanceson, pre-viouslocalSAstudieson3-PGand3-PG2(Almeidaetal.,2004a, 2007;Espreyetal.,2004).ThesestudiesconductedlocalSAsfor speciesincludingEucalyptusgrandis,PinusradiataandEucalyptus globulusforstandagesfromlessthan10yearstoover30years. Consistentwithourresults,thesestudiesidentifiedthatthesoil wateroutputs(ET,fASWandTransp)werehighlysensitiveto Soil-TextureandtWaterMax(Almeidaetal.,2007).InEspreyetal.(2004), StandVolwasfoundtobehighlysensitivetoalphaCx,MaxCondand rho1.ForLAI,alsoconsistentwithourresults,SLA1,nWS,alphaCx, MaxCond,gammaF1andpFS20werehighlysensitive(kwas mod-eratelysensitiveinStandVolandless sensitiveinLAI),inwhich gammaF1andpFS20werealsoidentifiedbyAlmeidaetal.(2007)
[image:6.595.111.474.77.278.2] [image:6.595.87.504.556.743.2]Fig.4.First-ordersensitivityindexSiandtotaleffectsensitivityindexSTiasevaluatedbythevariance-basedmethod.Rankingofthe10mostsensitiveinputparametersfor eachmodeloutputvariablelistedinTable2accordingtotheirfirst-ordersensitivityindexvalues.
tobesensitive.Espreyetal.(2004)however,foundthesensitivity offracBB1inStandVoltobelowerthanourfindings,andfracBB0 wasfoundtobeinsensitive.Attherelativelyyoungstandages (4.5–11years)analysedbyEspreyetal.(2004),wefoundhigher sensitivitiesoffracBB0butthisdecreasedasthestandsmatured, andconversely, fracBB1showedtheopposite effect(Songetal., submittedforpublication).In concertwithourresults, Almeida etal.(2004a)foundavDBHandWFtobehighlysensitivetonWS; allthebiomassrelatedmodeloutputsweresensitivetoalphaCx; almostallmodeloutputsweresensitivetoMaxCond,andWRwas sensitivetopRn.
ToillustratetheeffectivenessofglobalSAinrevealingmodel structureandbehaviour,someexamplesarediscussedbelow.The similarsensitivityrankingsof inputparameters forbothavDBH andBasAreaareduetotheallometricrelationshipfortreesin 3-PG2,BasArea=(avDBH/200)2*.ThehighersensitivitiesofavDBH
and BasArea to nWS can be explained by theempirical power relationshipavDBH=(avWS/aWS)1/nWS,whereavWSistheaverage
stembiomass(LandsbergandWaring,1997;SandsandLandsberg, 2002).Sincethebiomassallocationtostemandfoliagedepends ontheDBH(Sands,2004),bothLAIandWFarealsohighly sensi-tivetonWS.LAIisasurrogateforWFduetothelinearrelationship LAI=WF*SLA1*c,wherecisaconstant,andSLA1,asascalefactor inLAI,hasthehighest sensitivity.Thesimilarrankingsof input parametersensitivityforLAIandWF(Fig.4)areduetotheclose relationshipofthesevariables.Forthewater-relatedmodel out-putsET,fASWandTransp,weobservedthatToptandtWaterMax
arethemostsensitiveparameters(Fig.4).In3-PG2,thecanopy quantumefficiencyisrelatedtothemonthlymeantemperature Ta(◦C)andspecies-specificoptimumtemperatureforgrowthTopt
(Landsbergand Waring, 1997).A dimensionlessmodifier fT(0≤
fT≤1)isdefinedin3-PG2asfollows:
fT(Ta)=
Ta−Tmin
Topt−Tmin
Tmax−Ta
Tmax−Topt
(Tmax−Topt)/(Topt−Tmin)(9)
with fT=0 if Ta≤Tmin or Ta≥Tmax. In the subsequent model
logic, temperature modifier fT is then involved in the
calcu-lation of canopy conductance, which in turn feeds into the Penman–Monteithequationincalculatingtranspiration(Transp) and evapotranspiration(ET). Whilstfor fASW,theavailablesoil water under forest is totalrainfallminus theamount of water consumedbyTranspandETandinterceptedbythecanopy( tWater-Max).TherelativelyhighersensitivitiesofET,fASWandTranspto tWaterMaximplythatrainfallisamajorlimitingfactorformostof thesitesunderstudy.Duetothenatureofthetemperature mod-ifier(Eq.(9)),water-relatedmodeloutputsaremoresensitiveto ToptthantheothertwotemperatureparametersTminandTmax.The
implicationofthismodelstructureisthatthesensitivitiesofmodel outputsmaychangewithinputdata(e.g.themonthlyaverage tem-perature).
[image:7.595.126.486.77.448.2](WR),whichmayalsobeaffectedbythesoilwaterstresspartially determinedbysoilproperties (LandsbergandWaring, 1997).In addition,theSoilTextureindirectlyinfluencedothermodeloutputs byalteringthesoilwaterand carbonallocations.Input parame-tersthathavedirectfunctionalrelationshipswithcertainmodel outputswillexhibitgreatersensitivities(e.g.LAItoSLA1,avDBH tonWS,andET,fASWandTransptoTopt),whilstinteractionswith
othermodelparametersmayattenuatetheinfluenceofthe param-eteritselftosomeextent.
Inputparametersensitivitiesalsovariedwithmodelsimulation time (stand age). This is partly due to the existence of time-dependentstatevariables(e.g.daily/monthlyclimatedata,plant physiologicalprocesses suchas thegrowth of trees)and some non-linearprocesses,acommonfeatureofprocess-based ecolog-icalmodels. For example, many key physiological processes in 3-PG2areage-dependent andare implementedthroughanage modifierfage (LandsbergandWaring, 1997;Sands, 2004).fage is
a dimensionless variable which declines with age and acts as a scale factor tothe physiological modifier physMod. physMod, in turn, modifies canopy conductance and quantum efficiency (Almeidaetal.,2004a).Therationaleisthatthestomatal conduc-tanceoftreesis sensitivetotheirhydraulicconductance,which declines as the tree ages (Landsberg and Waring, 1997). As a result,fage hasanindirectinfluence onalmostall physiological
processes in 3-PG2.Although some parameters didnot exhibit obviouspatternsduetotheinterferenceofsite-specificdata(e.g. soilpropertiesandclimatedata),manysensitivitieschangedwith modelsimulationtime.For LAI,forexample,thesensitivitiesof SLA1,alphaCx,FR,LAIgcxandfullCanAgedeclineastreesage,whilst thesensitivityofgammaF1increases.Afullinvestigationof time-dependenceofsensitivitiesispresentedinSongetal.(submitted forpublication).
Our resultsshowedthattheglobalSAtechniquecan quanti-tativelyidentify influentialinput parameters forspecific model outputvariables.To thebestofourknowledge, thisis thefirst useof a globalSAtechniquetoexplore a forestgrowthmodel. Wehavedemonstratedthephysiologicalsignificanceofinfluential inputparametersforparticularmodeloutputvariables.This infor-mationcanaidinboththeelucidationofmodelstructureandmodel calibration.Whilst previouslocal SA studies have qualitatively identified theinfluential input parameters, they fall wellshort ofquantifyingthecontributionofvarianceofeachinput param-etertomodeloutputvariables under anintegrated framework. Anaccurateassessment, ranking,or comparison of sensitivities is impossible using local SA, which in turn clouds the under-standingofmodelstructure,especiallyforparameter-richmodels (SaltelliandAnnoni,2010).Fromtheperspectiveofmodel calibra-tion,onegreatchallengeintheapplicationofecologicalmodels isthatsometimeswehavetosetdefaultvaluesfor someinput parameterswhichmaybetooexpensivetoquantifyempirically. GlobalSAtechniques,whichquantifytherelativeimportanceof eachinputparametertomodeloutputs,canhelpsetsafedefault valuesforthoselessinfluentialinputparameters.GlobalSAcan alsogreatlysimplifymodelcalibrationthroughenablingthemost influential parameters to be targeted for data acquisition and refinement.
5. Conclusions
Inthispaper,weprovidedasystematicmethodologyfor sensi-tivityanalysisofaprocess-basedforestgrowthmodel3-PG2.Both screeningandvariance-basedsensitivityanalysismethodswere adopted,and a comprehensivesensitivity analysisofthemodel outputstomodelinputparameterswaspresented.The sensitiv-ityrankingsfrombothmethodswerehighlycorrelated,suggesting
thattheelementaryeffectsmethodcanprovideareasonable esti-mateofmodelsensitivitieswithlowercomputationalcosts,butare notsuitablefortheprecisequantification ofmodelsensitivities. Theresultsofourtwo-stageimplementationshowedthatmodel parametersexhibitbothdirecteffectsonmodeloutputsand indi-recteffects,throughtheirinfluenceonotherparameters.Wealso demonstratedthatfortheprocess-basedmodel3-PG2,sensitivities ofinputparametersmaychangewithinputdataorchangewith modelsimulationtimealthoughthelatterrequiresfurther investi-gationandisexaminedinmoredetailelsewhere.Wedemonstrated thatquantitative,global,variance-basedsensitivityanalyseswere abletouncover model sensitivitiesnot foundthroughprevious localSAs,andareessentialforthethoroughexplorationofmodel structureandbehaviour.
Acknowledgements
WearegratefulforthesupportoftheChinaScholarshipCouncil, andCSIRO’sSustainableAgricultureFlagship.Partialfinancial sup-portforthisresearchwasprovidedbytheNationalBasicResearch ProgramofChina(GrantNo.2012CB955304).Constructive com-ments by Dr. Anthony O’Grady and two anonymous referees improvedthepaperalot.
References
Almeida,A.C.,Landsberg,J.J.,Sands,P.J.,2004a.Parameterisationof3-PGmodelfor fast-growingEucalyptusgrandisplantations.ForestEcologyandManagement 193,179–195.
Almeida,A.C.,Landsberg,J.J.,Sands,P.J.,Ambrogi,M.S.,Fonseca,S.,Barddal,S.M., Bertolucci,F.L.,2004b.Needsandopportunitiesforusingaprocess-based pro-ductivitymodelasapracticaltoolinEucalyptusplantations.ForestEcologyand Management193,167–177.
Almeida,A.C.,Paul,K.I.,Siggins,A.,Sands,P.J.,Polglase,P.,Marcar,N.E.,Jovanovic,T., Theiveyanathan,S.,Crawford,D.F.,England,J.R.,Falkiner,R.,Hawkins,C.,White, D.,2007.Development,calibrationandvalidationoftheforestgrowthmodel 3-PGwithanimprovedwaterbalance.ClientReportNo.1786.
Almeida,A.C.,Siggins,A.,Batista,T.R.,Beadle,C.,Fonseca,S.,Loos,R.,2010.Mapping theeffectofspatialandtemporalvariationinclimateandsoilsonEucalyptus plantationproductionwith3-PG,aprocess-basedgrowthmodel.ForestEcology andManagement.259,1730–1740.
Battaglia,M.,Sands,P.,White,D.,Mummery,D.,2004.CABALA:alinkedcarbon, waterandnitrogenmodelofforestgrowthforsilviculturaldecisionsupport. ForestEcologyandManagement.193,251–282.
Bryan,B.A.,2012.High-performancecomputingtoolsfortheintegratedassessment andmodellingofsocial-ecologicalsystems.EnvironmentalModelingand Soft-ware,http://dx.doi.org/10.1016/j.envsoft.2012.02.006.
Bryan,B.A.,King,D.,Wang,E.,2010.Potentialofbiomassproductionfor achiev-ingwidespreadnaturalresourcemanagementunderclimatechange.LandUse Policy27,713–725.
Bryan,B.A.,Ward,J.,Hobbs,T.,2008.Anassessmentoftheeconomicand environ-mentalpotentialofbiomassproductioninanagriculturalregion.LandUsePolicy 25,533–549.
Campolongo,F.,Cariboni,J.,Saltelli,A.,2007.Aneffectivescreeningdesignfor sen-sitivityanalysisoflargemodels.EnvironmentalModellingandSoftware22, 1509–1518.
Campolongo,F.,Saltelli,A.,1997.Sensitivityanalysisofanenvironmentalmodel: anapplicationofdifferentanalysismethods.ReliabilityEngineeringandSystem Safety57,49–69.
Campolongo,F.,Saltelli,A.,Cariboni,J.,2011.Fromscreeningtoquantitative sen-sitivityanalysis.Aunifiedapproach.ComputerPhysicsCommunications182, 978–988.
Cariboni,J.,Gatelli,D.,Liska,R.,Saltelli,A.,2007.Theroleofsensitivityanalysisin ecologicalmodelling.EcologicalModelling203,167–182.
Chatfield,C.,1995.Modeluncertainty,dataminingandstatisticalinference.Journal oftheRoyalStatisticalSocietySeriesA:StatisticsinSociety158,419–466. Coops,N.C.,Hember,R.A.,Waring,R.H.,2010.Assessingtheimpactofcurrentand
projectedclimatesonDouglas-FirproductivityinBritishColumbia,Canada, usingaprocess-basedmodel(3-PG).CanadianJournalofForestResearch-Revue CanadiennedeRechercheForestiere40,511–524.
Coops,N.C.,Waring,R.H.,Landsberg,J.J.,1998.Assessingforestproductivityin AustraliaandNewZealandusingaphysiologicallybasedmodeldrivenwith averagedmonthlyweatherdataandsatellite-derivedestimatesofcanopy pho-tosyntheticcapacity.ForestEcologyandManagement104,113–127. Crossman,N.D.,Bryan,B.A.,Summers,D.M.,2011.Carbonpaymentsandlow-cost
Cukier,R.I.,Fortuin,C.M.,Shuler,K.E.,Petschek,A.G.,Schaibly,J.H.,1973.Studyof thesensitivityofcoupledreactionsystemstouncertaintiesinratecoefficients. I:theory.TheJournalofChemicalPhysics59,3873–3878.
Dale,V.H.,Joyce,L.A.,McNulty,S.,Neilson,R.P.,Ayres,M.P.,Flannigan,M.D.,Hanson, P.J.,Irland,L.C.,Lugo,A.E.,Peterson,C.J.,Simberloff,D.,Swanson,F.J.,Stocks, B.J.,Wotton,B.M.,2001.Climatechangeandforestdisturbances.Bioscience51, 723–734.
Efron,B.,Tibshirani,R.,1993.AnIntroductiontotheBootstrap.ChapmanHall,New York.
Esprey,L.J.,Sands,P.J.,Smith,C.W.,2004.Understanding3-PGusingasensitivity analysis.ForestEcologyandManagement193,235–250.
Helton,J.C.,Johnson,J.D.,Sallaberry,C.J.,Storlie,C.B.,2006.Surveyof sampling-basedmethodsforuncertaintyandsensitivityanalysis.ReliabilityEngineering andSystemSafety91,1175–1209.
Jansen,M.J.W.,1999.Analysisofvariancedesignsformodeloutput.Computer PhysicsCommunications117,35–43.
Jeffrey,S.J.,Carter,J.O.,Moodie,K.B.,Beswick,A.R.,2001.Usingspatialinterpolation toconstructacomprehensivearchiveofAustralianclimatedata.Environmental ModellingandSoftware16,309–330.
Landsberg,J.J.,Johnsen,K.H.,Albaugh,T.J.,Allen,H.L.,McKeand,S.E.,2001.Applying 3-PG,asimpleprocess-basedmodeldesignedtoproducepracticalresults,to datafromloblollypineexperiments.ForestScience47,43–51.
Landsberg,J.J.,Waring,R.H.,1997.Ageneralisedmodelofforestproductivityusing simplifiedconceptsofradiation-useefficiency,carbonbalanceandpartitioning. ForestEcologyandManagement.95,209–228.
Landsberg,J.J.,Waring,R.H.,Coops,N.C.,2003.Performanceoftheforest produc-tivitymodel3-PGappliedtoawiderangeofforesttypes.ForestEcologyand Management172,199–214.
Makler-Pick,V.,Gal,G.,Gorfine,M.,Hipsey,M.R.,Carmel,Y.,2011.Sensitivity analy-sisforcomplexecologicalmodels–anewapproach.EnvironmentalModelling andSoftware26,124–134.
Marino,S.,Hogue,I.B.,Ray,C.J.,Kirschner,D.E.,2008.Amethodologyfor perform-ingglobaluncertaintyandsensitivityanalysisinsystemsbiology.Journalof TheoreticalBiology254,178–196.
Morris,M.D.,1991.Factorialsamplingplansforpreliminarycomputational experi-ments.Technometrics33,161–174.
Myers,J.L.,Well,A.D.,2003.ResearchDesignandStatisticalAnalysis,seconded. LawrenceErlbaum,London,p.508.
Nossent,J.,Elsen,P.,Bauwens,W.,2011.Sobol’sensitivityanalysisofacomplex environmentalmodel.EnvironmentalModellingandSoftware26,1515–1525. Pan,Y.D.,Birdsey,R.A.,Fang,J.Y.,Houghton,R.,Kauppi,P.E.,Kurz,W.A.,Phillips, O.L.,Shvidenko,A.,Lewis,S.L.,Canadell,J.G.,Ciais,P.,Jackson,R.B.,Pacala,S.W., McGuire,A.D.,Piao,S.L.,Rautiainen,A.,Sitch,S.,Hayes,D.,2011.Alargeand persistentcarbonsinkintheworld’sforests.Science333,988–993.
Paterson,S.E.,Bryan,B.A.,2012.Food-carbontrade-offsbetweenagricultureand reforestationandtheefficiencyofmarket-basedpolicies.EcologyandSociety, acceptedforpublicationJuly42012.
Paul,K.I.,Booth,T.H.,Jovanovic,T.,Sands,P.J.,Morris,J.D.,2007.Calibrationofthe forestgrowthmodel3-PGtoeucalyptplantationsgrowinginlowrainfallregions ofAustralia.ForestEcologyandManagement243,237–247.
Paul,K.L.,Jacobsen,K.,Koul,V.,Leppert,P.,Smith,J.,2008.Predictinggrowthand sequestrationofcarbonbyplantationsgrowinginregionsoflow-rainfallin southernAustralia.ForestEcologyandManagement254,205–216.
Polglase,P.,Paul,K.,Hawkins,C.,Siggins,A.,Turner,J.,Booth,T.,Crawford,D., Jovanovic,T.,Hobbs,T.,Opie,K.,Almeida,A.,Carter,J.,2008.Regional oppor-tunitiesforagroforestrysystemsinAustraliaRIRDCPublicationNo.08/176. Saltelli,A.,2000.Sensitivityanalysisasaningredientofmodeling.StatisticalScience
15,377–395.
Saltelli,A.,2002.Makingbestuseofmodelevaluationstocomputesensitivity indices.ComputerPhysicsCommunications145,280–297.
Saltelli,A.,Annoni,P.,2010.Howtoavoidaperfunctorysensitivityanalysis. Envi-ronmentalModellingandSoftware25,1508–1517.
Saltelli,A.,Annoni,P.,Azzini,I.,Campolongo,F.,Ratto,M.,Tarantola,S.,2010. Vari-ancebasedsensitivityanalysisofmodeloutput.Designandestimatorforthe totalsensitivityindex.ComputerPhysicsCommunications181,259–270. Saltelli,A.,Ratto,M.,Andres,T.,Campolongo,F.,Cariboni,J.,Gatelli,D.,Saisana,M.,
Tarantola,S.,2008.GlobalSensitivityAnalysis:ThePrimer.JohnWiley&Sons, Ltd.
Saltelli,A.,Tarantola,S.,Chan,K.P.S.,1999. Aquantitativemodel-independent methodforglobalsensitivityanalysisofmodeloutput.Technometrics41,39–56. Sands,P.J.,2004.Adaptationof3-PGtonovelspecies:guidelinesfordatacollection
andparameterassignment.TechnicalReportNo.141.
Sands,P.J.,Landsberg,J.J.,2002.Parameterisationof3-PGforplantationgrown Euca-lyptusglobulus.ForestEcologyandManagement163,273–292.
Sobol’,I.M.,1967.Onthedistributionofpointsinacubeandtheapproximate evalu-ationofintegrals.USSRComputationalMathematicsandMathematicalPhysics 7,86–112.
Sobol’,I.M.,1990.Onsensitivityestimationfornonlinearmathematicalmodels. MatematicheskoeModelirovanie2,112–118.
Song,X.,Bryan,B.A.,Paul,K.I.,Zhao,G.Time-dependentparametersensitivityin ecologicalmodels.EcologicalModelling,submittedforpublication.
Tang,Y.,Reed,P.,Wagener,T.,vanWerkhoven,K.,2007.Comparingsensitivity anal-ysismethodstoadvancelumpedwatershedmodelidentificationandevaluation. HydrologyandEarthSystemSciences11,793–817.
vanOijen,M.,Rougier,J.,Smith,R.,2005.Bayesiancalibrationofprocess-based for-estmodels:bridgingthegapbetweenmodelsanddata.TreePhysiology25, 915–927.
White,M.A.,Thornton,P.E.,Running,S.W.,Nemani,R.R.,2000.Parameterizationand sensitivityanalysisoftheBIOME–BGCterrestrialecosystemmodel:netprimary productioncontrols.EarthInteractions4,1–85.
Wu,Q.-L.,Cournède,P.-H.,Mathieu,A.,2011.Anefficientcomputationalmethodfor globalsensitivityanalysisanditsapplicationtotreegrowthmodelling. Reliabil-ityEngineeringandSystemSafety,http://dx.doi.org/10.1016/j.ress.2011.07.001. Xu,C.,Gertner,G.,2007.Extendingaglobalsensitivityanalysistechniqueto mod-elswithcorrelatedparameters.ComputationalStatisticsandDataAnalysis51, 5579–5590.
Xu,C.,Gertner,G.Z.,Scheller,R.M.,2009.Uncertaintiesintheresponseofaforest landscapetoglobalclimaticchange.GlobalChangeBiology15,116–131. Yang,J.,2011.ConvergenceanduncertaintyanalysesinMonte-Carlobased