A prototype Web-based implementation of the QEST model
Alain Abran1, Martin Kunz2, Reiner R. Dumke2, Luigi Buglione1 3
1 École de Technologie Supérieure - ETS
1100 Notre-Dame Ouest, Montréal, Canada H3C 1K3
2 Department of Computer Science
Institute for Distributed Systems
Abstract: This paper presents and describes a Web-based implementation of a three-dimensional software quality measurement model. The implementation is based on the 2003 version of the ISO quality model for software products: ISO 9126. The prototype presented includes all the 120+ measures proposed in the ISO standard, as well as weight assignments, target values, current project values and automated calculations for a three dimensional representation of quality performance, based on the geometrical tetrahedron formula of the QEST model.
Keywords: ISO 9126, QEST model, software quality measurement, Web-based quality model.
1 Introduction
Over the past thirty years, measurement of the quality of software products has been fraught with difficulties. The first is related to the nature of software, which is a complex intellectual artifact developed through successive iterations and phases until deployed and used in a variety of organizational and industrial contexts.
A third difficulty is the lack of tools in the software engineering community to represent quantitatively and in a consolidated manner the many possible quality viewpoints, while at the same time keeping track of the value of individual views on quality.
Finally, there is a fourth difficulty which is related to the largely paper-based measurement process software engineers working in highly tool-based environments must undergo, given that these engineers are culturally averse to such paper-based processes.
Over the past decade, the ISO/IEC Joint Technical Committee (JTC1), Subcommittee 7 (SC7) on Systems and Software Engineering, has invested significantly in tackling the first two of these difficulties through years of collaboration at the international level. Finally, in 2003, the ISO succeeded in publishing a coherent and fairly comprehensive set of quality standards, including multiple related quality models supported by detailed measurement methods and procedures applicable throughout the full development process (ISO 9126). Meanwhile, other researchers tackled the third difficulty of designing multidimensional models of quality, such as the QEST model, which was developed to represent multiple views of quality [1,2] and which is used in conjunction with the ISO model [11].
The scope of this paper is to report on the work carried out in the design of a Web-based prototype to address the problems associataed with the previously paper-based measurement process. Section 2 presents an overview of the ISO 9126 model of quality; section 3, the structure of the QEST model; and section 4, the prototype developed for a Web-based implementation of ISO 9126 with multidimensional representation of quality using the QEST model approach. Finally, in section 5, conclusions and prospects for future work are presented.
2 ISO model for software product quality
The ISO has developed a set of quality standards, ISO 9126, covering the full development process [4,5,6,7]. These standards take into account the initial quality requirements addressed during each of the development phases, thereby allowing the planning, design, monitoring and control of quality.
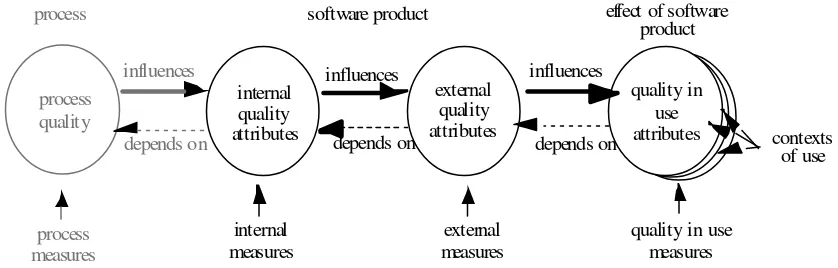
process
process software product effect of software
product
Figure 1: ISO/IEC 9126 Quality in Lifecycle
Moreover, the proper quality measurement and evaluation methodologies have to be present and applied. This ISO 9126 series of standards offers both ISO recognized quality models and corresponding measurements together with measurement scales and methods.
3 The structure of the QEST model
QEST (Quality factor + Economic, Social and Technical dimensions)[1] is a multidimensional software quality measurement model. It provides a multidimensional structured shell, which can then be filled according to management objectives for any specific project: it is therefore referred to as an open model. With this topology of quality models, it is possible to handle multiple and distinct viewpoints, all of which can exist concurrently in any software project.
The QEST model integrates into a single representation the following three dimensions:
• the Economic one, represented by the managers’ perspective; • the Social one, represented by the users’ perspective;
• the Technical one, represented by the developers’ perspective.
Figure 2: Representation of the QEST model [1]
The three dimensions (E, S, T) in the space correspond to the pyramid's base corners, while the convergence of the sides, the P vertex, describes the top quality level. When the three sides are of equal length, the solid shape that represents this three-dimensional concept is therefore a pyramid with its triangular base and sides of equal length (a tetrahedron).
This pyramid-type representation imposes the following constraint: the sides must be equal. This is achieved through giving equal weights to each of the three different dimensions chosen and having sides of length and exactly equal to 1 (a regular tetrahedron); in this way, the dimensions are represented through a normalized value between 0 and 1 for each of them on a ratio scale.
For any specific project, the value on each dimension is given by the weighted sum of a list of n normalized measures having been selected as representative of each of the three viewpoints. The values of the three dimensions shown in Figure 2, referred as (Qe,Qs,Qt), each placed on its own side of the tetrahedron, describe a sloped plane section in the space and return the three-dimensional measurement values.
The tetrahedron supplies several performance indices:
• the distance between the tetrahedron base and the plane – the greater the distance, the higher the quality level
• the area of the sloped plane section- the smaller the area, the higher the quality level
• the volume of the lower part of the truncated tetrahedron – the greater the volume, the higher the quality level
4 The prototype
Development of the Web-based prototype for software product quality measurement is a joint initiative of the École de Technologie Supérieure in Canada and the Otto-von-Guericke University in Magdeburg, Germany. More specifically, the prototype provides a software tool-based environment for the use of the ISO 9126 quality models with the QEST multidimensional representation of software quality measurement.
The program is implemented in Java™ 1.4.1 as an applet, making it possible to run the prototype in every Web browser with the Java Runtime Environment 1.4.1.
The most relevant steps and features of this Web-based prototype are presented below.
4.1 Step 1: Selection and weighting of metrics from three viewpoints
For any software project, selection of the project-relevant ISO 9126 quality models, characteristics, sub-characteristics and sets of metrics is facilitated by the prototype, which imbeds the full content of these four parts of ISO 9126 into a single tree structure (Figure 3). Furthermore, the Web-based prototype makes it possible to take into account up to three viewpoints and to assign the corresponding viewpoint weights for each level of selection (quality models, quality characteristics and quality sub-characteristics).
Figure 3: ISO 9126 tree in the prototype
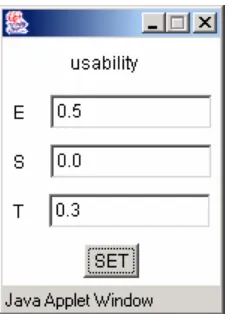
The prototype provides the possibility of inputting three values for every node of the 9126 quality tree, one for each viewpoint. Every metric with a weight greater than zero within a viewpoint dimension is selected for this specific measurement viewpoint only (Figure 4).
Figure 4: Selection of a node
As well, the user must spread these weights uniformly among the “sons” of a single selected node. All the selected nodes deliver a sub-tree with the corresponding path from the selected metrics to the root. The weighting in Figure 4 means that the usability node will take into account the “E” sub-tree with a value of 0.5 and in the “T” sub- tree with a value of 0.3.
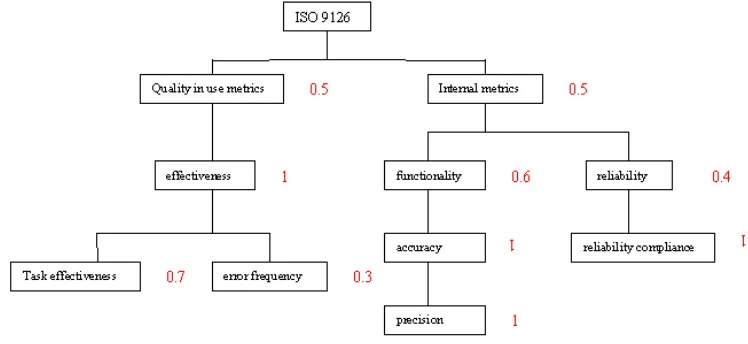
The tree in Figure 5 shows the instantiation of a selection from a single viewpoint. Following selection and weighting of metrics, the prototype builds up to three independent sub-trees, one for each viewpoint.
Figure 5: A tree of selected and weighted nodes
The usability node is not part of the “S” sub-tree because it was not selected for this viewpoint.
After the user has selected and weighted the nodes, the prototype verifies whether or not there is any node with a value higher than 1, or if there are any brothers with a sum over 1 or less than 1. Because the highest weight is 1, the weight is 100% for this node and the sum of the weights for the sons of one selected node must be exactly 1.
4.2 Step 2: Assignment of threshold values
Upon completion of the selection, the project threshold values (the min and the max for a specific metric) must be entered through the data collection window (Figure 6). These threshold values are usually selected before project initiation, and can be specified either for a particular project, or selected from the documentation of corresponding metrics in [4-7].
4.3 Step 3: Data collection of project data
collector, and within the threshold intervals determined in Step 2.
Figure 6: The data collection window
It is then up to the prototype to normalize these data values, using the min and max thresholds. Such normalization is required to represent the multiple viewpoints through a regular, geometrical, three-dimensional representation. Each normalized value is immediately displayed in the last column of Figure 6. Subsequently, the prototype takes these input data into the weighted ISO 9126 tree and consolidates them for each viewpoint selected.
Once it has derived the values for the E, S and T viewpoints, the prototype calculates the three quality performance indices, using the QEST formulas.
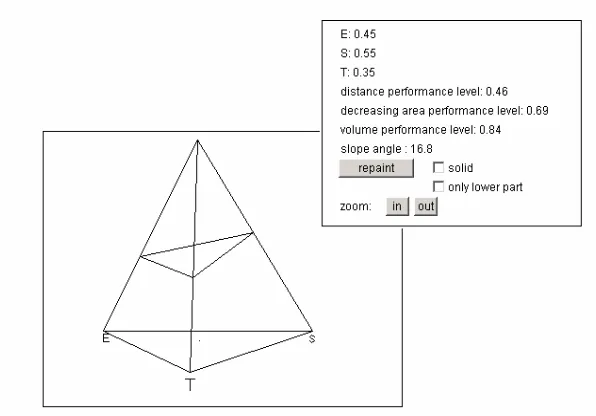
4.4 Step 4: 3-D view of quality
In Step 4, the prototype displays a 3-dimensional representation of the quality associated with the software product being measured and assessed. As described, this 3-D representation is expressed in the form of a tetrahedron (Figure 7), where the sloped plane section displayed yields the quality achieved at the time of project evaluation for each of the three viewpoints. In addition, the prototype presents, in a side window, the three geometrical measures of quality performance, through the distance of the plane from the zero level, the slope of the plane indicating whether or not quality is progressing equally for each viewpoint, and the overall quality achieved through either a two-dimensional index (the surface of the slope) or a three-dimensional index (the volume of the tetrahedron below the plane in Figure 8).
Figure 8: Solid shape of the lower part
The prototype provides additional technical features, such as rotation of the 3-D tetrahedron, either to display only the lower part or to display the tetrahedron as a solid, which make it easier for some users to grasp the multidimensional perspective of quality within ISO 9126.
5 Conclusions & Prospects
such as are often found in decentralized development environments.
A subsequent improvement will be the development of a data repository in which to store the data from many projects and to provide such data to the visualization tool.
As an additional feature, min and max could be provided by the data repository, and all project data (weights and selected nodes) could be stored in the database, too. This would would make it possible for people who are widely spaced geographically to provide data on quality for a team assessment of their software project.
Acknowledgments
The authors would like to thank René Köppel and René Braungarten for their assistance in the development of the first prototype.
This work has been supported by the following organizations: École de technologie supérieure (in Montreal, Québec, Canada) and Otto-von-Guericke University (in Magdeburg, Germany).
References
[1] Buglione L. & Abran A., Multidimensional Software Quality Measurement Models: A Tetrahedron-based Design. In: Dumke R, Abran A, editors. Software Measurement: current trends in research and practice. Deutscher Universitäts- Verlag GmbH, 1999.p.93-107.
[2] Buglione L. & Abran A., Implementation of a Three-Dimensional Software Performance Measurement Model. Technical Report, draft, Université du Québec à Montréal, Canada, 1998.
[3] Buglione L. & Abran A., Geometrical and Statistical Foundations of a Three-dimensional Model of Software Performance, Advances in Engineering Software, Elsevier Publisher, Vol. 30, No. 12, December 1999, pp.913-919
[4] ISO 9126-1: 2001 Software Engineering –Product quality -- Part 1: Quality model, International Organization for Standardization, Geneva, 2001
[5] ISO 9126-2:2003 Software Engineering -- Product quality -- Part 2: External metrics, International Organization for Standardization, Geneva, 2003
[6] ISO TR 9126-3:2003 Software Engineering – Product quality -- Part 3: Internal metrics, International Organization for Standardization, Geneva, 2003
[8] Boehm, B.W., J.R. Brown, J.R. Kaspar, M. Lipow & G. MacCleod. Characteristics of Software Quality. Amsterdam: North Holland. 1978 [9] McCall, J.A., P.K. Richards & G.F. Walters. Factors in Software Quality,
vol. 1,2, and 3, AD/A-049-014/015/055. Springfield, VA: National Technical Information Service, 1977
[10] Dromey, R.Geoff. “Cornering the chimera”. IEEE Software, vol. 13, no 1, January, p. 33-34, 1996
[11] Buglione L., Kececi N. & Abran A., An Integrated Graphical Assessment for Managing Software Product Quality, American Society for Quality – Software Division Conference, Ottawa, Oct. 2002.
![Figure 2: Representation of the QEST model [1]](https://thumb-ap.123doks.com/thumbv2/123dok/2602388.1662574/4.596.208.427.67.204/figure-representation-qest-model.webp)