http://dx.doi.org/10.12988/ams.2014.44307
Euphotic Depth Zone Variation in
Peninsular Malaysia Maritime
Asmala Ahmad
Department of Industrial Computing,
Faculty of Information and Communication Technology, Universiti Teknikal Malaysia Melaka (UTeM),
76100 Durian Tunggal, Melaka, Malaysia Abd Rahman MatAmin, Fadhli Ahmad
School of Ocean Engineering, Universiti Malaysia Terengganu (UMT), 21030 Kuala Terengganu, Terengganu, Malaysia
Mustafa Mamat
Fakulti Informatik dan Komputeran, Universiti Sultan Zainal Abidin (UniSZA), Kampus Tembila, 22200 Besut, Terengganu, Malaysia
Khiruddin Abdullah
School of Physics, Universiti Sains Malaysia (USM), 11800 Minden, Malaysia
Copyright © 2014 Asmala Ahmad et al. This is an open access article distributed under the Creative Commons Attribution License, which permits unrestricted use, distribution, and reproduction in any medium, provided the original work is properly cited.
Abstract
This study is conducted in Peninsular Malaysia maritime to investigate the euphotic zone depth (Zeu) variation and the possible suspended matter that may contribute to
the variation. The Zeu data were acquired from the MODIS Aqua satellite from
November 2002 to September 2013. The result shows that the Zeu along the Malaysia
maritime are highly seasonal-dependent. The lowest Zeu values are observed during
during the southwest monsoon season (SWMS) for the west coast area. Chlorophyll-a (Chl-Chlorophyll-a) Chlorophyll-and colored dissolved orgChlorophyll-anic mChlorophyll-atter (CDOM) Chlorophyll-are found to be the contributing factors for the coastal line and open water area. While, sediment only contributes to the area located along the coastal line where lower Zeu values are
observed.
Keywords: Euphotic zone depth, MODIS, sediment, monsoon
1 Introduction
Water clarity is one of the physical water optical properties and traditionally measured by using Secchi disc technique [8]. Such measurements are usually carried out using research cruises, which have limited temporal and spatial accessibility. With the advancement of the remote sensing technology such limitations can be solved; recently, MODIS OBPG have distributed euphotic zone depth (Zeu) product
through Giovanni interface that can be used to monitor water clarity in ocean. Theoretically, Zeu is defined as the depth of a water body at which the light intensity
is reduced to 1% from the value at the surface [4], [9]. Zeu depends on the suspended
matter in the water body (i.e. high suspended sediment concentration can decrease Zeu and vice versa), therefore is a good indicator to monitor the clarity of the water
body. The suspended matter can be in a form of sediment, dead organic material or phytoplankton. Although the product can indicate water clarity (or turbidity), it cannot specifically tell the type of suspended matter that affects the Zeu. Determining
the possible suspended sediment that contributes to the variation in Zeu is an
interesting but challenging task. Generally, there are two common methods to estimate Zeu using remote sensing techniques [9], [5]. The first method is the simple
Chl-a approach, which is an empirical method that is based on assumption by Morel et al. [5]. By using this method, the Chl-a concentration can be used to calculate Zeu
based on the fact that a euphotic zone provides a suitable place for marine phytoplankton to photosynthesize. Lee at al. [9] has developed a different approach that made use of water inherent optical properties (IOP). This developed method is named IOP-Centered approach. In this method, Zeu is computed based on the
absorption and backscattering coefficients at 490 nm. The performance both methods have been tested in the East China Sea by Shang et al. [7]. The results showed that both methods were robust, with the IOP-Centered approach was found more reliable. The main objectives of this study are therefore to monitor Zeu variation in Peninsular
Malaysia maritime and determine the possible suspended matter that contribute to the variation of Zeu. In this study, data acquired from MODIS Aqua from 2002 to 2013
2 Materials and Methods
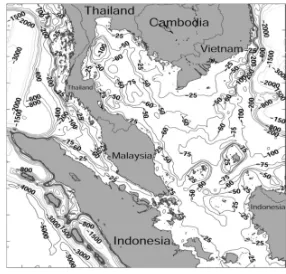
Peninsular Malaysia is part of Malaysia, covering an area of 131,598 square kilometres. It shares a land border with Thailand to the north while to the south is the island of Singapore. Across the Strait of Malacca to the west lies the island of Sumatra, Indonesia. Malaysia’s climate is influenced by the wind systems that originate from Indian Ocean and South China Sea. Every year, southwest monsoon season (SWMS) and northeast monsoon season (NEMS). SWMS occurs from May to September and brings rain to the west coast of Peninsular Malaysia, while NEMS occurs from November to March and brings rain to the east coast of Peninsular Malaysia. Figure 1 shows the bathymetry map for the study area [2].
Fig. 1. Bathymetry map of Peninsular Malaysia. Depth contours are in meters.
The data for Zeu, Rrs(667), Chl-a and CDOM are initially explored by using Giovanni
system. Giovanni is a Web-based online visualization and analysis tool that allows a user to browse Earth science remote-sensed and numerical models data from multitemporal and multiresolution acquisition systems. The Giovanni products are updated routinely to provide the most recently available data, thus benefiting users in carrying out short and long terms research. In this study, the coordinates of the study area are from 1oN to 6.5oN latitude and from 98.5oE to 106oE longitude covering the whole Peninsular Malaysia. This study makes use multitemporal dataset downloaded from the Giovanni system. MODIS Aqua data that were resampled at 4 km resolution from November 2002 to September 2013 are used. Zeu can be derived by
using Lee et al. [9] algorithm, which is based on the IOP approach:
) Z ( K
605 . 4 Z
eu PAR
eu = (1)
where, KPARis the vertical attenuation coefficient of photosynthetic available radiation (PAR). Remote sensing reflectance at 667 m wavelength, Rrs(667) is used
( )
( )
concentration acquired from MODIS Aqua sensor is used to indicate the presence of phytoplankton in the study area. The MODIS Aqua data are from the period of November 2002 to March 2013. The Chl-a concentration is determined using OC3M algorithm that is extended from the OC4 and OC2 algorithms that were originally developed for SeaWiFS sensor [3]. The OC3M algorithm is defined as:[
]
(
)
(0.283 2.753R 1.457R 0.659R 1.403R ) Aqua CDOM index product is used as a indicator to the present of the above mention suspended matter in the study area. This product was generated by OBPG by using a simple band ratio algorithm [5].3 Results and Discussion
The first section discusses the Zeu variation, while the second section discusses the
possible constituents that may cause the variation. 3.1 ZeuVariation
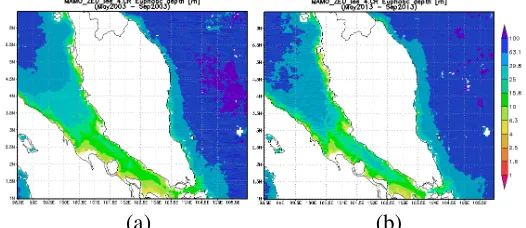
Figure 2(a) shows the Zeu image for the period from November 2002 to March 2013.
In overall, high turbid water areas can be seen along the coastal line and in the lower water area with the Zeu values ranging from 1 to 100 m. The turbid water area in the
east coast of Peninsular Malaysia shows a different pattern as compared to the west coast area. In the east coast region, highly turbid water is observed along the coastal line stretching from Kelantan at the north to Johor at the south. Along the east coast coastal line, the Zeu values range from 10 to 15.8 m. Far from the coastal line, the
of Peninsular Malaysia, the Zeu varies from south to north. The high turbidity zone is
observed along the Straits of Malacca but further to the northwest, the zone decreases. The Zeu values for this area are from 4 to 63 m.
(a) (b)
Fig. 2. (a) Zeu for November 2002-March 2013 and (b) Area-averaged time series of Zeu for
2003-2013.
Figure 2(b) shows the area-averaged time series of Zeu for the study period. The
highest Zeu value is observed in April (2003-2009, 2011-2012), while, for the year of
2010, the highest Zeu value occurs in May. The highest Zeu value ranges from 70 to
80 m. The Zeu starts to decrease to the lowest value in December (2003-2005,
2007-2009, 2011) and January (2003, 2007, 2011, 2012). The lowest Zeu values are in the
range of 30 to 40 m. Figure 3(a) shows the Zeu image during the NEMS for the
period from November 2002 to March 2003. The Zeu image for the period from
November 2012 to March 2013 is shown in Figure 3(b). The turbid water area is apparently wide within NEMS period especially along the coastal line of Peninsular Malaysia east coast region. During this period, the Zeu value reaches as low as 6.3 m.
The turbid water area covers coastal water line from Kelantan at the north to Johor at the south. Regarding the distance from the coast line, the Zeu pattern is almost the
same with the Zeu image in Figure 2(a). In the clear water region, the Zeu values are
from 25 to 63 m. For the western part of Peninsular Malaysia, the Zeu trend remains
the same as in Figure 2(a). The Zeu pattern for the period from November 2002 to
March 2003 remains the same as Zeu pattern for the period from November 2012 to
March 2013.
(a) (b)
Figure 4(a) shows the Zeu image during SWMS from May to September 2003. As
compared to Figure 2(a), the turbid water area increases, especially at the north of the Malacca Straits. The same Zeu pattern is observed for the May 2013 to September
2013 image as shown in Figure 4(b). The Zeu values towards the south of Malacca
Strait are almost the same with Figure 2(a) for both 2003 and 2013 NEMS. Monsoonal comparison shows that the wide area of low Zeu values are observed
along the east coast region for the May to September 2013 as compared to the May to September 2003 monsoon season. The turbid water area for the May to September 2013 is found to be decreasing.
(a) (b)
Fig. 4. Zeu for (a) May 2003-September 2003 and (b) May 2013-September 2013.
3.2 Possible Constituents
There are a number of factors than may contribute to the variation in the Zeu value in
the study area. Here, we investigate the possible contribution factor. Figure 5(a) shows the Rrs(667) in the study area for the period from November 2003 to March
2013. This Figure shows that the Rrs values are higher along the west coast of
Peninsular Malaysia and along the Sumatra coastal line compared to other locations. Rrs values along the east coast of Peninsular Malaysia coastal line are quite constant.
When compared to Figure 2(a), the high turbidity areas seem to be represented by high Rrs(667). For moderate Zeu values, no correlation is observed. Figure 5(b) shows
the Rrs(667) values observed from December to January every year. The highest Rrs
value occurs concurrently with the lowest Zeu value.
(a) (b)
Fig. 5. (a) Rrs(667) for November 2002-March 2013 and (b) Rrs(667) area-averaged
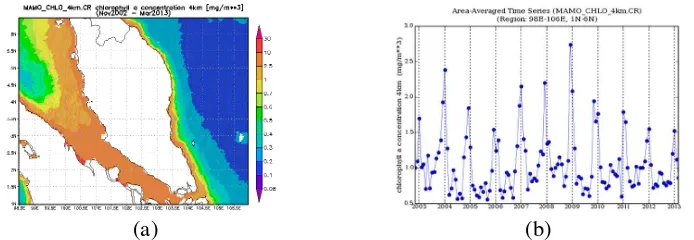
The other factor that may lead to the turbidity variation is the present of phytoplankton, which can lower the Zeu. In this study, the Chl-a values are used as an
indicator to the presence of phytoplankton in the water body. Figure 6(a) shows the Chl-a concentration in the study area for the period from November 2003 to March 2013. The result shows that high Chl-a concentrations are observed along the Malacca Straits and along the east coast Peninsular Malaysia. The Chl-a value in this area varies between 0.2 to 30 mg/m3. Low Chl-a concentrations are observed in the South China Sea. As compared to Figure 2(a), this result indicates that the low Zeu
values occurred concurrently with the high Chl-a dominated area. This shows that, the Zeu are highly correlated with the presence of phytoplankton. The Chl-a
area-averaged time series that is shown in Figure 6(b) also shows high correlations with the Zeu. Higher Chl-a concentrations are observed from December to January every
year. These peak months are consistent with the months having the lowest Zeu values.
(a) (b)
Fig. 6. (a) Chl-a concentration for November 2002-March 2013 and (b) Chl-a area-averaged time series for 2003-2013.
Figure 7(a) shows CDOM variation in the study area for the period from November 2002 to March 2013. High CDOM values are observed in the Malacca Straits, along the west coast and east coast of Peninsular Malaysia. In this area, the CDOM values are from 4.4 to 7. In the west coast of Peninsular Malaysia, the lowest CDOM is below 4.4. Low CDOM area is observed at the top left of the image; this area is considered as open water regions that are located far from the coastal line. In the east coast of Peninsular Malaysia, high CDOM values are observed along the coastal line where the highest CDOM values are observed near river estuaries in Pahang and Kelantan. Based on the knowledge of the study area, it is known that, the discharge carried by the rivers contains much CDOM. As expected, the CDOM value shows a decreasing trend at open water area. The CDOM values in the open water area are from 1.8 to 3.1. As compared to Figure 2(a), the Zeu and CDOM variation are highly
correlated especially at the low Zeu area. The area-averaged time series for these two
(a) (b)
Fig. 7. (a) CDOM concentration for November 2002-March 2013 and (b) CDOM area-averaged time series for 2003-2013.
4. Conclusion
In this study, Zeu variation for Peninsular Malaysia from November 2002 to
September 2013 is investigated. Lower Zeu values are observed in the west coast
compared to the east coast area. In the east coast area, low Zeu values are observed
along the coastal line, while high Zeu values are observed far from the coastal line. It
is also found that Zeu values are highly seasonal-dependent. During NEMS, lower Zeu
values are observed along the east coast coastal line for the monsoon period from November 2002 to March 2003 and this pattern is repeated for the monsoon period from November 2012 to March 2013. This is also true for SWMS that occured from May to September within the study period. The sediment detected by Rrs(667) is
correlated with Zeu especially along the west coast coastal line of Peninsular
Malaysia. However, sediment does not contribute to euphotic zone variation in the east coast of Peninsular Malaysia. The Zeu variation is influenced mainly by the
presence of phytoplankton, as indicated by the Chl-a concentration, for both side of Peninsular Malaysia. Low Zeu values are observed at the areas of high Chl-a
concentration, i.e. coastal and open water regions. It is also found that CDOM also contributes to the variation in water clarity where high correlation between these parameters is found. Finally, it can be concluded that the water clarity in Peninsular Malaysia maritime is highly seasonal-dependent. The phytoplankton and CDOM are the main factors that contribute to the clarity of coastal and open water regions. Sediment concentrations only affect the water clarity along the coastal lines.
Acknowledgment
References
[1] A. Ahmad and S. Quegan, Multitemporal Cloud Detection and Masking Using MODIS Data, Applied Mathematical Sciences, 8(7) (2014), 345 – 353.
[2] B.J. Lipa, D.E. Barrick, J. Bourg and B.B. Nyden, HF radar detection of tsunamis, Journal of Oceanography, 62(5) (2006), 705 – 716.
[3] J. Chen, C. Yi, W. Quan and Z. Wen, Systematic underestimation of MODIS global chlorophyll-a concentration estimation algorithm associating with scale effect, IEEE Sensors Journal, 13(5) (2013), 1656 – 1661.
[4] J.T.O. Kirk, Light and photosynthesis in aquatic ecosystems, Cambridge university press, 1994.
[5] Morel and B. Gentili, A simple band ratio technique to quantify the colored dissolved and detrital organic material from ocean color remotely sensed data, Remote Sensing of Environment, 113(5) (2009), 998 – 1011.
[6] R.L. Miller and B.A. McKee, Using MODIS Terra 250 m imagery to map concentrations of total suspended matter in coastal waters, Remote sensing of Environment, 93(1) (2004), 259 – 266.
[7] S. Shang, Z. Lee and G. Wei, Characterization of MODIS-derived euphotic zone depth: results for the China Sea, Remote Sensing of Environment, 115(1) (2011), 180 – 186.
[8] S. Weeks, P.J. Werdell, B. Schaffelke, M. Canto, Z. Lee, J.G Wilding and G.C. Feldman, Satellite-derived photic depth on the great barrier reef: spatio-temporal patterns of water clarity, Remote Sensing, 4(12) (2012), 3781 – 3795. [9] Z. Lee, A. Weidemann, J. Kindle, R. Arnone, K.L. Carder and C. Davis,
Euphotic zone depth: Its derivation and implication to ocean‐color remote sensing, Journal of Geophysical Research, 112(C03009) (2007), 1 – 11.