THE DISPLACEMENT MODELS OF THE LUSI MUD VOLCANO
EMBANKEMENT DAMS USING FEM
Didi S. Agustawijaya Sukandi
Senior Lecturer
Research Officer
Department of Civil Engineering Department of Civil Engineering Faculty of Engineering - Mataram University Faculty of Engineering - Mataram University
Jl. Majapahit 62 Mataram Jl. Majapahit 62 Mataram West Nusa Tenggara – INDONESIA
West Nusa Tenggara – INDONESIA E-mail: [email protected] E-mail: [email protected]
Abstract
Soil embankment dams have been built surrounding the Lusi Mud Volcano in Sidoarjo, East Java, to keep hot mud within the ponds since May 2006. The dams have been made of soil materials sitting on poor weak grounds. A finite element method (FEM) was applied for modelling the displacements of the embankment dams. Results show that the dam displacements in both vertical and horizontal directions were high in static and dynamic state conditions. The final design of the dams had a total displacement of about 1.3-1.9 m in both static- and dynamic-state conditions.
Key Words: displacement, model, embankment dam, weak ground.
INTRODUCTION
Since the beginning of the eruption in May 2006, embankment dams have been built surrounding the Lusi mud volcano in Sidoarjo, East Java. The dams were intended to keep hot mud within the ponds. The mud flow from the Lusi mud volcano has covered an area of 6.3 km2 (Mazzini, et al., 2007). The embankment dams were constructed from pebble-soil materials sitting on weak clay and silt grounds. The dams are also gaining pressures from mud filling the ponds (Agustawijaya and Sukandi, 2012).
Agustawijaya and Sukandi (2012) analysed the stability of the Lusi embankment dams, and reported that the dams prone to instability to ground subsidence and mud pressures. In particular, the dam point P.10D has failed several times during the period of 2009-2012 (Agustawijaya and Sukandi, 2012). In this analysis, the phi-c reduction concept was applied that resulted in a factor of safety of 1.1 (Agustawijaya and Sukandi, 2012).
The phi-c reduction concept applies procedures that automatically reduce the soil strength parameters, c' and ', until the soil fails (Chang and Huang, 2005; Griffieths and and Lane, 1999). In these procedures, assumptions are not required anymore for determining the position of the failure plane of the soil, so the failure plane will be established naturally on the zone that the soil strength could not resist the mobilised shear stresses (Chang and Huang, 2005; Zheng, et al., 2006). The safety factor is, therefore, estimated, as follows (Chang and Huang, 2005):
c' = available effective cohesion c'f = effective cohesion at failure ϕ' = available effective friction ϕ'f = effective friction at failure
METHOD
The stability analysis in this paper has applied the finite element method of the Plaxis package. The goals of the analysis are to predict the failure modes and to model the displacement of the dams due to soft grounds. The finite element method of the Plaxis software package (Brinkgreve, 2007) applies the two-dimensional plain strain concept (Zienkiwicz, 1997), since the concept is suitable to the dam configuration that the z-axis, parallel to the dam z-axis, is assumed to be longer than the cross-x and vertical-y axes in the three Cartesian-coordinates (Agustawijaya and Sukandi, 2012).
The Mohr-Coulomb failure concept is then applied. This concept is an elasto-plastic model representing stresses causing strains until yield in elastic conditions; subsequently, plastic behaviour after yielding is due to the increase of strains (Ugai, 1989). Parameters applied in this modelling are elasticity modulus (E), Poisson’s ratio (ν), effective cohesion (c'), and effective friction (φ').
RESULT AND DISCUSSION
The Embankment Dam Design
The locations of the dams for the analysis were the dam point P.80-81 and P.89-90. The dam points were located at the north-east side of the carter, as can been in Figure 1.
Figure 1 The dam points P.80-81 and P.83-89
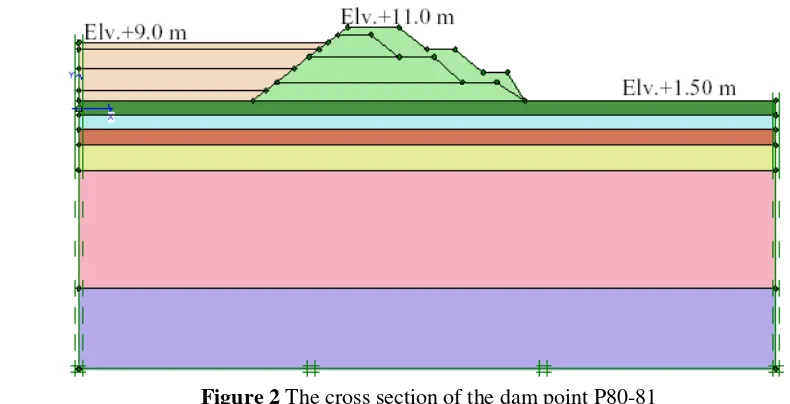
The construction of the embankment dams was conducted in four stages, as can be seen in Figure 2. The original design was constructed with the dam crown and mud levels of +5.0 m and +1.2 m from the mean sea level (MSL), respectively, for holding the mud temporally within the ponds.
As the mud volume exceeded the capacity of the ponds, the dams were then rebuilt for the second stage. The elevation of the dams was consequently increased in each subsequent stage, reaching the level of +11.0 m from the MSL in the final design. The geotechnical parameters of soil materials, mud and grounds can be seen in Table 1 and 2.
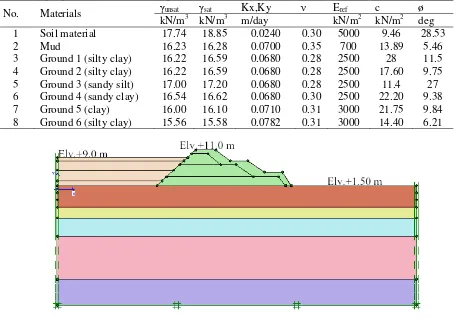
Tabel 1 Input parameters for the dam point P.80-81
No. Materials unsat sat Kx,Ky Eref c ø
kN/m3 kN/m3 m/day kN/m2 kN/m2 deg 1 Soil material 17.74 18.85 0.0240 0.30 5000 9.46 28.53
2 Mud 16.23 16.28 0.0700 0.35 700 13.89 5.46
3 Ground 1 (silty clay) 16.22 16.59 0.0680 0.28 2500 28 11.5 4 Ground 2 (silty clay) 16.22 16.59 0.0680 0.28 2500 17.60 9.75 5 Ground 3 (sandy silt) 17.00 17.20 0.0680 0.28 2500 11.4 27 6 Ground 4 (sandy clay) 16.54 16.62 0.0680 0.30 2500 22.20 9.38 7 Ground 5 (clay) 16.00 16.10 0.0710 0.31 3000 21.75 9.84 8 Ground 6 (silty clay) 15.56 15.58 0.0782 0.31 3000 14.40 6.21
Figure 3 The cross section of the dam point P.83-89
Tabel 2 Input parameters for the dam point P.83
No Material unsat sat kx, ky Eref c ø
kN/m3 kN/m3 m/day kN/m2 kN/m2 deg 1 Soil material 17.74 18.85 0.024 0.30 5000 9.46 28.53
2 Mud 16.23 16.28 0.070 0.35 700 13.89 5.46
3 Ground 1 (sandy silt) 16.15 16.32 0.074 0.28 2500 22.50 10.12 4 Ground 2 (silty clay) 16.17 16.48 0.074 0.30 2000 17.10 11.44 5 Ground 3 (sandy silt) 16.00 16.08 0.050 0.30 2000 17.60 8.44 6 Ground 4 (silty clay) 15.82 16.04 0.083 0.28 3000 16.6 7.9 7 Ground 5 (clay) 15.53 15.65 0.011 0.30 3000 17.2 7.5
Displacement of the Dam Point P. 80-81
Figure 4 Vertical displacement of the dam point P.80-81 at the elevations of dam of +11.0 m, of mud and water of +9.0 m from the MSL
Figure 5 Horizontal displacement of the dam point P.80-81 at the elevations of dam of +11.0 m, of mud and water of +9.0 m from the MSL
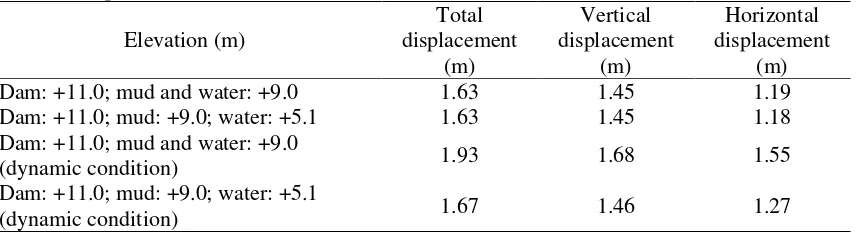
The second model was that the elevation of mud was +9.0 m and the elevation of water was +5.1 m, which means that the surface of the mud was dry. The displacements reduced slightly in both vertical and
horizontal directions, although the total displacement was very much similar between the first model and second model (Table 3). However, when the dynamic state condition was introduced into the model, the displacement behavior was different, that the second model had displacement values lower than that of the first model for about 13%.
Table 3 Displacements of the dam Point P.80-81
Elevation (m)
Total displacement
(m)
Vertical displacement
(m)
Horizontal displacement
(m)
Dam: +11.0; mud and water: +9.0 1.63 1.45 1.19
Dam: +11.0; mud: +9.0; water: +5.1 1.63 1.45 1.18
Dam: +11.0; mud and water: +9.0
(dynamic condition) 1.93 1.68 1.55
Dam: +11.0; mud: +9.0; water: +5.1
Displacement of the Dam point P.89
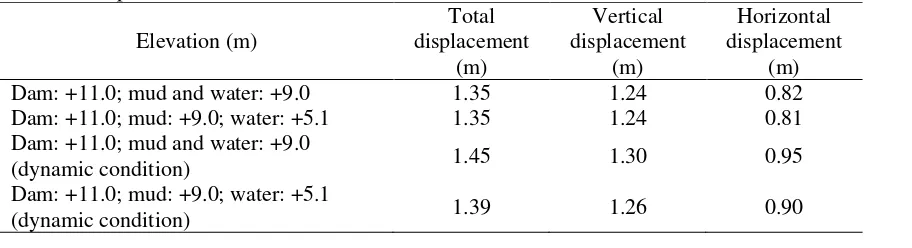
The displacement behavior of the dam point P.89-90 was different from that of the dam point P.80-81. The whole body of the dam and the ground seems to displace entirely. The whole body of the dam displaced vertically from the crest down to the ground. Interestingly, the deep ground moved in the horizontal direction from the inner to the outer direction of the dam. But, the total displacement value was lower than that of the dam point P.80-81, only about 1.3 m (Table 4). The behavior the displacement in the dynamic state condition was similar to that in the static state condition.
Figure 6 Vertical displacement of the dam point P.83-89 at the elevations of dam of +11.0 m, of mud and water of +9.0 m from the MSL
Figure 7 Horizontal displacement of the dam point P.83-89 at the elevations of dam of +11.0 m, of mud and water of +9.0 m from the MSL
When the level of water was reduced in the second model to be +5.1 m from the MSL, the displacement was not significantly affected. Therefore, the displacement behavior of the dam point P.89-90 was influenced significantly by the ground condition that was weak clay.
Table 4 Displacements of the dam Point P.80-81
Elevation (m)
Total displacement
(m)
Vertical displacement
(m)
Horizontal displacement
(m)
Dam: +11.0; mud and water: +9.0 1.35 1.24 0.82
Dam: +11.0; mud: +9.0; water: +5.1 1.35 1.24 0.81
Dam: +11.0; mud and water: +9.0
(dynamic condition) 1.45 1.30 0.95
Dam: +11.0; mud: +9.0; water: +5.1
CONCLUSION
For both dam points, P.80-81 and P.83-89, the displacements seem to be the major problem to the stability of the dams, as the whole body of the dams and the grounds displaced in horizontal and vertical directions. The water level significantly played an important role in the displacement behavior in conjunction with weak ground made of clay materials. Thus, the level of water within the ponds should be reduced in order to provide more stability to the dams.
ACKNOWLEDGEMENT
The Authors acknowledge supports provided by the BPLS of Indonesia (Sidoarjo Mud Agency) during the field survey.
REFERENCES
Agustawijaya, D. S. and Sukandi. 2012. The stability analysis of the Lusi mud volcano embankment dams using FEM with a special reference to the dam point P10.D. Civil Engineering Dimension, Vol. 14 No. 2, pp.100-109.
Brinkgreve, R. B. J. 2007. Plaxis 2D, V8, The Netherlands: Delft University of Technology & Plaxis b.v. Delft.
Chang, Y. L. and Huang, T. K. 2005. Slope Stability Analysis Using Strength Reduction Technique.
Journal of the Chinese Institute of Engineers, 28(2), pp.231-240.
Griffieths, D. V. and Lane, P. A. 1999. Slope Stability Analysis by Finite Elements, Geotechnique, 49(3), pp.387-403.
Mazzini, A., Svensen, N. H., Akhmanov, G.G., Aloisi, G., Planke, S., Malthe-Sørenssen , A., Istadi, B. 2007. Triggering and Dynamic Evolution of the Lusi Mud Volcano, Indonesia. Earth and Planetary Science Letters, 261, pp. 375–388.
Ugai, K., 1989. A Method of Calculation of Total Factor of Safety of Slopes by Elasto-Plastic FEM, Soils and Foundations, 29( 2), pp.190-195.
Zheng, H, Tham, L. G., Liu, D. 2006. On Two Definitions of The Factor of Safety Commonly Used in The Finite Element Slope Stability Analysis. Computers and Geotechnics, 33, pp.188-195.