DOI: 10.12928/TELKOMNIKA.v14i1.2668 119
Carrier Aggregation Technique to Improve Capacity in
LTE-Advanced Network
Iskandar*, R. Galih
School of Electrical Engineering and Informatics, Bandung Institute of Technology, Jalan Ganesha No. 10, Bandung 40132, INDONESIA
*Corresponding author, e-mail: [email protected]
Abstract
Carrier aggregation (CA) is a major feature in LTE-advanced technology that allows network provider to use more than one carrier simultaneously to increase capacity. CA uses two or more individual component carriers (CCs) of the same (intra-band) and different (inter-band) frequency bands. In this paper, we evaluate CA techniques with the test parameter using BLER and throughput inside the tested area of LTE network. The tested area is designed to represent most common environment in which LTE will be deployed. We use 30 MHz frequency bandwidth in the simulation to evaluate intra-band and inter-band CA technique performance. Two CCs is allocated for primary serving cell (PCell) and secondary serving cell (SCell). Simulation result shows for the downlink, BLER tend to increase, as the frequency configuration is increase. However, for the uplink BLER is zero. We found that for CA configuration with wider PCell bandwidth resulting better throughput. In CA intra-band, the throughput of non-contiguous CA is better than CA contiguous. Then in the inter-band CA, CC combination with a lower frequency produces higher throughput.
Keywords: Long Term Evolution (LTE) Advanced, carrier aggregation, BLER, throughput
Copyright © 2016 Universitas Ahmad Dahlan. All rights reserved.
1. Introduction
Long Term Evolution (LTE) Release 8 has been the primary broadband technologies which attracting much the attention in cellular communication [1]. With current peak data rates achieved in LTE Release 8, researches of further enhancements have been carried out to increase data rates in LTE Release 8. It is targeted in IMT-A requirements that the peak data rate can be 1 Gbps for uplink and 500 Mbps for downlink. These enhancements have been considered in 3GPP as a part of LTE-advanced (LTE-A) and also known as LTE Release 10 specifications [2-4].
LTE-A requirements have been addressed by the 3rd Generation Partnership Project (3GPP) and the standardization body behind LTE as the part of its Release 10. In LTE-A, there are set of features. Carrier aggregation (CA) is one of the most demanded features in LTE-A [5]-[6]. It has maximum five component carriers (CCs) of 20 MHz bandwidth that can be assigned to the user equipment (UE) to achieve a total transmission bandwidth of up to 100 MHz. CA is then called as a way to combine multiple component carriers (CCs) to have scalable bandwidth expansion. This carrier combination is not only configured in the same (contiguous) frequency but also in different (non-contiguous) frequency bands. Generally, this scheme is able to provide maximum flexibility in utilizing the scarcity of radio resources.
of the CA. In addition to the frequency combination, it will also be observed throughput based on combination of primary and secondary component carrier bandwidth. This study is based on the access network planning case study in typical urban environment by using computer simulation. LTE radio network planning with different propagation model and the technique to improve its quality using joint detection technique for the next wireless communication technologies have been investigated in [7]-[8]. In this contribution, we begin with the designing LTE-A coverage in particular area and then simulate the CA techniques in that area to find the best CA performance so that the result would be used by the operator in optimizing their spectrum.
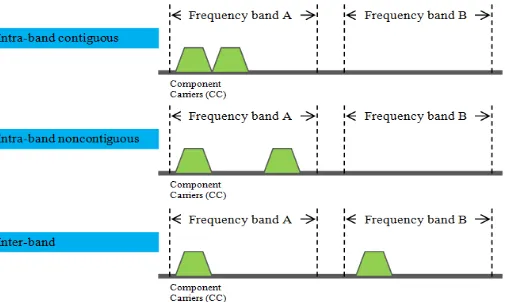
Figure 1. LTE-A carrier aggregation technique
The rest of the paper is as follow. Section 2 provides an overview of different types of CA. Section 3 outlines an LTE-advanced network planning simulation with the main focus on the considerations in urban environment as the simulated area. Results and analysis are presented in Section 4. Finally, some conclusions are drawn in Section 5.
2. Carrier Aggregation Techniques
Today in most of the country, there are almost none of a cellular service provider owns continuous spectrum of 100 MHz. This because of the spectrum scarcity and the number of service provider relatively many in a country. Therefore, it emerges the new method called CA technique [9-10]. There are three different modes of CA, namely band contiguous, intra-band non-contiguous, and inter-intra-band CA [14-18]. 3GPP’s radio access network (RAN) working group 4 (RAN 4) is responsible for setting performance requirements of CA technique which initially limits the aggregation up to two component carriers only. With this method, one UE is able to consume up to 100 MHz spectrum bandwidth in total.
In CA technique each carrier or channel, which is aggregated, is called component carriers (CCs). Each CCs might have bandwidth of 1.4, 3, 5, 10 or 20 MHz. The maximum number of channels that can be aggregated is five, so the maximum amount of bandwidth that can be used is 100 MHz. The number of aggregated carriers can different between downlink and uplink, but the number of uplink CCs never more than CCs downlinks [6]. Each CCs can also have different bandwidth. The CA technique is a way of how to aggregate some of the CCs. As shown in Figure 1, three techniques or types of CA on LTE-A are described and can be explain as follows:
a) Intra-band contiguous CA: the method using two or more channels in one frequency band sequentially.
b) Intra-band non-contiguous CA: the method to aggregating channels within a single frequency band, but there is a distance between CC’s.
c) Inter-band non-contiguous CA: the method to aggregating different bands of frequency channels, it is useful if there is fragmentation band.
Component Carrier (PCC) downlink and uplink and handle the Radio Resource Control (RRC) connection, SCell have the task to bring the Secondary Component Carrier (SCC). There is only one PCC in the CA system, but the SCC could be more than one. Coverage of PCell and SCell may vary depending on the frequency it is being used.
In this paper, we assume that there are several LTE-A network scenarios with FDD duplexing schemes. Two CCs and the amount of aggregated bandwidth on each CA configuration is 30 MHz. We use frequency combination that follows some CA configurations determined by 3GPP release 10, 11, and 12, i.e. 3GPP E-UTRA Carrier Aggregation (TS.36.101). They are summarized in Table 1, Table 2, and Table 3, respectively [7].
Table 1. CA Intra-Band Contiguous Configuration Scenarios
Name CA Configuration E-UTRA Band Band Name CC Bandwidth (MHz) PCell SCell
A1 3C 3 1800 + 15 15
A2 3C 3 1800 + 10 20
A3 3C 3 1800 + 20 10
Table 2. CA Intra-Band Non-Contiguous Configuration Scenarios.
Name CA Configuration E-UTRA Band Band Name CC Bandwidth (MHz) Space (MHz) PCell SCell
B1 3A - 3A 3 1800 + 15 15 15
B2 3A - 3A 3 1800 + 10 20 20
B3 3A - 3A 3 1800 + 20 10 20
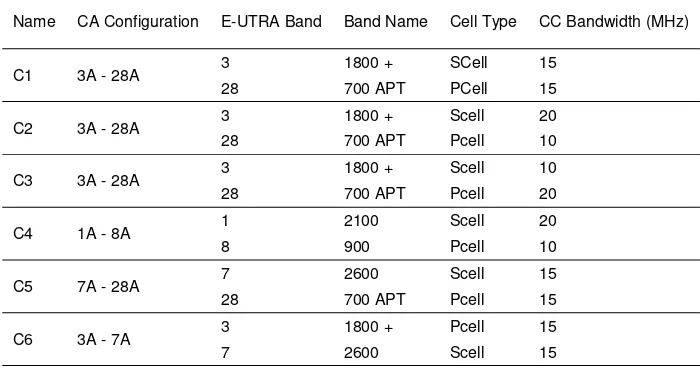
Table 3. CA Inter-Band Non-Contiguous Configuration Scenarios.
Name CA Configuration E-UTRA Band Band Name Cell Type CC Bandwidth (MHz)
C1 3A - 28A 3 1800 + SCell 15
28 700 APT PCell 15
C2 3A - 28A 3 1800 + Scell 20
28 700 APT Pcell 10
C3 3A - 28A 3 1800 + Scell 10
28 700 APT Pcell 20
C4 1A - 8A 1 2100 Scell 20
8 900 Pcell 10
C5 7A - 28A 7 2600 Scell 15
28 700 APT Pcell 15
C6 3A - 7A 3 1800 + Pcell 15
7 2600 Scell 15
3. LTE-A Network Planning Simulation
of site required to cover the tested simulated area. Receiver sensitivity is calculated by using the following equation.
x xN
NF SINRSR 17410log 15.000 12 rb (1)
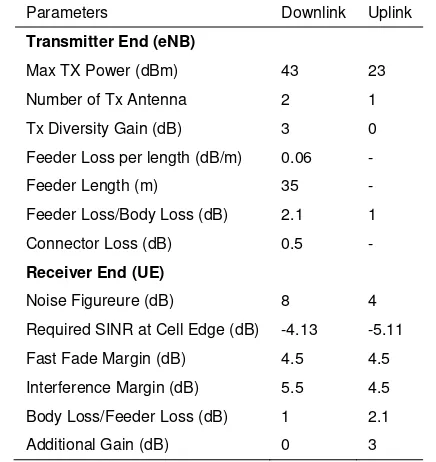
Table 4. Tx-Rx Parameters Used in Coverage Dimensioning
Parameters Downlink Uplink
Transmitter End (eNB)
Max TX Power (dBm) 43 23
Number of Tx Antenna 2 1
Tx Diversity Gain (dB) 3 0
Feeder Loss per length (dB/m) 0.06 -
Feeder Length (m) 35 -
Feeder Loss/Body Loss (dB) 2.1 1
Connector Loss (dB) 0.5 -
Receiver End (UE)
Noise Figureure (dB) 8 4
Required SINR at Cell Edge (dB) -4.13 -5.11
Fast Fade Margin (dB) 4.5 4.5
Interference Margin (dB) 5.5 4.5
Body Loss/Feeder Loss (dB) 1 2.1
Additional Gain (dB) 0 3
Table 5. Propagation Parameters Used in Coverage Dimensioning
Parameters Type of Area
Urban Suburban
eNB antenna height (m) 30 30
UE antenna height (m) 1.5 1.5
Cell Edge Probability 75% 75%
Outdoor Standard Deviation Shadowing 7 7
UE antenna correction factor (dB) 0 0.01
Clutter correction (dB) 0 -9.3
Area size (km2) 104.84 62.83
Table 6. Number of eNB based on coverage dimensioning..
Parameter Formulation Area Type
Urban Suburban
Number sector per site 3 3
Cell/eNB coverage area [km2] Lsite = 1.95 * (d 2
)
d: cell diameter 2.96 9.99 Simulated coverage area [km2] Lr 104.84 62.83
Simulated number of eNB per area type N = Lr / sector number 36 7
Total simulated number of eNB 43
R
Where PT denotes eNB power transmit, GT is transmit antenna gain, GR is receive antenna gain, Ls denotes an interference margin, and SR denotes receiver sensitivity. MAPL minimum of all scenarios will be converted into cell radius using Okumura-Hatta propagation model provided by (4). Propagation parameters for calculation of the cell radius are shown in Table 5.
f
h a h
h
ddB
PL( )69.5526.16log c 13.82log te re 44.96.55log te log (4)
Where fc denotes carrier frequency used in LTE, hte denotes eNB antenna height, hre denotes user antenna height, and d is the cell radius. For analytical purpose we assume a hexagon cell shape which is comprised of 3 sectors, therefore eNB cell area can be calculated by (5).
2 295 1 xd
km
Lsite . (5)
And the number of calculated eNB is:
site
By using all those parameters and Equation (1) to (6), we are able to calculate the required number of total site (eNB) in the tested area as summarized in Table 6. Up to this step, we have done the coverage planning in the tested area so that the number of eNB within the specified parameter complies to LTE technical specification has been derived and described in Figure 2. The calculated number of eNB based upon the above assumption is 45. Then we deploy those eNB throughout the tested area in the simulation environment. Each eNB is installed 3 sector antenna to improve capacity and at the same time reduce co-channel interference. The next step of network planning is to evaluate the capacity dimensioning in the tested area.
3.1. Capacity Dimensioning
In the capacity planning process, we have assumed that LTE subscribers are predicted for the next 5 years. Therefore, the network throughput and cell throughput are determined.
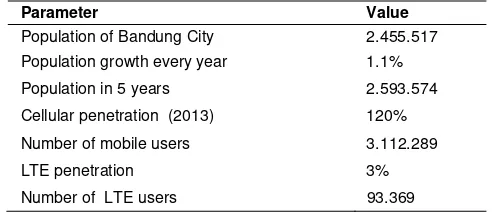
Table 7. Number of Subscriber based upon the Prediction
Parameter Value Population of Bandung City 2.455.517
Population growth every year 1.1%
Population in 5 years 2.593.574
Cellular penetration (2013) 120%
Number of mobile users 3.112.289
LTE penetration 3%
Number of LTE users 93.369
Table 8. Number of eNB Based on Capacity Planning
Item Urban Suburban
DL UL DL UL
Network throughput (Kbit) 261,640.67 1,000,935.77 65,348.26 232,005.3
Cell average throughput 54,399.95 65,279.95 54,399.95 65,279.95
Cell Number 5 16 2 4
Total number of eNB 8
Figure 2. eNB position on a digital map of a tested area
Using this predicted traffic calculation. The data which are needed include population data obtained from statistical municipal city office [9], the population growth in the city is assumed to be 1.1% per year [10], mobile penetration is 120% [11], LTE penetration is assumed to be 3%, and the percentage of subscribers belong to particular provider is 42.1%. The predicted number of LTE subscribers of the particular provider is shown in Table 7. The values of traffic model parameters are determined based upon the development services from the data [12]. For the amount of aggregated bandwidth of 30 MHz and the number of users listed in Table 7, the value of network throughput and cell throughput as well as the calculation of the number of eNB can be seen in Table 8, while the number of required eNB in the network is calculated using Equation (7) and (8) respectively.
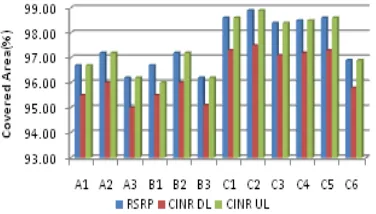
Figure 3. Percentage of covered area by RSRP and CINR of whole scenarios.
hput
In the network design process, the total site number is determined from the highest number of coverage or capacity dimensioning in order to meet both aspect. In the process of laying site, the result takes 46 eNB to cover the entire city of the tested area which can be seen in Figure 2. Each site has three sectors, and each sector consists of two transmitters with the same azimuth, one transmitter for PCell and the other for Scell. To examine the network throughput and the network BLER in the tested area, we have to know RSRP and CINR inside the tested area.
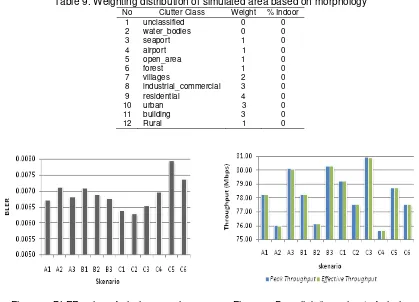
Table 9. Weighting distribution of simulated area based on morphology No Clutter Class Weight % Indoor
8 industrial_commercial 3 0
9 residential 4 0
10 urban 3 0
11 building 3 0
12 Rural 1 0
Figure 5. BLER value of whole scenarios Figure 6. Downlink throughput of whole scenarios
4. Simulation Results and Analysis 4.1. RSRP and CINR Coverage
meets the target and therefore we are able to used this area as the simulated area to determine the throughput and BLER value of the implementation of CA techniques in LTE-Advanced networks.
Figure 7. Uplink throughput of whole scenarios
Figure 8. Downlink throughput based on bandwidth PCell dan Scell
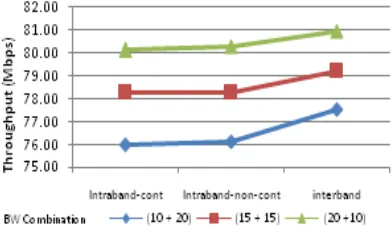
Figure 9. Downlink throughput based on CA type
4.2. BLER and Throughput
Now we are evaluating the network throughput and BLER use Monte-Carlo simulation method, which its results closer to reality because this method generate users based on the data traffic. The user follows the distribution of traffic maps as shown in Figure 4, and the weight to be considered according to the Poisson distribution is calculated by weighting distribution in Table 9 [13]. Simulations performed 5 times for each scenario with the number of iterations in simulations is up to 100 times. The results of the throughput and BLER of all the simulation will be averaged.
The results of Monte Carlo simulations for downlink BLER values shown in Figure 8. For the uplink, BLER value is zero for all scenarios, so that the uplink effective throughput is not different from the peak throughput. In the downlink side there is a transmission error which has value ranges from 0.6% to 0.7%. In the intra-band CA only uses the 1800 MHz frequency downlink and 459.61 kbps for uplink. While the average increases of combination 15 MHz + 15 MHz to 20 MHz + 20 MHz is 1.87 Mbps on the downlink and 539.3 kbps on the uplink. So, an increase in throughput of PCell bandwidth 10 MHz to 20 MHz in the downlink can reach 3.88 Mbps, and 998.9 kbps on the uplink.
According to Okumura-Hatta propagation model in Equation (3), the lower frequencies will have a smaller pathloss, so that at the same distance from the transmitter, it would produce a better radio channel condition for the user. The better condition of the channel and the greater SINR and efficiency bearer will result higher throughput. Scenario C1 and C5 both use frequencies of 700 MHz, but the frequency of 1800 MHz C5 replaced with a higher (2600 MHz). As a result, the throughput decreased 0.59 Mbps, from 79.24 Mbps to 78.75 Mbps on the downlink and 0.76 Mbps on the uplink. Furthermore, in scenario C6, the frequency of 700 MHz C1 scenario changed to 2600 MHz. The decrease in throughput from C1 to C6 is greater than C1 to C5, which is 1.68 Mbps on the downlink and 1.39 Mbps on the uplink. Throughput of inter-band CA scenario C6 even lower 0.72 Mbps from intra-inter-band with the same inter-bandwidth combinations, those are scenario A1 and B1 which only uses the 1800 MHz frequency band.
In PCell and SCell bandwidth combination 10 MHz + 20 MHz, there is a scenario C2 (700 MHz and 1800 MHz) and C4 (900 MHz and 2100 MHz), wich have throughput respectively 77.56 Mbps and 75.64 Mbps for downlink, and 53.03 and 51.09 for the uplink. Just like the combination of bandwidth 15 MHz + 15 MHz, this time the scenario that uses lower frequencies, ie C2, resulting better throughput than the scenario C4 that uses higher frequencies. The difference in throughput of these two scenarios on the downlink direction reaches 1.92 Mbps, and uplink up to 1.08 Mbps.
5. Conclusion
Based on the LTE network access design in this study, we can conclude several things. First, the BLER on uplink is zero for all scenarios, while the downlink BLER is 0.63 % to 0.79 %, the downlink BLER is greater for the higher frequency configuration. For throughput from the network simulation, CA configuration with wider PCell bandwidth result better throughput. Then, based on type of CA in the intra-band, the throughput non-contiguous CA is better than contiguous CA. And the last, in the inter-band CA, CC combination with a lower frequency produces higher throughput. CA configuration that produces the highest throughput in the design area the city is inter-band non-contiguous CA with the combination of 700 MHz and 1800 MHz, and the bandwidth combination of the primary and secondary serving cell 20MHz + 10MHz, the throughput is 80.95 Mbps on the downlink and 53.83 Mbps on the uplink.
References
[1] LTE for UMTS - Evolution to LTE-Advanced. John Wiley & Sons, Ltd. 2011.
[2] A Ghosh, R Ratasuk, B Mondal, N Mangalvedhe, T Thomas. LTE-advanced: next-generation
wireless broadband technology. IEEE Wireless Communications. 2010; 17(3): 1536-1284.
[3] D Erik, S Parkvall, J Sköld. 4G LTE/LTE-Advanced for Mobile Broadband. Oxford: Elsevier. 2011.
[4] L Haeyoung, S Vahid, K Moessner. A Survey of Radio Resource Management for Spectrum
Aggregation in LTE-Advanced. Communications Surveys & Tutorials. 2014; 16(2): 745-760.
[5] Al-Shibly, MAM Habaebi, MH Chebil J, Carrier aggregation in Long Term Evolution-Advanced. In
Proceeding of IEEE Control and System Graduate Research Colloquium (ICSGRC). 2012: 154-159.
[6] Hua Wang, C Rosa, K Pedersen. Performance Analysis of Downlink Inter-Band Carrier Aggregation
in LTE-Advanced. In Proceedings of IEEE Vehicular Technology Conference (VTC Fall). 2011: 1-5. [7] Rekawt Sabir Hassan, TA Rahman, AY Abdulrahman. LTE Coverage Network Planning and
Comparison with Different Propagation Models. Journal Telkomnika. 2014; 12(1).
[8] Hendra Setiawan, Firdaus. The Most Possible Scheme of Joint Service Detection for the Next
Wireless Communication Technologies. Journal Telkomnika. 2013; 11(1).
[9] Central agency statistics of Bandung City: http://www.bandungkota.bps.go.id/
[10] Denny Kusuma Hendraningrat, et al. Refarming of Frequency 700 MHz Analysis for Long Term
Evoltion (LTE) in Indonesia Using Link Budget Calculation. In the proceeding of International Conference on Electrical Engineering and Informatics (IJEEI 2011). 2011: 1-6.
[11] Indonesian association of Internet service providers:
http://www.apjii.or.id/v2/index.php/read/page/halaman-data/9/statistik.htm.
[12] ETSI TS 136 101, v10.3.0. LTE, E-UTRA, and UE Radio Transmission and Reception Technical Specification. 2011.
[13] Weihong Fu, Qingliang Kong, Yue Zhang, Xin Yan. A resource scheduling algorithm based on carrier
[14] Ran Zhang, Zhongming Zheng, Miao Wang, Xuemin Shen, Liang-Liang Xie. Equivalent capacity analysis of LTE-Advanced systems with carrier aggregation. In Proceedings of IEEE ICC Conference. 2013: 6118-6122.
[15] DP Sharma, S Gautam. Distributed and Prioritised Scheduling to Implement Carrier Aggregation in
LTE Advanced Systems. In Proceedings of 4th International Conference on IEEE Advanced Computing & Communication Technologies (ACCT). 2014: 390-393.
[16] Na Lei, Caili Guo, Chunyan Feng, Yu Chen. A multi-user MIMO resource scheduling scheme for
carrier aggregation scenario. In Proceedings of International Conference on Wireless Communications and Signal Processing (WCSP). 2011: 1-5.
[17] Yonis AZ, Abdullah MFL. Simulation of novel non-adjacent component carriers in LTE-Advanced. In
Proceedings of International Conference on Electronics Design, Systems and Applications (ICEDSA). 2012: 254-259.
[18] Shajaiah H, Abdel-Hadi A, Clancy C. Utility Proportional Fairness Resource Allocation with Carrier