Implementing Aproiri Algorithm
for Predicting Result Analysis
Azwa Abdul Aziz, Julaily Aida Jusoh, Wan Mohd Rizhan Wan Idris, Hasni Hassan
Faculty of Informatics
University Sultan ZainalAbidin (UniSZA) 20300 Kuala Terengganu, Terengganu, Malaysia
{azwaaziz, julaily, wmrizhan, hasni}@unisza.edu.my}
Nurul A. Emran,
Faculty of Information and Communication Technology, Universiti Teknikal Malaysia Melaka, Hang Tuah Jaya, 76100, Durian Tunggal, Malaysia
Abstract—University or Higher Learning Institution is a platform to train students in specific domain area that will become an asset for a country. One of the critical issues in University is to avoid dropout students. Educational Data Mining (EDM) is an emergent discipline in developing methods to explore the unique types of data from the educational context. One of the techniques applied in EDM is an Association Rules (AR) which is to find a pattern of one element influencing other element. In this paper, AR technique has been utilized to predict students’ results based on a group of the previous students results. Clustering method has been used to classify the specific subject category. Finally, a system known as Result Prediction System (REPS) has been developed to perform automatically the AR analysis on the academic data using PHP and MYSQL databases.
Index Terms—Apriori Algorithm, Association Rules, Educational Data Mining, Educational Intelligence, Result Predicting System (REPS)
I. INTRODUCTION
ne of the biggest challenges that higher education faces today is predicting the students’ academic paths [15]. Another factor is the inability to identify the strengths and weaknesses of students. These two factors typically lead to the issue of dropout students in the academic institution. However, it is a critical issue when the students are fails to complete their studies. It is not only about a cost waste but more importantly we lose the talents that are useful to support country development. Data mining is a process of automatically discovering useful information in large data repositories [17]. It is an integral part of knowledge discovery in databases to perform predictive and descriptive tasks. Implementing data mining algorithm on educational data always refer to Educational Data Mining (EDM).
Most processes in universities nowadays utilize computerized systems including Learning Management System (LMS). The data mining in the educational area can be achieved by utilizing a large amount of students’ data contained in the academic repositories. An early prediction system has been proposed for classifying the students’
patterns and behaviors in the academic area using the existing students’ data. Its objective is to identify the academic potential of students based on their results.
II. RESEARCH BACKGROUND
Apriori algorithm is a classical algorithm for learning association rules (ARs) [18]. It has become one of a major algorithm in data mining research in order to find a pattern of an element that influences other elements. It is used to discover the multiple independent elements that co-occur frequently and to discover the rules that relate to the co-occurred elements in a given dataset [1]. It is also typically used in the transaction databases for understanding the correlation between various items and/or events. The goal of the technique is to detect the relationships or associations between the specific values of categorical variables in large data sets. This is a common task in many data mining projects and subcategory text mining. These powerful exploratory techniques have a wide range of applications in many areas of business practice and also research from the analysis of consumer preferences or human resource management to the history of language.
A well-known application that utilizes the ARs is market basket analysis. A market basket contains the customers’ purchasing transactions. It is a collection of items or item sets, which are purchased by a customer in a single transaction. As the number of customer transactions is usually very large and frequent item sets are exponential to the number of different items, ARs can be used to examine as many frequent item sets as possible. Question like what products tend to be purchased together can be answered. Therefore, the purpose of utilizing ARs is to reduce a large amount of information to a small and more understandable set of statistically supported statements [2]. For example, the customers who buy product A will also buy product B with 81.25% probability. On the other hand, the customers who buy product B will also buy product A with 65% probability.
ARs are widely used in the business analysis. However, recent researches have shown ARs are not only useful for predicting business perceptive but also in other areas such as
O
Medical, Crime Pattern, Network Analysis, Disaster Analysis, Security and many more. ARs also become one of the techniques applied in EDM for understanding the students’ behaviors. Several researchers have applied ARs EDM to obtain the pattern of educational data such as Merceron & Yasef [5] who have used ARs to analyze learning data. They have also conducted the case study of educational data mining for Logic-ITA student data [6]. Hong & Zhang [7] has identified the behavior patterns of ninety eight undergraduate students in business course in Taiwan through the online learning processes. EDM is an application of the data mining techniques to be implemented in the area of education for obtaining better comprehension of the students’ learning processes and acknowledging the ways they participate in it, in order to improve the quality of the educational system [4].
Rules have the following form: X→Y, support 40%,
confidence 66%, which could mean 'if students get A for subjectit will also get A for another subject‘', with a support of 40% and a confidence of 66%. Support means the frequency in the population of individuals that contains both
X and Y. Confidence is the percentage of the instances that contains Y amongst those which contain X.
The general concept of ARs is followed:
Let I = {I1, , I2, ...,Ip} be a set of p items and T = {t1, , t2,
...,tn}be a set of n transactions, with each tibeing a subset of
I. An association rule is a rule of the form X→Y, where X
and Y are disjoint subsets of I having a support and a confidence above a minimum threshold [5].
Let us denote by |X , Y| the number of transactions that contain both X and Y. The support of that rule is the proportion of transactions that contain both X and Y:
sup(X→Y) = |X , Y| / n. This is also called P(X, Y), the probability that a transaction contains both X and Y. Note that the support is symmetric: sup(X→Y) = sup(Y→X).
Let us denote by |X| the number of transactions that contain X. The confidence of a rule X→Y is the proportion of transactions that contain Y among the transactions that contain X: conf(X→Y) = פX , Yפ/ פXפ. An equivalent definition is: conf(X→Y) = P(X,Y) / P(X), with P(X) = |X| / n.
In our research, ARs technique has been applied to predict students’ results based on a group of previous students result. The analysis is carried out by clustering the subject based on its own unique specific criteria. As an example, for the students of Diploma in Information Technology, their results have been classified into several main fields of computer science (programming, multimedia, database, network, etc.). A system known as Student Prediction System is developed to run the algorithm. The results of two batch diploma students in Faculty of Informatics, Universiti Sultan Zainal Abidin (UniSZA) have been taken for the testing in this system.
III. RELATED RESEARCH
Prior researches in ARs have been focused on market analysis to find the items that have correlations between one to the others. It is important for determining the strategy to predict customers’ needs. Bala [8] has studied a negative AR using 8,418 sales transactions for 45 grocery items was
collected from various retail outlets. A relation between each item has been figured out using negative AR.
Recently, ARs has not only been applied to support Customer Relationship Management (CRM), but it is widely used in other areas. In medical perceptive, Carlos Ordonez [9] has identified the constrained ARs for heart disease prediction while Peinheiro and Kuo [16] has utilized ARs for early detection of live cancer. In this research, they have revealed demographic factors associated with increased incidence of liver cancer and may provide a mechanism for early detection.
ARs are also used to understand a behavior of human specifically to understand criminal behavior. Anna & Christopher [10] have applied fuzzy ARs algorithm in discovering community crime patterns which are consistent across all regions, subsets of regions, and all states. Vincent et. al [11] have performed the incremental mining for temporal ARs in the crime pattern investigation as well. On the other hands, Lee et, al.[12] have tried to find the unknown characteristics of earthquakes using AR mining methods. The global earthquake data occurred since 1973. Tlili & Slimani [13] have executed ARs mining algorithms in the grid computing environment. They try to solve major challenges faced by the developers of distributed data mining algorithm to adjust the load imbalance that occurs during execution.
Researches on ARs in EDM have been increased for a past few years. Mostly however have been used to discover pattern of students based on a data from Learning Management System (LMS) [5][6][7]. Some of analysis have been carried out are to group students’ according to the style of learning, knowing drop-out students’ profile and successful students’ profile and finding the pattern of questions which students fail more frequently.
A framework of fully integrated Educational Intelligence (EI) has been proposed for mining academic data [14]. The framework has utilized the capabilities of Business Intelligence (BI) technology which successfully used in business strategy that helps the top management make a good decision. It is slightly different with BI architecture which comprises two layers rather than three layers in most BI architecture. Fig. 1 shows an EI framework.
Figure1. EI Architecture
Fig. 1. EI Architecture
achievement or to obtain the potential student. One of the rules chosen to perform the predictive analysis is ARs.
IV. METHODOLOGY
To apply ARs in academic data, we have proposed five phases of steps to ensure validity of the research (Fig. 2).
Fig. 2. Research Methodology
The first step is to classify the subject based on the specific area. We cluster Computer Science (CS) subjects into several specific domain areas consisting Programming, Databases, Multimedia, Networking and Software Engineering. Those domain areas are useful to determine the suitable path for students to further specific major studies in CS degrees. It also helps advice them or industrial organization on which job scope appropriated for their skills. Then, is a process to determine subjects that have direct relation (pre-requisite) between one and others. Table 1 shows example of subjects clustering based on domain areas.
TABLEI
SUBJECT CLUSTERING
Subject Area Name Code Semester
Programming
Basic
Programming TKF 1023 1
Advance
Programming TKF 1033 2
Web
Programming TKF 1083 3
Data Structure TKF 1043 3
Object Oriented
Programming TKF 1053 3
Programming TKS 1183 5
Network
Data
Communication TKF 3012 1
Network TKF 3014 2
Network
Programming TKF 3015 3
Engineering TKS 2183 5
IT Project
Management TKS 2193 5
Multimedia Graphic Design TMS 1033 2
Subject Area Name Code Semester
3D Animation TMS 1063 3
Multimedia
Authoring TMS 2083 3
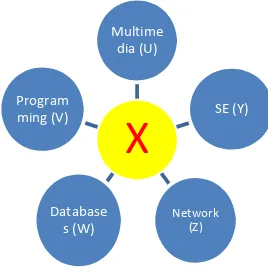
Based on the students’ results, we can classify student into specific knowledge skill and their potentials. Fig. 3 shows knowledge representation of students when they finish their studies. They can be at any categories (U, V, W, Y, and Z) or they are excellent for more than one skill (X).
Fig. 3. Students’ Knowledge Representation
In this paper, we are not focusing on how to classify students based on their skills because it is cover in our paper [14] for EI frameworks. It is more to determine the students results for programming subjects based on results gathered in pre-requisite subjects using ARs techniques. As an example, students will learn subject TKF 1023 in semester 1, some of fundamental topics in TKF 1023 will be used during the next semester in advance topic of programming for subject TKF 1033. The questions arise whether the result in TKF 1023 can influence the result of TKF 1033. A system known as Result Prediction Systems (REPS) is developed to implement AR for the programming subjects.
For experimental testing, data is gained from two different batches of diploma students from Faculty of Informatics, UniSZA. Faculty of Informatics offers two diploma programs, which are Diploma in Multimedia (DTMM) and Diploma in Information Technology (DTM). Students from both programs need to enroll the programming subject as core knowledge of every CS student. It also has pre-requisite to the other programming subjects for the upcoming semester. A problem arises when only a few students get excellent results for the subject. Most of them have marks below than 60, which make its unpopular for students. It can be assumed as a critical problem because programming is essential for CS students to be used as a part of their career later.
Therefore, a detail of analysis needs to be carried out to perform the pattern analysis for the students who get grade A for the subject and how it will influence the next programming subject they need to enroll.
i. To show a descriptive analysis in programming subject.
ii. To study a relation between each programming subject especially for pre-requisite programming subjects. It helps predict the result of new students based on historical result data.
Phase 1 •Subject Classfication
Phase 2
•Data Gathering
•Data Filtering
Phase 3
•Data Availability
Phase 4 •Applying Algortihm
iii. To identify students who consistently get A for programming subject and looking their style of study through interview or questionnaire. iv. To identify students that have low marks in
pre-requisite programming subjects, but get a fine marks later for a programming subjects.
Table 2 shows the example of students’ results.
TABLE II.
EXAMPLE OF STUDENTS RESULTS Student ID TKF 1023(X) TKF 1033(Y)
S001 A A
S002 A B
S003 B A
S004 A A
S005 C A
ARs can be used in finding the relation between the subjects. As an example, to gain confidence and support of possibility students that get A for TKF 1023 (pre-requisite) subject that we also get A for TKF 1033 can be calculated as follow:
To gain support we need to determine grades of A for both subjects. There are 2 students out of 5. It means 40% support. To calculate the score of confidence we need to determine the number of students that contain A in Y. 4 student is getting A for TKF 1033. From these 4 students, only 2 students are gaining A for X parameter. It means to calculate support 2/4*100 are 50%. As conclusion we can make assumption the possibility getting A for TKF 1033 (Y) subject for those getting A in TKF 1023 (X) subject is 40% support and 50% confidence. Those are example of training data that will be used as a benchmark result for testing data (new students taking the course).
V. DATA MINING TOOLS AND RESULT PREDICTING SYSTEM (REPS)
Implementing association rules can be applied to several tools contains in market. One of data mining famous tools is Weka (Waikato Environment for Knowledge Analysis). It is a popular suite of machine learning software written in Java, developed at the University of Waikato, New Zealand. Weka is a free software which is available under the GNU General Public License. The Weka workbench contains of a collection of visualization tools and algorithms for data analysis and predictive modeling, together with graphical user interfaces for easy access to this functionality. Weka supports several standard data mining tasks, more specifically, data preprocessing, clustering, classification, regression, visualization, and feature selection
Another popular open sources data mining tools is RapidMiner. It is an environment for machine learning, data mining, text mining, predictive analytics, and business analytics. For proprietary data mining software, MATLAB (Matrix Laboratory) and Statistical Package for Social Science (SPSS) are most common one. MATLAB is a numerical computing environment and fourth-generation
programming language that allows matrix manipulations, plotting of functions and data, implementation of algorithms, creation of user interfaces, and interfacing with programs written in other languages, including C, C++, Java, and Fortran. SPSS is a software package used for statistical analysis that is own by IBM. Most of statistical data analysis can be carried out using SPSS.
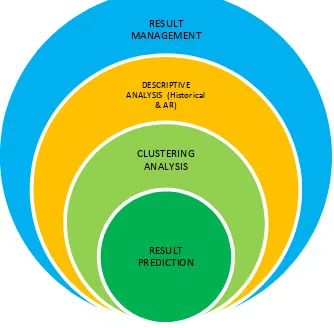
Even though there are several data mining tools offered in market to apply DM algorithm, none of those tools uniquely provides the implementation of Aproiri algorithm. Therefore, in order to deliver a specific product for predicting students’ result using ARs, we have developed Result Prediction System (REPS). REPS is a web based system which is specifically created for lecturers to analyze their students’ performances. The programming language used for the development of REPS is PHP language and MYSQL as its database by utilizing three tier architecture in its framework. In general, there are four main modules in REPS as shown in Fig. 4 from summarized of results to specific students’ results analysis.
Fig. 4. REPS Modules
Fig. 5 shows REPS main pages. REPS is using simple Graphic User Interface (GUI) for non-IT academic staff could utilize REPS for others subjects.
Fig. 5. REPS Main Page
Detail of REPS modules is described below:
A. Result Management
Result Management module is used to enter student information including personal and results data. It is also used to update student’s data. Fig. 6 shows detail of student data gathered from the system.
RESULT
MANAGEMENT
DESCRIPTIVE
ANALYSIS (Historical
& AR)
CLUSTERING
ANALYSIS
RESULT
Fig. 6. Result Detail
B. Analysis
Analysis module is the heart of the system. Analysis is divided into two modules which are historical analysis and ARs analysis. Historical analysis produced the descriptive analysis of subject such as the sum of student based on grade. Fig. 7 shows some result of historical analysis.
Fig. 7. Descriptive Analysis
The second analysis will apply the ARs algorithm to find the pattern of student results. As an example, to discover a pattern of student getting A for consecutive subject (TKF 1033) when they get A for previous subject (TKF 1023). REPS will calculate automatically the result as shown in Fig. 8.
Fig. 8. Descriptive Analysis
REPS can also display a summary of all case of getting A for the next subject based on their results in previous subjects as shown in Fig. 9. As an example, if a student gets B in TKF 1023, what is the confidence and support for them getting A in TKF 1033.
Fig. 9. Generating AR of each Cases
C. Clustering Analysis
Clustering Analysis is a module provided by REPS in order finding the specific association result based on gender analysis. The result can be interpreted as, 'if students is Male and get A for the initial subjectwhat is confident and support to get A for consecutive subject ‘'. It is important to find the difference between male and female students. From the results, we can interpret a result pattern based on gender. Fig. 10 shows the result for clustering analysis.
Fig. 10. Summary of Cluster Analysis
D. Prediction Module
Prediction Module is a module for predicting result of student that have taken initial subject but does not taken consecutive subject. A student enters his/her result and the system will display the ARs analysis based on historical data in the systems. Fig. 11 shows the prediction of result interface.
Fig. 11. Prediction Modules
VI. CONCLUSION
lecturers improve student’s performance by identifying specific skill of particulars students.
VII. ACKNOWLEDGEMENT
The authors would like to thanks to Universiti Sultan Zainal Abidin for financial assistance received during the course of this research. This work has been carried out by using university grants budgets (R1037).
REFERENCES
[1] Agrawal, R., Imielinski, T., & Swami, A. (1993) Mining association rules between sets of items in large databases. In Proceedings of the ACM SIGMOD conference on management of data (pp. 207–216).
[2] Kantardzic, M. (2003). Data mining – Concepts, models, methods, and algorithms. John Wiley & Sons.
[3] Romero, C. and Ventura, S. Educational Data Mining: A Survey from 1995 to 2005, Expert Systems with Applications, 33(1), 135-146 (2007).
[4] Zorrilla, M., Garcia, D., and Alvarez, E.: A Decision Support System to Improve e-Learning Environments, In Proceedings of the 2010 EDBT/ICDT Workshops, DOI: 10.1145/1754239.1754252 (2010). [5] Merceron, A. and Yacef, K.: Interestingness Measures for Association
Rules in Educational Data, 1st International Conference on Educational Data Mining (EDM08), Montreal, Canada (2008).
[6] Merceron, A., and Yacef , K.: Educational Data Mining: A Case Study, Proceedings of Artificial Intelligence in Education (AIED2005), Amsterdam, The Netherlands, IOS Press (2005). [7] Talavera, L., and Gaudioso, E.: Mining Student Data to Characterize
Similar Behavior Groups in Unstructured Collaboration Spaces, In Workshop on artificial intelligence in CSCL. 16th European conference on artificial intelligence,pp. 17–23 (2004).
[8] Bala, P.,K., A Technique for Mining Negative Association Rules, ACM ,January, 2009
[9] Carlos Ordonez, "Improving Heart Disease Prediction Using Constrained Association Rules," Seminar Presentation at University of Tokyo, 2004.
[10] Anna, L.,B. & Christopher, M.,G., Fuzzy Association Rules Mining for Community Crme Pattern Discovery, ISI-KDD 2010, July 25, 2010.
[11] Vincent, N., & Chan., Incremental Mining for Temporal Association Rules for Crime Pattern Discovery, Eighteenth AustralasianDatabase Conference (ADC2007), 2007.
[12] Lee, J. ,A.,Han., J & Chi,K.,H., Mining Quantitative Association Rule of Earthquake Data,ICHIT’09, August 27–29, 2009,
[13] Tlili, R., & Slimani, Y.,Executing Association Rule Mining Algorithms under a Grid Computing Environment, PADTAD 11, July, 2011.
[14] Azwa, A., Wan Rizhan, I.,Hasni, H., & Julaily,J., Intelligent System for Personalizing Students’ Academic Behaviors- A Conceptual Framework, International Journal on New Computer Architectures and Their Applications (IJNCAA) 2(1): 138-153, 2011.
[15] Sahay, A., & Mehta, K., Assisting Higher Education in Assessing, Predicting, and Managing IssuesRelated to Student Success: A Web-based Software using Data Mining andQuality Function Deployment, Academic and Business Research Coneference, Las Vegas, 2010.
[16] Pinheiro, F., & Kuo,M., Poster: Applying Data Mining Algorithms to Early Detection of Liver Cancer,. ICCABS, 2012.
[17] Tan,P.,N., & Steinbach, M., Introduction to Data Mining,Pearson Addition Wesly, 2006.
[18] Rakesh Agrawal, Fast algorithms for mining association rules in large databases, Proceedings of the 20th International Conference on Very Large Data Bases, VLDB, pages 487-499, Santiago, Chile, September 1994.
AUTHORS’ PROFILES:
Azwa Abdul Aziz received the degree of Information Technology from Universiti Teknologi Mara (UiTM) in 2004. He received his Msc. in Computer Science from Universiti Malaysia Terengganu (UMT), Terengganu, Malaysia in 2010. He is a former Data Warehouse Consultant before became a lecturer in Universiti Sultan Zainal Abidin (UniSZA), Terengganu, Malaysia. His interests are in Data Mining including Educational Data Mining and Business Intelligence.
Julaily Aida Jusoh received the Bachelor of Computer Science in Software Engineering from Universiti Putra Malaysia, Selangor, Malaysia in 2005. She received her Msc. in Computer Science from Universiti Malaysia Terengganu, Terengganu, Malaysia. Currently, she is a lecturer in Universiti Sultan Zainal Abidin, Terengganu, Malaysia. Her research interests include Formal Specifications and Educational Intelligences.