Biomass from paddy waste fibers as sustainable acoustic material
1A. Putra∗, Y. Abdullah, H. Efendy, W. M. F. W. Mohamad, N. L. Salleh
2
Maintenance Engineering Research Group, Faculty of Mechanical Engineering
3
Universiti Teknikal Malaysia Melaka, Hang Tuah Jaya 76100, Durian Tunggal, Melaka, Malaysia
4
Abstract 5
Utilization of biomass for green products are still progressing in the effort to provide alternative
clean technology. This paper presents the utilization of natural waste fibers from paddy as acoustic
material. Samples of sound absorbing material from paddy waste fibers were fabricated. The effect
of the fiber density, i.e. the fiber weight and the sample thickness, and also the air gap on the
sound absorption coefficient is investigated through experiment. The paddy fibers are found to
have good acoustic performance with normal incidence absorption coefficient greater than 0.5 from
1 kHz and can reach the average value of 0.8 above 2.5 kHz. This result is comparable against that
of the commercial synthetic glass wool. Attachment of a single layer of polyester fabric is shown
to further increase the absorption coefficient.
Key words: paddy, sound absorption, acoustic material, natural waste, biomass
6
1. Introduction 7
Use of synthetic porous and fibrous acoustic materials is still frequently found especially in 8
building acoustics as well as in noise control applications. The products such as foam, rock wool 9
and glass wool made from mineral are known for their toxicity and polluting effect which are harmful 10
to human health as well as to the environment. It has been presented that their production can 11
release more carbon dioxide into the atmosphere compared to those made from natural materials [1]. 12
In order to support ’green’ environment campaign, acoustic absorbers from natural materials are 13
therefore of interest due to their bio-degradability and sustainability. 14
Several works have been published which studied the potential of natural materials to be em-15
ployed as sound absorbing materials. The bamboo fibers are found to have absorption coefficient 16
∗Corresponding author. Tel.:+606 234 6720; fax:+606 234 6884.
similar to that of the commercial glass fiber. The fibers were also used to develop a fiber-board of a 17
resonant-type absorber and is found to have better acoustic performance compared to plywood [2] 18
The sound absorption of kenaf fibers was investigated by D’Alessandro and Pispola [3] through 19
a reverberant room test showing absorption coefficient of 0.85 above 1 kHz. Ersoy and K¨u¸c¨uk [4] 20
studied the potential of waste industrial tea-leaf and found that the absorption coefficient of the 21
waste fibers increases significantly when backed with a single woven cotton cloth. For 10 mm 22
thickness, the acoustic performance of the tea-leaf-fiber at high frequency is superior than that of 23
polyester and poly-propylene. 24
Waste ramie fibers treated and non-treated with alkalization can also produce promising results 25
with average absorption coefficient of 0.6 at frequency range of 500 Hz–3.2 kHz [5]. Comprehensive 26
studies on panels made from coir fibers have been conducted to investigate the effect of perforated 27
facing, multiple-layer arrangement and the panel compression on the acoustic performance [6, 7, 8]. 28
Overall, coir fiber is naturally good sound absorber at medium to high frequency at 1.5–5 kHz. 29
Investigation on the acoustic properties of Arenga Pinnata fibers which can be found from a 30
palm sugar tree has been reported [9]. These are the type of hard fibers which are similar to 31
the coir fibers. Usually this type of fiber starts to perform at frequency range higher than that 32
of the soft fibers. The normal incidence absorption coefficient can reach 0.75–0.85 at frequency 33
between 2–5 kHz with sample thickness of 40 mm. Jute fibers have also been tested to have 34
potential acoustic absorptivity [10]. The flammability properties are also found to be better than 35
a commercial sound absorber. 36
Most recently, Putra et al. [11] presented the acoustic performance of fibers from sugarcane 37
bagasse. Normal incidence test shows the fibers to have good absorption coefficient above 0.5 from 38
1 kHz. At 2–4.5 kHz, the average absorption coefficient is 0.8. Comparable result of sound ab-39
sorption with fiber-glass was also shown. Sound absorber panel constructed from various vegetable 40
fibers including coconut, palm, sisal and a¸ca´ı were presented by Bastos et al. [12]. Measurement 41
inside a scaled reverberation chamber reveals promising results of sound absorption performance 42
for all the panels. The samples were also undergone flammability, odor, fungal growth and ageing 43
tests to identify its capability in practical situation. 44
The acoustic properties of non-fibrous type materials were studied by Oldham et al. [13]. The 45
wave. A quite promising results are presented where the materials can absorb sound effectively 47
from low to high frequency ranges at 500 Hz–5 kHz. The prediction model is also proposed. 48
This paper presents the investigation of the waste fiber from rice paddy for its capability to 49
be sound absorbing material, which according to the author’s knowledge has not been addressed 50
or is rarely discussed by any other researches. For this purpose, raw materials from the paddy 51
fibers were fabricated into samples which can be measured through an impedance tube test for 52
their normal incidence sound absorption coefficient. 53
2. Preparation of the materials 54
2.1. Paddy fibers
55
Paddy or Oryza Sativa is known for its seed or grain called rice, as the main source of meal 56
especially in Asia. Rice is still the most consumed food grain in the world with total consumption 57
of 444 million metric tons in 2011 according to US Department of Agriculture [14]. Southeast 58
Asia including Thailand and Vietnam are among the biggest producers and exporters of rice in the 59
world. 60
The cultivation of rice yields two main important types of residues; husk and straw. One ton 61
of rice paddy can produce roughly 220 kg of husk and 290 kg of straw [15]. Husk is the coating of 62
the paddy grain which is separated from the grain during the milling process. The husk is mainly 63
utilized for power generation where the materials are burnt in boilers or combustion furnace to 64
produce heat and electricity [16]. The rice straw, on the other hand, is often left in the field and is 65
eventually removed or burned in-situ for the next crop. Around 12 million tons of rice straws and 66
wheat straws are burnt annually in Punjab, India [17] in order to save cost for clearing the rice field. 67
This natural waste is sometimes used as food for the ruminants. Studies are being conducted to 68
utilize the rice straw as the bio energy resource to produce bio oil due to its cellulosic property [18]. 69
In Indonesia and Malaysia particularly, the rice straw has long been used to make brooms or mats, 70
other household and handcraft products. It has also been applied for roofs in traditional houses. 71
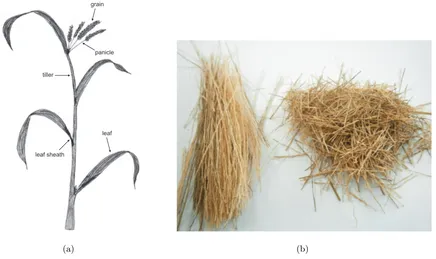
Figure 1(a) shows the anatomy of the paddy where the waste straw usually comprises of tiller 72
and panicle [19]. The panicle is a fiber-like structure where groups of flower or grain grow on 73
top of it. These fibers are presented in Figure 1(b). This paper studies the potential of these 74
the literatures. Similar study concerning the paddy waste has been done by Yang et al. [20], but 76
this employed the paddy straws which were processed into particles and were mixed with those 77
from wood to be a wood board that finally has sound absorbing capability. A preliminary study 78
regarding the panicle fibers was conducted by Abdullah et al. [21] where the fibers were mixed 79
with methylcellulose. The binder however can be abrasive and is not suitable in practice although 80
good sound absorption was obtained from the study. 81
panicle
tiller
leaf
leaf sheath
grain
(a) (b)
Figure 1: (a) External anatomy of rice paddy and (b) raw paddy fibers from the panicles.
2.2. Fabrication of absorber sample
82
Construction from the paddy fibers into an absorber sample is divided into two stages, namely 83
the preparation and fabrication stages. In the preparation stage, raw material was dried for one 84
week and then heated in the oven at 80o
C for 5 minutes to let the remaining water in the fibers 85
evaporated. The raw material was then cut into 5 to 10 mm. In order to have a compact structure, 86
the fibers were then mixed with a binding agent, namely polyurethane. The composition of the 87
fibers and the binder was roughly 90% and 10% by weight, respectively. 88
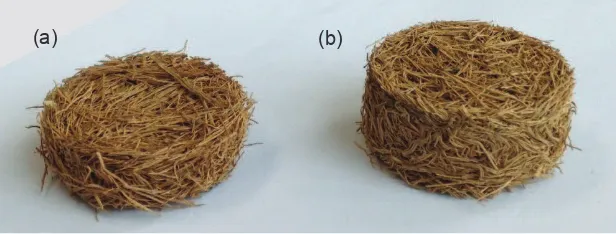
In the fabrication stage, the mixtures were hot-pressed in a round mold with diameter of 33 mm 89
shows examples of the fabricated absorber samples with different thicknesses of 10 mm and 20 mm. 91
For each thicknesst, the weight of the fiber is given for 2 grams and 4 grams which yields different 92
fiber densities. The bulk density for each sample can be simply calculated by the ratio of the total 93
mass of the sampleM and its volume V asρbulk =M/V.
94
Note that the bulk density means the total volume also includes the volume of the pores inside 95
the sample. Measurement using the Inverted Research Microscope (IRM) technique shows that 96
diameter of the paddy fibers can range from 8–20µm. Figure 3 shows examples of the microscopic 97
view from samples with thickness of 20 mm with fiber weight of 2 grams and 4 grams giving 98
different bulk density. Greater density of sample, i .e. more fibers with same thickness, can be seen 99
to have the size of the pores reduced. However this could form more complicated internal path 100
(tortuosity) which can cause greater sound energy loss. 101
(b) (a)
Figure 2: Examples of fabricated samples from paddy fibers with different thicknesses: (a)t= 10 mm,
2 grams,ρbulk= 234 kg/m 3
and (b)t= 20 mm, 2 grams,ρbulk= 117 kg/m 3
.
3. Measurement of absorption coefficient 102
3.1. Experimental setup
103
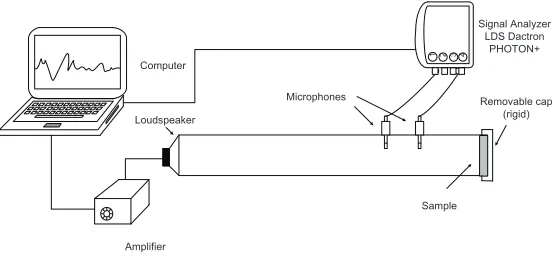
Diagram of the measurement setup is shown in Figure 4. The measurement of sound absorption 104
coefficient was conducted using the impedance tube method according to ISO 10534-2:2001 [22]. 105
The sample was place against a rigid backing at the end of the tube and a loudspeaker at the 106
other end was used to feed white noise into the tube. Two acoustic microphones i.e. the G.R.A.S 107
1
2 inch prepolarized free-field microphones type 40AE equipped with 1
2 inch CCP preamplifier type
108
pores
fibers (a)
pores
fibers (b)
Figure 3: Microscopic view of samples (t= 20 mm) with different densities: (a) 2 grams;
ρbulk= 117 kg/m 3
and (b) 4 grams;ρbulk= 234 kg/m 3
showing the size of the fibers and the pores.
the reflected sound from the material. The RT Pro Photon+ v6.34 analyzer with Dactron software 110
was used as the data acquisition system. 111
Microphones
Sample Loudspeaker
Removable cap (rigid)
Amplifier
Signal Analyzer LDS Dactron PHOTON+
Computer
1 2 3 4
Figure 4: Diagram of the measurement setup for the absorption coefficient test.
The diameter of the tube used in the experiment is 33 mm and thus the reliable frequency 112
range is between 500 Hz to 5 kHz. This frequency range corresponds to the diameter of tube 113
accommodating propagation of plane waves for normal incidence assumption. For low frequency 114
below 500 Hz down to 50 Hz, tube with larger diameter is used to give better accuracy [22]. The 115
recorded signals in the analyzer in terms of the transfer function between the microphones were 116
processed using MATLAB software to obtain the absorption coefficient of the sample under test. 117
3.2. Results and discussion
119
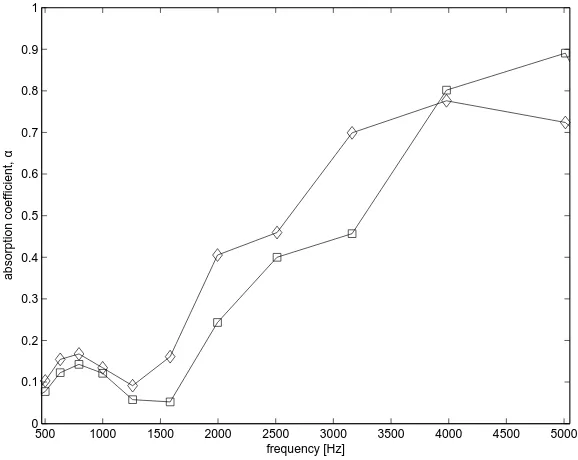
Figure 5 plots the acoustic absorption of 2 gram paddy fibers with different thicknesses of 120
10 mm and 20 mm. The result for 10 mm thick sample shows that good acoustic performance 121
(α >0.5) is achieved at frequency above 3 kHz. This is a typical performance of a fibrous absorber,
122
especially a hard-type fiber as also found for the coir fiber, where good sound absorption starts 123
at high frequencies [6]. Doubling the thickness can be seen to increase the absorption coefficient 124
below 3.5 kHz, which is also due to reduction of the fiber density [23]. However, reduction of 125
the density also reduces the flow resistivity. Due to the same amount of fibers introduced for 126
the increase volume of the sample, the sample might now have more open pores which allow the 127
sound to propagate easily, especially for high frequency, without having significant viscous losses 128
to convert the sound energy into heat [24]. For the 20 mm thick sample, the absorption coefficient 129
can be seen to reduce above 3.5 kHz. 130
500 1000 1500 2000 2500 3000 3500 4000 4500 5000 0
0.1 0.2 0.3 0.4 0.5 0.6 0.7 0.8 0.9 1
frequency [Hz]
absorption coefficient,
α
Figure 5: Measured absorption coefficient of samples with the same fiber weight of 2 grams:
——t= 10 mm and —♦—t= 20 mm.
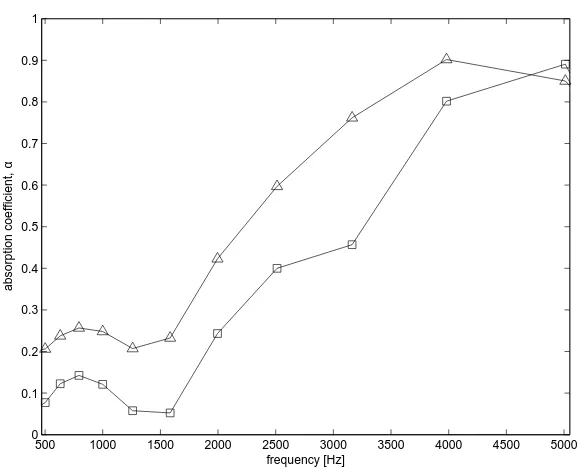
To improve the absorption at high frequencies, more fibers can thus be added to increase the 131
density. As seen in Figure 6, by adding the fiber weight to 4 grams, the absorption coefficient 132
frequency down to 500 Hz. 134
500 1000 1500 2000 2500 3000 3500 4000 4500 5000 0
0.1 0.2 0.3 0.4 0.5 0.6 0.7 0.8 0.9 1
frequency [Hz]
absorption coefficient,
α
Figure 6: Measured absorption coefficient of samples with the same thickness,t= 20 mm:
—♦— 2 grams and —△— 4 grams.
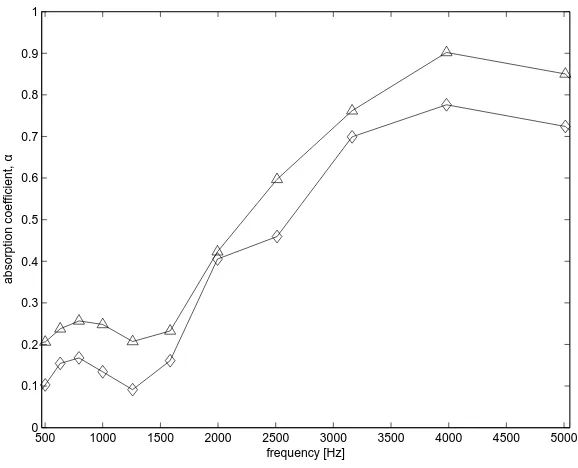
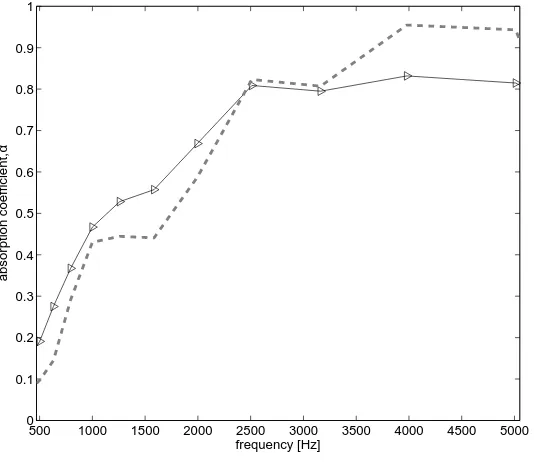
Figures 5 and 6 compare the results for different fiber densities. It is therefore interesting to 135
investigate the case for samples with different thicknesses and fiber weights, but have the same 136
density as plotted in Figure 7. Here again, the effect of thickness can be seen to consistently 137
increase the absorption coefficient from 500 Hz without significantly deteriorating the performance 138
at high frequencies as now the density is kept constant (see again Figure 5). 139
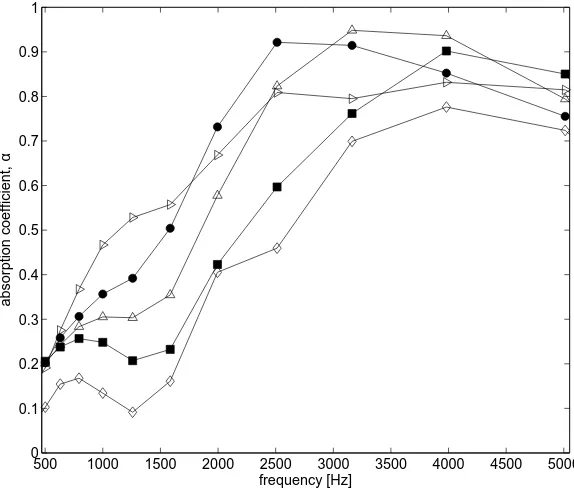
The effect of density is plotted in Figure 8. This is done by increasing the fiber weight for a 140
20 mm thick sample up to 6 grams. It is interesting to observe here that the measured absorption 141
coefficient has no linear relationship with the density. More fibers can create more tortuos path 142
(increase turtuosity) and can also increase the flow resistivity. However, by further increasing 143
the density (adding more fibers), close pores could be formed and thus greatly increase the flow 144
resistivity and eventually reduce the absorption capability. As seen in Figure 8, the sample with 6 145
gram fiber weight has lower absorption coefficient than that from the sample with 3 gram fibers. 146
This is consistent with the finding as in [2]. The fabrication process can also give effect on the 147
500 1000 1500 2000 2500 3000 3500 4000 4500 5000 0
0.1 0.2 0.3 0.4 0.5 0.6 0.7 0.8 0.9 1
frequency [Hz]
absorption coefficient,
α
Figure 7: Measured absorption coefficient of samples with the same density,ρbulk= 234 kg/m
3
:
——t= 10 mm; 2 grams and —△—t= 20 mm; 4 grams.
Improvement of sound absorption at low frequencies can also be achieved by adding an air 149
layer behind the absorber, i.e. by moving away the absorber panel from the rigid wall at a certain 150
distance D. Figure 9 shows the effect of introducing the air layer on the measured absorption 151
coefficient. The absorption coefficient can be seen to shift to lower frequencies as the air gap 152
distance is increased. A maximum peak can also be observed for each corresponding air layer 153
depth which, for a thin panel, corresponds to a quarter acoustic wavelength where the velocity of 154
the air particle is at maximum on the surface of the absorber [25]. The phenomenon may differ for 155
a thick sample as in this case, but the frequency of the maximum peaks are shown to be the same 156
for both sample thicknesses which indicates the relation of the peak frequency with the air layer 157
depth. The absorption coefficient after the peak can be seen to decay towards the minimum peak 158
or dip due to the formation of multiple peaks at higher frequencies. 159
The results in Figure 9 also show interesting phenomenon where introducing the air layer to the 160
sample with greater density, i.e. 10 mm thick sample (Figure 9(a)) yields greater sound absorption 161
effect. For the sample with greater density of fiber, the sound passing through the sample might 162
500 1000 1500 2000 2500 3000 3500 4000 4500 5000
Figure 8: Measured absorption coefficient of 20 mm thick samples with different fiber weight:
–♦–2 grams, –⊲–3 grams, –△–4 grams, –•–5 grams, ––6 grams.
500 1000 1500 2000 2500 3000 3500 4000 4500 5000
0
500 1000 1500 2000 2500 3000 3500 4000 4500 5000
0
Figure 9: Measured absorption coefficient of 2 gram samples with thickness of (a) 10 mm and (b)
20 mm with different backed air layer thicknesses: –♦– without air layer, –×–D= 10 mm and
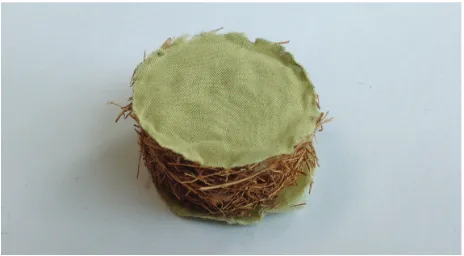
In practice the fibrous absorber may not be directly exposed to sound, but is covered by a 164
layer for protection or artistic purpose. Here a polyester fabric from a textile cloth was used and 165
was attached on the front surface of the sample, on the back surface and on both the front and 166
back surfaces as seen in Figure 10. The measurement results are shown in Figure 11. It is found 167
that covering the facing of the sample with the polyester fabric gives substantial improvement to 168
the sound absorption especially from 1.2 kHz to 3.2 kHz. The absorption coefficient almost even 169
reaches unity at 2–3 kHz. 170
Figure 10: Sample of the paddy fiber attached with polyester fabric.
Covering only the back surface also increases the absorption coefficient below 3 kHz. Similar 171
trend is also found in [4]. Further improvement at lower frequencies below 2 kHz can be seen when 172
the polyester fabric was attached on both surfaces of the sample. 173
Figure 12 compares the absorption coefficient of the sample having 3 grams of fiber weight with 174
that of glass wool of thickness 0.75 inch ≈ 20 mm. Comparable sound absorption performance 175
with the commercial glass wool can be observed although the latter shows its superior performance 176
at high frequencies above 3 kHz. This however demonstrates that the paddy fiber can be a good 177
500 1000 1500 2000 2500 3000 3500 4000 4500 5000 0
0.1 0.2 0.3 0.4 0.5 0.6 0.7 0.8 0.9 1
frequency [Hz]
absorption coefficient,
α
Figure 11: Measured absorption coefficient of sample (t= 20 mm, 2 grams) with polyester fabric:
–♦–without, –H–on front surface, ––on back surface and –•–on front and back surfaces.
500 1000 1500 2000 2500 3000 3500 4000 4500 5000 0
0.1 0.2 0.3 0.4 0.5 0.6 0.7 0.8 0.9 1
frequency [Hz]
absorption coefficient,
α
Figure 12: Comparison of absorption coefficient of the paddy fiber sample (–⊲–;t= 20 mm, 3 grams)
4. Conclusion 179
Samples of sound absorber from paddy waste fibers have been tested for their sound absorption 180
performance and the measured normal incidence absorption coefficient has been reported. The 181
experimental results show that this natural fiber can be utilized as a potential alternative acoustic 182
material. With thickness of 20 mm and 3 grams of fiber weight, the absorption coefficient is more 183
than 0.5 above 1 kHz and can reach 0.8 on average above 1.5 kHz, comparable with the performance 184
of a synthetic glass wool with the same thickness. By introducing a single layer of polyester fabric 185
to the sample’s facing, further improvement of sound absorption can be obtained. It has also been 186
discussed that care has to be taken when designing the density of the absorber as too dense fibers 187
can deteriorate the sound absorption performance. In order to fully confirm the robustness of 188
paddy waste fibers in practice, additional environmental tests are required, for examples the fire 189
retardant, fungal growth and humidity tests which are of interest in the extension of this current 190
work. 191
List of Symbols 192
t : sample thickness (m)
ρbulk : bulk density (kg/m3)
D : air layer thickness (m)
α : absorption coefficient 193
Acknowledgment 194
The financial support for this project is provided by the Ministry of Higher Education Malaysia 195
(MoHE) under the Fundamental Research Grant Scheme No. FRGS/2010/FKM/SG03/7-F00095. 196
Conflict of Interests 197
Authors declares that no financial relation exists either directly and indirectly between the 198
References 200
[1] F. Asdrubali, Survey on the acoustical properties of new sustainable materials for noise control,Proceedings of
201
Euronoise, Finland (2006). 202
[2] T. Koizumi, N. Tsujiuchi and A. Adachi, The development of sound absorbing materials using natural bamboo 203
fibers,High Performance Structures and Composites, (2002) 157–166. 204
[3] F. DAlessandro and G. Pispola, Sound absorption of sustainable fibrous materials in an enhanced reverberation 205
room.Proceedings of the Congress and Exposition on Noise Control Engineering, 2005. 206
[4] S. Ersoy and H. Kucuk, Investigation of industrial tea-leaf-fibre waste material for its sound absorption proper-207
ties.Applied Acoustics, 70(2009), 215–220. 208
[5] R. Eriningsih, Flax fiber composites and hemp waste as a sound absorption material.Arena Textiles,24(2009), 209
51–59 (in Indonesian). 210
[6] R. Zulkifli, Zulkarnain and M. J. M. Nor, Noise control using coconut coir fiber sound absorber with porous 211
layer backing and perforated panel.American Journal of Applied Sciences, 7(2010) 260–264. 212
[7] M. H. Fouladi, M. J. M. Nor, M. Ayub and Z. I. Leman, Utilization of coir fiber in multilayer acoustic absorption 213
panel.Applied Acoustics, 71(2010), 241–249. 214
[8] M. J. M. Nor, M. Ayub, R. Zulkifli, N. Amin and M. H. Fouladi, Effect of compression on the acoustic absorption 215
of coir fiber.American Journal of Applied Sciences, 7(2010), 1285–1290. 216
[9] L. Ismail, M. I. Ghazali, S. Mahzan and A. M. A. Zaidi, Sound absorption of Arenga Pinnata natural fiber. 217
World Academy of Science, Engineering and Technology, 67(2010), 804–806. 218
[10] S. Fatima and A. R. Mohanty, Acoustical and fire-retardant properties of jute composite materials. Applied
219
Acoustics, 72(2011), 108–114. 220
[11] A. Putra, Y. Abdullah, H. Efendy, W. M. Farid, Md. R. Ayob and M. S. Py, Utilizing sugarcane wasted fibers 221
as a sustainable acoustic absorber.Procedia Engineering, 53(2013), 632–638. 222
[12] L. P. Bastos, G. S. V. Melo and N. S. Soeiro, Panel manufactured from vegetable fibers: An alterna-223
tive approach for controlling noises in indoor environments. Advances in Acoustics and Vibration, (2012), 224
doi:10.1155/2012/698737. 225
[13] D. J. Oldham, C. A. Egan and R. D. Cookson, Sustainable acoustic absorbers from the biomass. Applied
226
Acoustics, 72(2011), 350–363. 227
[14] N. Childs, J. Dyck and J. Hansen, Southeast Asia projected to remain top rice exporter. Economic
Re-228
search Service-United States Department of Agriculture. [online] Available at: http://www.ers.usda.gov/amber-229
waves/2013-february/southeast-asia-projected-to-remain-top-rice-exporter.aspx (Accessed on 27 March 2013) 230
[15] S. Zafar, Biomass resources from rice industry. Bioenergy consult. [online] Available at: 231
http://www.bioenergyconsult.com/biomass-resources-rice-industry/ (Accessed on 25 March 2013) 232
[16] E. Natarajan, A. Nordin and A. N. Rao, Overview of combustion and gasification of rice husk in fluidized bed 233
reactors.Biomass and Bioenergy, 14(1998), 533–546. 234
[17] O. P. Rupela, S. Gopalakrishnan, B. S. Sidhu and V. Beri, Composting rice straws in semi-arid condition. In 235
Agency (2003), 171–178. 237
[18] C. Huang, M. Zong, H. Wu and Q. Liu, Microbial oil production from rice straw hydrolysate by Trichosporon 238
fermentans.Bioresource Technology, 100(2009), 4535–4538. 239
[19] T. L. Rost, Rice anatomy: Leaves. Rice-An anatomy atlas. [online] Available at: 240
http://www.plb.ucdavis.edu/labs/rost/Rice/Leaves/Leaves.html (Accessed on 31 March 2013) 241
[20] H. S. Yang, D. J. Kim and H. J. Kim, Rice straw-wood particle for sound absorbing wooden construction 242
materials,Bioresource Technology, 86(2003), 117–121. 243
[21] Y. Abdullah, A. Putra, H. Effendy, W. M. Farid and M. R. Ayob, Investigation on natural waste fibers from 244
dried paddy straw as a sustainable acoustic absorber.Proceedings of IEEE 1st Conference on Clean Energy and
245
Technology (CET), 2011. 246
[22] ISO 10534-2. Acoustic - Determination of sound absorption coefficient and impedance tubes Part 2: Transfer 247
function method, 2001. 248
[23] W. Su, X. Qian, X. Li and S. Liu, Influence of thickness and density of nonwoven sound-absorbing material on 249
the sound absorption capability.Advanced Materials Research, 197-198(2011), 440–443. 250
[24] M. J. Crocker and J. P. Arenas, Use of sound absorbing materials. InHandbook of Noise and Vibration Control
251
(Ed. M. J. Crocker), 2007, pp. 696-713, New Jersey: John Wiley & Sons, Inc. 252