© IJACS 2010 - All rights reserved
1
Applied Markovian Approach for Determining Optimal Process Means in Single
Stage SME Production System
1Abd. Samad Hasan Basari, 2Hazlina Razali, 3Burairah Hussin, 4Siti Azirah Asmai,, 5Nuzulha Khilwani
Ibrahim, 6Abdul Samad Shibghatullah
Department of Industrial Computing
Faculty of Information & Communication Technology
Universiti Teknikal Malaysia Melaka, Hang Tuah Jaya, 76100 Durian Tunggal, Melaka, Malaysia {(1abdsamad, 3burairah, 4azirah, 5nuzulha, 6samad)@utem.edu.my, [email protected]}
Abstract
The determination of optimum process mean has become one of the focused research area in order to improve product quality. Depending on the value of quality characteristic of juice filling in the bottle, an item can be reworked, accepted or accepted with penalty cost by the system which is successfully transform to the finishing product by using the Markovian model. By assuming the quality characteristic is normally distributed, the probability of rework, accept and accept with penalty cost is obtained by the Markov model and next the optimum of process mean is determined which maximizes the expected profit per item. In this paper, we present the analysis of selecting the process mean in the filling process. By varying the rework and accept with penalty cost, the analysis shown the sensitivity of the Markov approach to determine the process mean.
Index Terms - Optimum Process Mean, Markovian Model, Normal Distribution
1. Introduction
The optimum process mean setting is used for selecting the manufacturing target. The selection of appropriate process parameters is a major interest and importance in satisfying such a desirable goal. By obtaining an optimum process mean will directly affect the process defective rate, production cost, rework cost, scrap cost and the cost of use. The aim of the study is to find optimum values of process parameters or machine settings that will achieve certain economical objectives which are usually refer as maximum profit. A number of models have been proposed in the literature for determining an optimum target (mean and/ or variance). According to Taguchi [1], if the process mean approaches the target value and the process standard deviation approaches zero, then the process is under optimum control.
The identified problem has many fault area. The most common fault area is the canning or filling process where the quality of the process is doubtful. Currently, the
© IJACS 2010 - All rights reserved
2 Since SME has limited capital, they are not able to
upgrade the inspection process properly. They also facing problem to determine the amount of filling in each of the bottle. To overcome this problem, usually they will refer to expert judgement in determining the filling amount. However, as for expert judgement has its deficiency due to inconsistent decision. Due to this reason, the calculation of the optimum expected mean also may affect the real maximum expected profit.
The remainder of this paper is organized as follows. Section 2 will discusses the literature review in determining the optimal process mean. In Section 3, we examine the single-stage production system that proposed by Bowling et al. [4]. Numerical examples and also the sensitivity of the analysis are also given in this section. The conclusion and recommendation follows in the last section.
2. Literature Review
There are considerable attentions paid to the study of economic selection of process mean. The initial process targeting problem addressed is the can filling problem. The first real attempt to solve this problem was in Springer [5] who considered the problem of finding the optimal process mean for a canning process when both upper and lower control limits are specified. The author assuming that a quality characteristic follows normal and gamma distribution. A simple method is suggested in determining the optimum target mean that minimizes the total cost. According to Springer [5], the financial loss due to production of product above the specification limit is not necessarily equal to the loss when producing one below the lower specification limit. Bettes [6] studied the same problem as Springer [5] except that only the lower limit was specified, and used a trial and error procedure to tabulate a set of values for the specified lower limit. Furthermore, he assumes undersized and oversized items are reprocessed at a fixed cost. Hunter and Kartha [7] presented a model to determine the optimum process target with the assumption that the cans meeting the minimum content requirement are sold in regular market at a fixed price, while the under-filled cans are sold at a reduced price in a secondary market. Thus, the customer is compensated for poor quality but does not pay for the redundant quality product.
Taguchi [1] presented the quadratic quality loss function for redefining the product quality. According to the author, product quality is the society’s loss when the product is sold to the customer. Lee et al. [8] considered performance as the variable to maximize the expected profit per item in obtaining the optimum process mean.
The profit is depending on the normal characteristic value and each item is classified to three grades; items that sold to primary market, items that sold to secondary market and rework items. Teeravaraprug [9] adopted the quadratic quality loss function for evaluating the quality cost of a product for two different markets and obtained the optimum process mean based on maximizing the expected profit per item. The author considered the two grades of products. The product may be sold in the primary market or secondary market if the product quality is accepted. If the quality cannot be accepted by the secondary market, then the product is scrapped.
Most of the works have addressed the 100% screening in the filling or canning process. However, the 100% inspection policy cannot be executed in some situations due to several constraints that also faced by SME. Hence, one needs to consider the use of sampling plan for deciding the quality of a lot. Usually, the non-conforming items in the sample of accepted lot are replaced by conforming ones. Carlson [10] considered the case of acceptance sampling where the rejection criterion was based on the sample mean. Boucher and Jafari [11] considered the attribute single sampling plan applied in the selection of process target. They assumed that items which belong to accepted lots can be sold at a certain price. While for items that belong to rejected lots can be sold at secondary market. Al-Sultan [12] developed an algorithm for finding optimum target values for two machines in series when sampling is used.
© IJACS 2010 - All rights reserved
3 [4] model by considering the cutting can into the right
diameter, thick and length. Missing by cutting too much may imply scrap, while cutting too little only caused rework. In searching maximum profit, he showed that a local maximum profit function is
also global. In this paper we will implement the Markovian approach as the preliminary analysis for determining the optimum process mean which fulfill the maximum expected profit that is suggested by Bowling et al. [4]. However, in Bowling et al. [4], he considered the optimal diameter of a can to be cut at each stage. In our case, we will consider the filling process which referring to the amount of water or juice to be filled in each bottle. Each bottle may be rework due to under-filled or accepted or also being accepted but with penalty cost due to over-filled.
3. ANALYSIS AND DESIGN
A. Model formulation
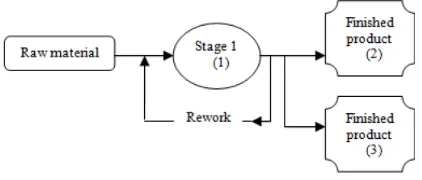
Consider a single-stage of the production system is defined as having a single machine. In the many and varied industrial filling process that exist in practice, overfilling frequently occurs and circumstances product actually overflows the containers or bottle. In drink-filling industry, under-filled containers and their contents may be discarded. The contents being emptied-out and the material will be reused and yet through the same stage again which is referring to filling stage.
Bowling et al. [4] has introduced a transition probability matrix P to describe transitions among three states in the stage:
i. State 1 indicates processing state at the production stage.
ii. State 2 indicates that the item has been processed successfully and transform into finishing product. iii. State 3 represents that the item has been also
processed into the finished product but with extra cost which is referring to penalty cost. A single-stage production system is shown in Figure 1.
Figure 1. A Single-Stage Production System
The single-step transition probability matrix can be expressed by using Markovian model and be described as below:
Where P11 is the probability of an item being rework, p12 is the probability of an item being accepted, and p13 is the probability of an item is accepted but with penalty cost. By assuming that the quality characteristic is normally distributed, these probabilities are shown in Figure 2.
© IJACS 2010 - All rights reserved
4 As the item at each stage may be reworked, accepted or
accepted with penalty cost, the expected profit is considering the selling price, penalty cost and reworked cost. It is assumed that in normal distribution of quality characteristic, the mean is unknown and the variance is known. The problem is to find the optimal mean for the process when the expected profit is maximized. The maximum expected profit is the sum of the revenues from selling price of an item minus the cost of processing and reprocessing or reworked and the penalty cost per item. This costs are affected the net profit of the production plan.
i. Selling price: The accepted bottle is than can be sold at price S cents per bottle.
ii. Production cost: Each filling attempt results in k cents in production cost. This includes the cost of operating the filling machine, labor and utilities. iii. Penalty cost: A production of filling process which
result in over-filled the bottle that causes overflow. This penalty cost occurs as it causes loss to manufacturer due to overflow.
iv. Rework cost: A bottle having filled less than lower limit must be rework, at a cost of r cents.
Therefore, the expected profit per item (EPR) can be expressed as follows:
Where SP is represented as the selling price per item, PC is the processing cost per item while PnltyC and RC is penalty cost and rework cost per item, respectively. f12 represents the long-term probability of an item has been processed successfully at Stage 1 and being accepted. While f13 represent the long-term probability of the item is being accepted with penalty cost as the item is over-filled from Stage 1. The element of m11 is represented as the expected number of times in the long run that the transient State 1 is occupied before accepted or accepted with penalty. The m11 element is obtained by following fundamental matrix M:
Where I is the identity matrix. The long-run probability matrix, F, can be expressed as follows:
Substituting for f13 and m11, the expected profit equation (1) can be written as follows:
From this equation, one would like to find the value of optimum mean that maximizes the expected profit.
B. Case study for tamarind juice
A production line survey has been conducted in a small medium enterprise (SME) that produce tamarind juice drink. According to expert, the customer wants the filling of water contain in each bottle to be within the range of 280 and 310 ml. By considering this parameter, the conforming item is capped and moved to the dispatching stage on the conveyor belt for packaging. If the amount of filling is under the required amount or under-filled, the item is called as rejected item. Thus, the bottle will be emptied out and the bottle will be re-used to undergo the filling process again. However, if the bottle is filled over the limit or over-filled, the item is called as accepted item with penalty cost. The penalty cost is included here because the bottle has filled more than required amount. Therefore, this factor may lead loss to the manufacturer itself.
C. Analysis
1: Expert judgment parameter
We assume that once the value of mean is determined, it is fixed for the entire production process. Once the filling operation starts, the process would not be stopped to reset the mean value. To perform the preliminary analysis, we use the parameter as follows: SP =120, PC=50, RC=30, PnltyC=85, standard deviation is set to 1 while the lower and upper limit is set to 305 and 310 ml, respectively. Note that all cost of parameters is in cents to simplify the calculation. The result of the calculation using equation (2) is shown in Figure 3.
© IJACS 2010 - All rights reserved
5 Figure 2. Expected Profit versus Process Mean
Analysis II: Observation parameter
The observation is done by measuring the amount of each bottle. Surprisingly we find that the lower limit of each bottle is actually 275 ml (at the bottleneck) and the upper limit is 280 ml (full). Using the same parameter as given by the expert judgment, we do the analysis to find the exact optimal value of process mean.
The result of the analysis is shown in Figure 4. From the graph, it can be shown that the expected profit was in optimum value at mean value 277.90 ml with maximum EPR of 69.11 per bottle.
Figure 3. Expected Profit versus Process Mean
Based on the result we can see that even though the expected profit for both analyses is same, the optimal mean is different. This may cause a big loss for the company due to inaccurate expert judgment and in consequences causing waste to each filling bottle. We do the comparison of this analysis by measuring how many bottles can be filled for a mixture that contains 500 litres of tamarind juice and shown in Table 1 below.
Figure 4. TABLE I. DIFFERENCE OF EXPERT JUDGEMENT AND OBSERVATION OF MAXIMUM FILL PER BOTTLE
Maximum ml
(per bottle)
Bottles fill
Expert 310 1613
Observation 280 1786
Difference 30 173
From the above table, the over-filled amount that is set by the expert judgment can fill another 173 bottles. If we considering that the item is accepted in the specification limit and ignoring the penalty cost and rework cost, the manufacturer actually facing loss about RM 121.10. D. Sensitivity analysis
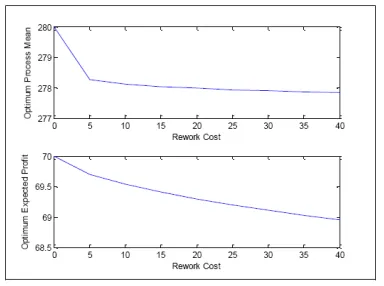
The sensitivity analysis is performed to illustrate the possible impact of parameters on the optimal process mean and also the optimal expected profit. The rework and penalty cost is varied for the single-stage production system and their effects are shown in Fig 5 and Fig 6.
Figure 5. Effect of penality cost on optimal value mean and expected profit
© IJACS 2010 - All rights reserved
6 From the above mentioned graphs, we can see the
behaviour of the optimum process mean and optimum expected profit with the variation of the penalty and rework cost for the single stage production system. From the figures it is noticed that the optimum process mean and optimum expected profit is sensitive to the changes of penalty and rework cost values. Based on Figure 5, we can see that when the penalty cost is increased, the optimum process mean is increased and the optimum expected profit is decreased. However, in Figure 6, it is shown that the expected profit is decreased when the rework cost is increased and the optimum process mean is decreased. It is observed that when the penalty cost and rework cost is increased in the single stage production system, the optimum expected profit mean is decreased.
4. Conclusion
In previous studies, the issues of frustration and withdrawal behaviour in technological adoption have been highlighted. This paper aims to provide insights on how variables such as resistance, frustration, usage and In this paper, we present the analysis in juice filling into the bottle by using the Markovian approach in order to find the optimum process mean. The selection of optimum process mean is aimed to achieve manufacturers’ goal which is usually referring to maximum expected profit. The probability of an item is accept, rework (where the bottle is emptied-out and the material is reused) or accept with penalty cost due to over-filled the bottle with juice is obtained by using Markov model. The consideration is referring to that the quality characteristic is distributed in normal distribution.
In SME, they were facing capital constraint to upgrade the inspection process which is referring to 100% inspection. Due to that circumstance, the inspection process is done through observation by the expert workers. However, when we do the observation and measured the amount of water in the tamarind juice drink, we found that the maximum limit that has determined by the expert judgment is normally inaccurate. Perhaps the difference of amount juice in the bottle may contribute to the manufacturers’ loss as the overflow may contribute to fill more bottles.
Furthermore we also analyze the variation of rework and accept with penalty cost to observe the behavior of the optimum expected profit and the optimum process mean. From the analysis, it is observed that either the accept with penalty cost or rework cost is increased, the expected profit will be decreased. Due to this condition, the manufacturer is tried to reduce the over-filled or under-filled item to increase the expected profit per item. By
determining the optimum process mean, the manufacturer also needs to produce items that are approached to the targeted value so that they will gain maximum profit without ignoring the specification limit.
To improve the determination of process mean by using Markovian approach, we are also considering to hybrid artificial intelligence (AI) techniques in Markov model in order to find the optimal target value.
ACKNOWLEDGMENT
The authors would like to thank Faculty of Information and Communication Technology, UTeM and Ministry of Higher Education (MOHE) for providing facilities and financial support. Part of this research is supported under Fundamental Research Grant Scheme FRGS/2010/FTMK /ST02/1.
REFERENCES
[1] G. Taguchi (1986). Introduction to Quality Engineering, Asian Productivity Organisation (Distributed by American Supplier Institute Inc.), Dearborn, MI
[2] S. M. Pollock and D. Golhar (1998). The canning problem revisited: The case of capacitated production and fixed demand. European Journal of Operation Research, 105, pp. 475-482
[3] M. K. Ghani, Rural-Based Food Processing Industry, Asian Productivity Organization Report, Japan, 2004.
[4] S. R. Bowling, M.T. Khasaweh, S. Kaewkuekool and B.R. Cho (2004). A Markovian approach to determining optimunm process target levels for a multi-stage serial production system. European Journal of Operational Research, 159, pp. 636-650
[5] C. H. Springer (1951). A Method for determining the most economic position of a process mean. Industry Quality Control, 8(1), 36-39
[6] D. C. Bettes (1962). Finding an optimum target value in relation to a fixed lower limit and an arbitrary upper limit. Applied Statistics, 11(2), pp. 202-210
[7] W. G. Hunter and C.P. Kartha (1977). Determining the most profitable target value for a production process. Journal of Quality Technology, 9(4), pp. 176-181
[8] M. K. Lee, S.H. Hong, H.M. Kwon and S.B. Kim (2000). Optimum process mean and screening limits for a production process with three class screening. International Journal of Reliability, Quality and Safety Engineering, 7, pp. 179-190
© IJACS 2010 - All rights reserved
7 [10]O. Carlsson (1989). Economic selection of a process level
under acceptence sampling variables. Engineering Costs and Production Economics, 16, pp.69-78
[11]T. O. Boucher and M.A. Jafari (1991). The optimum target value for single filling operations with quality plans. Journal of Quality Technology, 23(1), pp.44-47
[12]K. S. Al-Sultan (1994). An Algorithm for the determination of the optimum target values for two machines in series with quality sampling plans. International journal of Production Research, 32(1), pp.37-45
[13]K.S. Al-Sultan and M.F.S. Pulak (2000). Optimum target values for two machines in series with 100% inspection.
Eurapoen Journal of Operational Research, 120, pp.180-189
[14]S.L. Chen and K.J. Chung (2011). The determination of optimum process mean for a one-sided specification limit product with manufacturing cost and linear quality loss. Journal of Quality, 18(1), pp.19-32
[1] S.Z. Selim and W.K Al-Zu’bi (2011). Optimal means for continuous process in series. European Jpurnal of Operational Research, 210(3), pp.618-623