A COMPARATIVE STUDY OF FEATURE EXTRACTION USING PCA
AND LOA FOR FACE RECOGNITION
ERWIN HIDAYAT
FAJRIAN NUR A.
DR. AZAH KAMILAH BINTI DRAMAN
@
MUDA
DR. CHOO YUN HUOY
DR. SABRINA BINTI AHMAD
(The 7th International Conference on Information Assurance and Security (IAS 2011),
5-8 December 2011, Melaka)
UNIVERSITI TEKNIKAL MALAYSIA MELAKA
A Comparative Study of Feature Extraction Using PCA and LDA
for Face Recognition
Erwin Hidayat, Fajrian Nur A., Azah Kamilah Muda, Choo Yun Huoy, Sabrina Ahmad
Faculty oflnformation and Communication Technology
Universiti Teknikal Malaysia Melaka
Malacca, Malaysia
[email protected]; wikyan _ [email protected]; [email protected];
[email protected]; [email protected]
Abstract-Feature
extraction is important in face
recognition. This paper presents a
comparative study of
reature extraction using
Principal Component Analysis
(PCA) and Linear Discriminant Analysis (LDA) for
face
recognition.
The evaluation parameters for the study are
time and accuracy of each method. The experiments
were conducted using six datasets of face images with
different disturbance. The results showed that LDA is
much better than PCA in overall image with various
disturbances. While in time taken evaluation, PCA is
faster than LDA.
Keywords: face recognition,
feature extraction,
PCA,
LDA
I.
INTRODUCTION
As one of the most successful applications of image
analysis and understanding, face recognition has recently
received significant attention, especially during the past
several years. At least two reasons are accounted for this
trend: first it is widely used in real life applications and
second, is the availability of feasible technologies after
many years ofresearch [l].
The range of face recognition applications is very
assorted, such as face-based video indexing and browsing
engines,
multimedia
management,
human-computer
interaction, biometric identity authentication, surveillance
[2], image and film processing, and criminal identification
[3]. Face recognition is a method of identity authentication
on biometrics study [4]. Comparing face recognition with
another
existing
identification
technology
such
as
fingerprint and iris recognition, it has several characteristics
that are advantageous for consumer applications, such as
nonintrusive and user-friendly interfaces, low-cost sensors
and easy setup, and active identification [ 5].
This method can be divided in the following
categorization: holistic matching methods, feature-based
matching methods and hybrid methods. The holistic methods
used the whole face as input. Principal Component Analysis
(PCA),
Linear
Discriminant
Analysis
(LDA) · and
Independent Component Analysis (ICA) belong to this class
of methods [6]. This paper describes and compares PCA and
LDA in terms of speed (time) and recogmt10n rate. The
comparison study was conducted on several groups of
images with various disturbances. PCA and LDA were
selected because these methods are most widely used with
simple processing steps. This is beneficial to the embedded
systems [ 4].
II.
FACE RECOGNITION PROBLEM
During the past decades, face recognition has received
substantial attention from researchers. The challenges of face
recognition are the rapid and accurate identification or
classification of a query image [7]. Rapid can be associated
to speed and accuracy refers to recognition rate. Most
techniques emphasize on the efficiency in getting positive
results, but when it comes to implementation, speed is vital.
The performance of a face recognition technique should be
able to produce the results within a reasonable time [8]. For
example, for video monitoring and artificial vision, real time
face recognition has a very important meaning.
It
is very
useful that the system can detect, recognize and track subject
in real time [9]. In human-robot interaction, real-time
response time is critical [10]. Besides, it also enables
computer systems to recognize facial expressions and infer
emotions from them in real time [11].
Ill.
fEA TURE EXTRACTION
Feature extraction is an important method in the fields of
pattern recognition and data mining technology.
It
extracts
the meaningful feature subset from original dates by some
rules, to reduce the time of machine training and the
complexity of space, in order to achieve the goal of
dimensionality reduction. Feature extraction transforms the
input data into the set of features while the new reduced
representation contains most of the relevant information
from the original data [12]. Fealure extraction is a key step of
any face recognition system.
A. Principal Component Analysis (PCA)
PCA transforms the original data space or image into a
subspace set of Principal Components (PCs) such that the
first orthogonal dimension of this subspace captures the
greatest amount of variance among the images. The last
dimension of this subspace captures the least amount of
variance among the images, based on the statistical
characteristics of the targets [ 14].
The output components from this transformation are
orthogonal or uncorrelated, and the mean square error can be
the smallest when describing the original vector with these
output components.
PCA is a popular transform technique which result is not
directly related to a sole feature component of the original
sample. PCA has the potential to perform feature extraction,
that able to capture the most variable data components of
samples, and select a number of important individuals from
all the feature components. PCA has been successfully
applied on face recognition, image denoising, data
compression, data mining, and machine learning. The
majority of the applications of PCA are to use PCA to
transform samples into a new space and to use
lower-dimensional representation from the new space to denote the
sample
[15]. Implementation of the PCA method in face
recognition is called eigenfaces technique.
Turk and Pentland [16] presented the eigenfaces method
for face recognition in 1991. Face images were projecting
onto a face space defined by the eigenfaces, and the
eigenvectors of the set of faces not necessary corresponded
to isolated features such as eyes, ears, and noses. The
eigenfaces algorithm uses PCA for dimensionality reduction
in order to find the best account of vectors for the
distribution of face images within the entire image space
[17].
PCA has been widely investigated.
It
has become one of
the most successful approaches in face recognition and the
most fully characterized samples [18]. However, PCA has
some weaknesses, such as [19]:
•
Sensitive to illumination and expression,
•
Difficult
to
evaluate
the
covanance
matrix
accurately.
•
Could not capture even the simplest invariance
unless this information is explicitly provided in the
training data.
•
Without considering classes separability.
•
Essentially dependent on the gray-scale correlation
of image and so poor adaptability for the image
brightness and face posture variety.
•
Computationally expensive and complex with the
increase in dataset size.
The PCA method tends to find a projection matrix W
0P1,which maximize the determinant of the total scatter matrix
of the projected samples [21] as:
lwrs
wl
=
argmax
r
w
1wrswwl
(1)
where
Sr
is the total scatter matrixes:
c
Sr
=
L
(x; - µ)(x; - µ)r
(2)
[セQ@
The notation
µ
represents the mean feature vector of all
samples in training set and
x;is the i-th sample's feature
vector and c is the total number of the training samples.
The procedures of Principal Component Analysis consist
of two phases, training step and recognition step [20].
1)
Training Step:
This step is a process to get
eigenspace from training image which previously has been
changed into data matrix. Samples of data, on which the
system needs to recognize, are used to create an Eigen
Matrix which transforms the samples in the image space
into the points in eigenspace.
a) The image samples are taken as greyscale images
b) Transformed from 2D matrix to JD column vector
(N
2x
1 ).
c) Place the column vectors of n images to form the
data matrix (image set) X of N
2x n dimension
d) Compute the mean vector of data vectors in matrix
x
e) Normalize the vector of data matrix X with
subtracting by the mean vector
.f)
Compute the covariance matrix of the column
vectors:
as in (2).
g) Compute the
eigenvalues and corresponding
eigenvectors using (3):
The eigenvectors of the covariance
matrix should be found in order to reach the dimensionality
reduction [14]. The set of eigenvectors associated with the
eigenvalues. Set the order of the eigenvectors according to
their corresponding eigenvalues from high to low. This
matrix of eigenvectors is eigenspace. The vectors with
maximum variance vector in the data set represented by
highest eigenvalues of principal components [13].
(3)
h) Get the P by projecting the data matrix X onto the
eigenspace
P=WrX
(4)
2) Recognition Step:
This step is a process to get
eigenspace from test image Which previously has been
changed into data matrix. These results were then compared
with results from training phase to get minimum difference
a)
Convert the image I that will be recognized into ID
vector, and subtracting by mean.
b) Projecting onto same eigenspace.
c) Compute the Euclidean distance between image
recognized and all the projected samples in P:
The
minimum Euclidean distance value is represent the most
equivalent image.
B. Linear Discriminant Analysis (LDA)
The Linear Discriminant Analysis (LOA) or Fisher's
Linear Discriminant (FLO) approach is a widely used
method for feature extraction in face images. LOA is a
dimensionality reduction technique which is used for
classification problems. This approach tries to find the
projection direction in which, images belonged to different
classes are separated maximally. Mathematically, it tries to
find the projection matrix (the weights) in such a way that
the ratio of the between-class scatter matrix and the
within-class scatter matrix of projected images is maximized [22].
In contrast to algorithms based on PCA, LOA considers
class membership for dimension reduction. Key idea of
LOA is to separate class means of the projected directions
well while achieving a small variance around these means.
Alike PCA, the derived features of LDA are linear
combinations of the original data. As LOA reduces the data
efficiently onto a low dimensional space, it is suited for
graphical representation of the data sets [13].
LOA wants to solve an optimal discrimination projection
matrix W
0P1[21] as in (5):
lwrs wl
=
arg max
8w
1wrswwl
(5)
The basic steps in LOA are as follows:
a) Calculate within-class scatter matrix, S was
c
Sw
=
L
(x; - µk)(x; - µk;
f
(6)
i=l
b) Calculate between-class scatter matrix, S
8as
c
S
8=In;(µ;-µ)(µ; -µf
(7)
i=l
c) Calculate the eigenvectors of the projection matrix
(8)
d) Compare the test image's projection matrix with the
projection matrix of each training image by using a
similarity measure.
The result is the training image which is
the closest to the test image.
Sa
is the between-class scatter matrix,
Sw
is the
within-class scatter matrix,
Sr= Sa+
Swis the total scatter matrix,
The notation c is the total number of samples in whole
image set,
x;is the feature vector of a sample, and
µk,
is
vector of image class that
X;belongs to.
µ;
is the mean
feature vector of class
i,
and
n;is number of samples in
image class i.
The within-class scatter matrix, also called intra-personal,
represents variations in appearance of the same individual
due to different lighting and face expression. The
between-class scatter matrix, also called the extra-personal, represents
variations in appearance due to a difference in identity [23].
IV.
EXPERIMENTALSETUPIn order to evaluate the performance both of PCA and
FLO, a code for each algorithm has been generated using
Matlab. These algorithms have been tested using six set of
datasets which are COPPEDY ALE [24], FACE94, FACE95,
and FACE96 [25], JAFFE [26], and AT&T "The Database of
Faces" (formerly "The ORL Database of Faces") [27]. These
datasets are grouped into separated datasets which represent
set of disturbed images, as described in figure 1 and table
I.
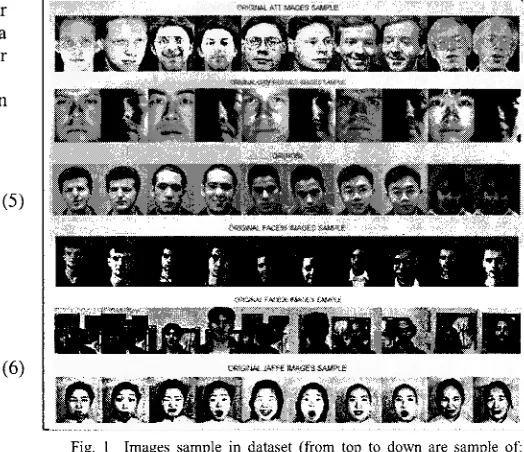
Fig. 1 Images sample in dataset (from top to down are sample of: ATT, CROPPEDY ALE, FACE94, FACE95, FACE96, and JAFFE dataset)
TABLE I. DATASET DESCRIPTION
Dataset Name Description Sample Total
Number lmaJ!e
ATT represents random 40 400
disturbance
CROPPEDY ALE set of image with 38 2414 I
different luminance I !
represents normal set of !
FACES94 images (without 152 3040 I
disturbance) I
- - - 1
representing set of
I
I
FACES95 images with different 72 1440
I
level of focus
I
representing set of :
FACES96 images with different 151 3016
I
[image:4.595.208.501.243.663.2] [image:4.595.244.506.250.476.2]Dataset Name Description Sample Total
Number Ima}!e
I represents different
JAFFE
expression of image 10 213
Fig. 2 Images sample in greyscale
Fig. 3 Normalized images define by I 0 image matrix - mean of all images in dataset
-0.32 -0.Dl 0.30 0.66 -0.17 -0.02 -O.D3 0.49 0.22 -0.25
-0.32 0.01 ·0.15 -0.61 0.18 0.19 -0.08 0.56 0.23 ·0.23
-0.32 -0.01 ·0.10 0.06 0.10 0.21 0.73 0.02 -0.53 -0.14
·0.32 O.Dl 0.08 -0.02 0.03 -0.13 ·0.61 0.00 ·0.69 ·0.13
·0.32 a.oz -0.44 -0.10 ·0.79 ·0.25 0.05 -0.06 0.05 0.07
-0.32 ·O.D2 ·0.04 0.12 -0.08 0.80 -0.23 -0.38 0.17 0.08
-0.32 0.00 0.64 ·0.33 ·0.09 ·0.22 0.15 ·0.43 0.19 ·0.28
-0.32 0.01 ·0.48 0.23 0.49 ·0.33 ·0.05 ·0.33 0.26 ·0.28
·0.32 0.71 0.11 0.01 0.17 -0.11 0.04 0.06 0.04 0.58
-0.32 ·0.71 0.08 ·0.01 0.16 ·0.14 0.03 0.06 0.05 0.58
Fig. 4 Sample of eigenvalue from 10 images using PCA Algorithm
L
セセ@
jl'f:&lle.•
セェ@
4
! '') .,.
セL@ iセセ@
- •f .. i
Fig. 5 Eigenspace from PCA
All images need to be converted into greyscale images
such in figure 2 and normalize images by subtracting
1D
matrix of images with mean of all images in dataset. The
result of normalized matrix is shown in figure 3.
0.00 0.00 0.00 0.00 0.00 0.00 0.00 0.00 0.00 0.00
E+OO E+OO E+OO E+OO E+OO E+OO E+OO E+OO E+OO E+OO
0.00 0.00 0.00 0.00 0.00 0.00 0.00 1.00 3.06 0.00
E+OO E+OO E+OO E+OO E+OO E+OO E+OO E+OO E-01 E+OO
0.00 0.00 0.00 0.00 0.00 0.00 1.00 3.10 3.14 0.00
E+OO E+OO E+OO E+OO E+OO E+OO E+OO E-02 E-01 E+OO
0.00 0.00 0.00 0.00 0.00 1.00 4.13 3.90 3.95 0.00
E+OO E+OO E+OO E+OO E+OO E+OO E-02 E-02 E-01 E+OO
0.00 0.00 0.00 0.00 1.00 1.32 9.99 9.44 9.55 0.00
E+OO E+OO E+OO E+OO E+OO E-01 E-02 E-02 E-01 E+OO
0.00 0.00 0.00 998 4.94 1.39 1.05 9.89 1.00 0.00
E+OO E+OO E+OO E-01 E-01 E-01 E-01 E-02 E+OO E+OO
0.00 0.00 2.95 1.00 4.61 1.30 9.77 9.23 9.33 0.00
E+OO E+OO E·Ol E+OO E·Ol E-01 E-02 E-02 E-01 E+OO
0.00 5.65 1.00 2.35 1.08 3.04 2.29 2.17 2.19 0.00
E+OO E·Ol E+OO E·Ol E-01 E-02 E-02 E-02 E-01 E+OO
4.99 1.00 4.52 1.06 4.90 1.38 1.04 9.80 9.91 4.99
E-01 E+OO E-01 E·Ol E-02 E-02 E-02 E-03 E-02 E-01
1.00 4.99 2.26 5.30 2.45 6.87 5.18 4.89 4.95 1.00
E+OO E·Ol E·Ol E-02 E-02 E-03 E-03 E-03 E-02 E+OO
Fig. 6 Sample of eigenvalue from 10 images using LOA Algorithm
There are differences between PCA and LDA in getting
the eigenvalue. In order to acquire eigenvalue using PCA
algorithm, total scatter matrix calculation must be taken. On
the other hand, eigenvalue using LDA algorithm obtained
from between-class scatter matrix and within-class scatter
matrix calculation. Figure 4 shows the eigenvalue by PCA,
and the eigenspace from PCA algorithm is shown in figure 5.
The images need to be projected onto the eigenspace to get
projected images using PCA.
Sw
and
S
8in LDA are calculated by (6) and (7) and use
projected images by PCA. Then, the eigenvalue such in
figure 6 and fisherspace are calculated. To get the projected
image in LDA, projecting image onto the eigenspace and
fisherspace is needed.
Projected images from train image will be compared to
projected image from test image. Then, Euclidean distance
calculated. Minimum value of Euclidean distance represents
the most equivalent image. Figure 7 and figure 8 show the
result of Euclidean distance which is yielded by both
algorithms.
1.11 1.46 2.54 3.62 1.69 1.96 5.01 4.64 8.66 8.63 E+l E+l E+l E+l E+l E+l E+l E+l E+l E+l 4 5 6 6 6 6 5 5 6 6
Fig. 7 Sample of Euclidean distance from 10 images using PCA Algorithm
1.4E +14
1.77 4.05 5.60 2.34 2.79 7.26 7.16 1.16 1.16 E+l
5 E+l
6 E+l
6 E+l
6 E+l
6 E+l
5
E+l 5
E+l 7
E+l 7
Fig. 8 Sample of Euclidean distance from 10 images using LOA Algorithm
Testing has been conducted with six different dataset.
The data set were grouped based on disturbance or condition
to determine the level of accuracy and time taken. The
numbers of testing images are 40% from total images in
every dataset which were randomly selected. Time taken
measures the process of covariance computation until the
minimum Euclidian distance yielded. The recognition rate
shows the accuracy of the methods.
V.
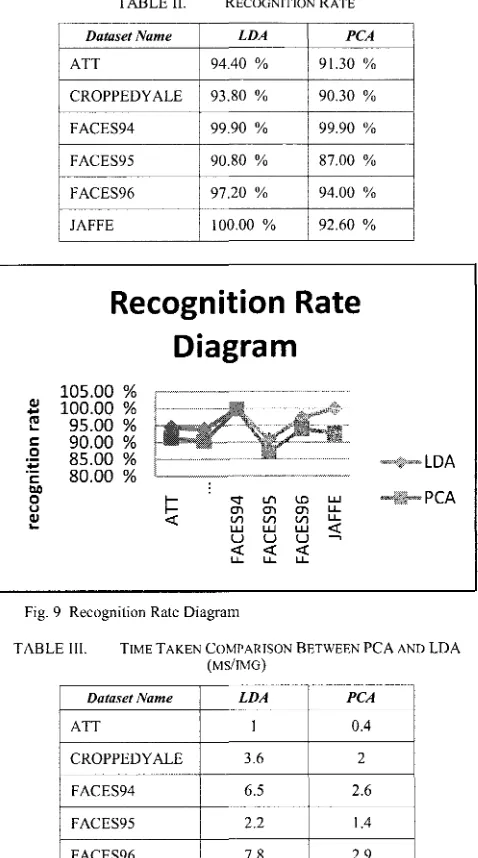
RESULT DISCUSSIONThe result of the overall experiments show that LDA is
better than PCA in recognition rate (accuracy), especially to
recognize face with expression disturbance. The PCA
algorithm only able to achieve levels of accuracy 92.60%,
while the LDA algorithm capable of achieving levels of
accuracy almost 100%. The recognition results are depicted
in Table II and Figure 8.
tィセ@recognition rate of LDA is
better than PCA because 'LDA deals directly with
discrimination between classes while PCA does not pay
attention to the underlying class structure. LDA takes into
consideration the within-classes scatter matrix but also the
between-classes scatter matrix. LDA applied to further
reduce the dimensionality of PCA.
In term of time taken, PCA tends to be much better than
LDA, especially to recognize images with background
disturbance. To get eigenvalue using LDA algorithm,
[image:5.595.265.508.268.374.2] [image:5.595.7.245.432.637.2]calculation of within-class scatter matrix and between-class
scatter matrix are needed. Meanwhile, there is only one step
to
get eigenvalue in PCA algorithm, which is to calculate one
scatter matrix. Therefore LDA algorithm needs more time
than PCA to extract feature. Time taken comparison between
PCA and LDA is depicted in Table Ill and Figure 9.
QJ
....
ltl
....
c
0
:.e
cbl)
0
u QJ
....
TABLE IL RECOGNITION RA TE
Dataset Name LDA PCA
ATT 94.40 % 91.30 %
CROPPEDY ALE 93.80 % 90.30 %
FACES94 99.90 % 99.90 %
FACES95 90.80 % 87.00 %
FACES96 97.20 % 94.00 %
JAFFE 100.00 % 92.60 %
Recognition Rate
Diagram
105.00 %
100.00 %
95.00 %
90.00 %
85.00 %
80.00 %
セ@
'<!" Lf"l \.D LUen en en u...
<t:
l/l l/l l/l u...LU LU LU セ@
u u u
<t:
<t:
<t:
u... u... u...
MセMloa@
_,..,.PCA
Fig. 9 Recognition Rate Diagram
TABLE III. TIME TAKEN COMPARISON BETWEEN PCA AND LOA (MS/JMG)
Dataset Name LDA PCA
ATT l 0.4
CROPPEDY ALE 3.6 2
FACES94 6.5 2.6
FACES95 2.2 1.4
FACES96 7.8 2.9
JAFFE 0.3 0.1
PCA has weaknesses in several disturbances, such as
luminance, background, and expression. Meanwhile, in
dataset without any disturbances such as F ACE94, PCA has
the same accuracy with LDA.
The projections of PCA are optimal for reconstruction
from a low dimensional basis, but they may not be optimal
from a discrimination standpoint.
It
shows in images with
luminance disturbance, when some variations between the
images of the same face due to luminance (within-class) are
almost larger than image variations due to change in face
identity (between-class).
Time Taken Comparison
Diagram
10
8 6
4
2
0
"-+-LDA
_,..,.PCA
Fig. I 0 Time taken comparison diagram between PCA and LOA
There appeared differences in time taken between PCA
and LDA, since LDA is continuation of PCA. The reason
why time taken between PCA and LDA in JAFFE almost
yielded same value is that it only used small number of
images sample (class number). This made iteration in mean
and
S8calculation decreased. And so, the difference of time
taken between PCA and LDA is smaller than any other
dataset which comprises many class numbers.
VI.
CONCLUSIONSA comparative performance analysis of Principal
Component Analysis (PCA) and Linear Discriminant
Analysis (LDA) was conducted on face recognition using
six datasets. Performance evaluation covers the time taken
and recognition rate for both methods. The result shows that
LDA is much better in recognition rate than PCA in overall
image with various disturbances. In time taken evaluation,
PCA is faster than LDA.
Disturbance and images number are the factors that affect
time taken and recognition rate. The best algorithm to
recognize image without disturbance is PCA, because in the
same recognition rate, PCA takes shorter time than LDA.
On the other hand to recognize image with disturbances,
LDA is better to use because it has better recognition rate
REFERENCES
[!) W. Zhao, R. Chellappa, P.J. l'hillips, and A. Rosenfeld, "Face Recognition: A Literature Survey," ACM Computing Surveys, vol. 35, 2003, pp. 399-458.
[2) S.Z. Li, R. Chu, M. Ao, L. Zhang, and R. He, "Highly Accurate and Fast Face Recognition Using Near Infrared Images," Proceeding of International Conference Advances in Biometrics, 2006, pp. 151-158.
[image:6.597.262.506.70.249.2] [image:6.597.8.247.104.533.2]Communication Control and Computing Technologies (ICCCCT), 2010, pp. 643 - 650.
[4] H. Cho and S. Moon, "Comparison of PCA and LDA Based Face Recognition Algorithms under Illumination Variations," ICROS-SICE International Joint Conference, 2009, pp. 4025-4030.
[5] F. Zuo and P. eter H.N. de With, "Real-time Embedded Face Recognition for Smart Home," IEEE Transactions on Consumer Electronics, vol. 51, Feb. 2005, pp. 183-190.
[6] J.P. Papa, AX. Falcao, A.L.M. Levada, D.C. Correa, D.H.P. Salvadeo, and N.D. a Mascarenhas, "Fast and Accurate Holistic Face Recognition Using Optimum-Path Forest," The 16th International Conference on Digital Signal Processing, Jul. 2009, pp. 1-6. [7] K.E. Gates, "Fast and Accurate Face Recognition Using Support
Vector Machines," Proceedings of the 2005 IEEE Computer Society Conference on Computer Vision and Pattern Recognition, 2005, pp. 163-163.
[8] S. Palanivel, B.S. Venkatesh, and B. Yegnanarayana, "Real Time Face Recognition System Using Autoassociative Neural Network Models," 2003 IBEE International Conference on Acoustics, Speech, and Signal Processing, 2003. Proceedings. (ICASSP '03)., 2003, pp. ll-833-6.
[9] S.-jen Lin, C.-yang Lee, M.-hsuan Chao, C.-sen Chiou, and C.-sing Yang, "The Study and Implementation of Real-Time Face Recognition and Tracking System," Proceedings of the Ninth International Conference on Machine Leaming and Cybernetics, 2010, pp. 11-14.
[IO] C. Cruz, L.E. Sucar, and E.F. Morales, "Real-Time Face Recognition for Human-Robot Interaction," 2008 8th IBEE International Conference on Automatic Face & Gesture Recognition, Sep. 2008, pp. 1-6.
[11] P. Michel and R. El Kaliouby, "Real Time Facial Expression Recognition in Video Using Support Vector Machines," Proceedings of the 5th international conference on Multimodal interfaces - ICM! '03, 2003, p. 258.
[12] L. Xie and J. Li, "A Novel Feature Extraction Method Assembled with PCA and !CA for Network Intrusion Detection," 2009 International Forum on Computer Science-Technology and Applications, vol. 3, 2009, pp. 31-34.
[13] M. Karg, R. Jenke, W. Seiber!, K. K, A. Schwirtz, and M. Buss, "A Comparison of PCA , KPCA and LDA for Feature Extraction to Recognize Affect in Gait Kinematics," 3rd International Conference
on Affective Computing and Intelligent Interaction and Workshops, 2009, pp. 1-6.
[14]
6.
Toygar and A. Acan, "Face Recognition Using PCA , LDA and !CA Approaches on Colored Images," Journal of Electrical &Electronic Engineering, vol. 3, 2003, pp. 735-743.
[15] F. Song, Z. Guo, and D. Mei, "Feature Selection Using Principal Component Analysis," 2010 International Conference on System Science, Engineering Design and Manufacturing Informatization, vol. !, 2010, pp. 27-30.
[16] B. Poon, M.A. Amin, and H. Yan, "PCA Based Face Recognition and Testing Criteria," Proceedings of the Eighth International Conference on Machine Learning and Cybernetics, Jul. 2009, pp. 2945-2949. [ 17] Z. Wang and X. Li, "Face Recognition Based on Improved PCA
Reconstruction," Proceedings of the 8th World Congress on Intelligent Control and Automation, 2010, pp. 6272-6276.
[18] J. Li, B. Zhao, and H. Zhang, "Face Recognition Based on PCA and LDA Combination Feature Extraction," The !st International Conference on Information Science and Engineering, 2009, pp. 1240-1243.
[19] C. Li, Y. Diao, H. Ma, and Y. Li, "A Statistical PCA Method for Face Recognition," Second International Symposium on Intelligent Information Technology Application, vol. 3, Dec. 2008, pp. 376-380. [20] Neerja, "Face Recognition Using Improved Fast PCA Algorithm,"
2008 Congress on Image and Signal Processing, 2008, pp. 554-558. [21] F. Ye, Z. Shi, and Z. Shi, "A Comparative Study of PCA, LDA and
Kernel LDA for Image Classification," 2009 International Symposium on Ubiquitous Virtual Reality, Jul. 2009, pp. 51-54. [22] R. Jafri and H.R. Arabnia, "A Survey of Face Recognition
Techniques," Journal of Information Processing Systems, vol. 5, Jun. 2009, pp. 41-68.
[23] A. George, "Multi-Modal Biometrics Human Verification using LDA and DFB," International Journal of Biometric and Bioinformatics (IJBB), vol. 2, 2008, pp. 1-9.
[24] available at:
http://vision.ucsd.edu/extyaleb/CroppedY aleBZip/CroppedY ale.zip [25] available at: http://cswww.essex.ac.uk/mv/allfaces/index.html [26] available at: http://www.kasrl.org/jaffe.html
[27] available at:
http://www.cl.cam.ac.uk/research/dtg/attarchive/facedatabase.html