Edisi April 2011 19
Muscle Growth and Distribution in Fa ening Steer of Diff erent Breeds
R. Priyantoa, * & E. R. Johnsonb
aDepartment of Animal Production and Technology, Faculty of Animal Science, Bogor Agricultural University Jln. Agatis, Kampus IPB Darmaga, Bogor 16680, Indonesia
bSchool of Veterinary Science, The University of Queensland Kenmore, Qld 4069, Australia
(Received 28-10-2010; accepted 01-02-2011)
ABSTRACT
The breed pa erns in growth and distribution of muscle were studied using three breeds of beef ca le entering fa ening phase. This study involved 23 grass-fed steer Brahman, 24 Hereford and 22
Brahman x Hereford crosses with a live weight range of 300 to 600 kgs. An allometric Huxley model
was used to study the growth and distribution pa erns of muscle tissue within wholesale cut. There were several cuts in which the muscle growth coeffi cients were signifi cantly diff erent among breeds.
Comparisons of muscle weight distribution at log natural of 75 kg side muscle + bone weight (4.313 kg)
generally showed signifi cant between-breed diff erences. Herefords tended to have more muscles in their
wholesale cuts than Brahmans and/or Brahman x Hereford crosses, except the muscles in Tenderloin, Rib Set and Chuck. Brahmans had heavier Topside and Silverside than Herefords and Brahman x
Hereford crosses and the diff erences were maintained at log natural of 114 kg side muscle + bone weight
(4.733 kg). At this heavier weight, there was a general tendency for Brahmans to have more muscle in their wholesale cuts than the Brahman x Hereford steers, except the muscle in Loin and Neck + Sticking.
Key words: steer, fa ening phase, muscle growth, muscle distribution
INTRODUCTION
Saleable beef yield and its distribution within carcass have been intensively studied (Priyanto et al., 1999; Mukai et al., 2004; Hafi d & Priyanto, 2006, Vieira et al., 2006; Priyanto et al., 2009). At lower fatness, it was reported that ca le with larger frame size had be er yield percentages of saleable beef, if compared to that with smaller frame size (Priyanto et al., 1999; Bidner et al., 2009). Such variations in beef yield were associated primarily with maturity type diff erences because of the diff erential growth pa erns of their carcass tissues (Priyanto et al., 1999; Priyanto et al., 2009). It is the carcass’ muscle contributing predominantly to the yield of saleable beef. Signifi cant between breed diff erences were reported in muscle growth and distribution when the muscle in wholesale cut was related to the total muscle within carcass despite the diff erences were relatively small (Shahin et al., 1993, Mc Gee et al., 2007).
Maturity type might be regarded as the fat-free carcass weight (carcass muscle + bone) at which ca le show a propensity to fa en. Purchas et al. (2002) used fat-free carcass weight as an eff ective adjustment factor
* Corresponding author:
Department of Animal Production and Technology, Faculty of Animal Science, Bogor Agricultural University
Jln. Agatis, Kampus IPB Darmaga, Bogor 16680, Indonesia
in breed comparison for muscularity and muscle to bone ratio. In relation to the exacting specifi cations of modern beef, such variations in muscle growth and distribution become commercially very important. The following study was undertaken to examine the infl uence of beef ca le breed on muscle tissue and its distribution throughout the wholesale cuts relative to fat-free carcass weight in fa ening steer.
MATERIALS AND METHODS
This study involved 69 grass-fed steers, comprising 23 Brahmans, 24 Herefords and 22 Brahman x Hereford Crosses which had enter, or were progressing along, their fat deposition phase. The steers were sequentially slaughtered at approximately 300, 400, 500, and 600 kg live-weight. All steers were fasted but access to water 24 hours prior to slaughter. Following dressing, the carcasses were divided into two sides, weighed and then chilled at 3 oC for 24 hours. The right sides were broken down into 15 wholesale cuts, namely thin fl ank, loin, tenderloin, rump, thick fl ank, topside, silverside, shank, point end (PE) brisket, navel end (NE) brisket, shin, blade, rib set, chuck, neck + sticking (AUS-MEAT, 2003). The cuts were then dissected into muscle, fat, intermuscular (IM) and subcutaneous (SC) fats, bone and connective tissue. The weights of the carcasses, the hot and chilled sides, wholesale cuts were recorded. All dissection products, including muscle, IM fat, SC fat, Media Peternakan, April 2011, hlm. 19-22
EISSN 2087-4634
Terakreditasi B SK Dikti No: 43/DIKTI/Kep/2008
20 Edisi April 2011
bone and connective tissue from each cuts were weighed and recorded. The computations of total muscle, muscle within wholesale cut and side muscle + bone weights were based on recovered weights of the right side.
Statistical Analysis
An allometric model, Y= αXβ(Huxley, 1932), was used to study the growth pa erns of the muscle tissue. In order to obtain a linear relationship, the equation was transformed into log natural form. Breed eff ects on the relationship between the weight of muscle in the wholesale cut and the weight of side muscle + bone were examined using the following model:
LnYij= Lnα + Brdi + βLnXij + β(Brd)i LnXij + Eij
Where
Yij = muscle weight in wholesale cut of the jth animal from the ith breed
α = intercept
Brdi = fi xed eff ect of the ith breed
Xij = side muscle + bone weight of the jth animal from the ith breed
β = regression coeffi cient of Yij on Xij
β (Brd)i= regression coeffi cient of the ith breed
Eij = residual error of the measurement of
Yij assumed to be normally distributed around a mean of zero with a variance of σ2
This analysis allowed comparisons of breed regres-sion coeffi cients as suggested by Kaps & Lamberson (2004), and estimates of dependent variables (Y’s) at a par-ticular independent variable (X). In order to obtain more
accurate results, the dependent variables were estimated using breed regressions at a particular X value and com-pared between breeds.
Because the carcass weight range covered both traditional (light weight) and specifi c (heavy weight) markets, it was of particular interest to compare the Y values at two diff erent values of the independent variable (X), one where the carcasses suitable for the traditional market and one where they were suitable for the specifi c (hotel, restaurant and institution) market. The traditional market prefer carcasses averaging 200 kg which correspond to 75 kg of side muscle + bone, while the specifi c market prefers carcasses averaging 300 kg or 114 kg side muscle + bone weight.
RESULTS AND DISCUSSION
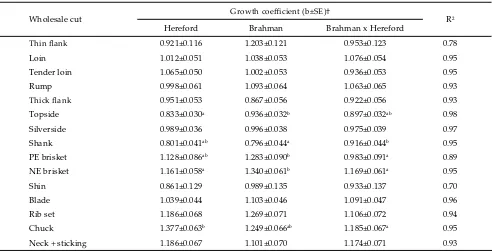
The use of side muscle + bone weight as a regressor in allometric relationships of tissues in the side and in the wholesale cuts is a sound basis for indicating maturity pa erns among breed types. Relative to side muscle + bone weight, muscle growth within wholesale cut showed few breed variations. There were several cuts in which the muscle growth coeffi cients were signifi cantly diff erent among breeds (Table 1) but the diff erences were small and did not follow any particular pa ern.
As shown in Table 2, comparison of muscle weight distribution at log natural of 75 kg side muscle + bone weight (4.313 kg) indicated that Herefords had signifi -cantly (P<0.05) more muscle in thin fl ank, loin, shank, brisket and blade than Brahmans and or Brahman x Hereford crosses. Conversely, the Herefords had sig-nifi cantly (P<0.05) less muscle in tenderloin, rib set and
Means in the same row followed by a diff erent le er diff er signifi cantly (P<0.05); the weights of muscle within wholesale cut and side muscle + bone expressed in kg; † All breed regression coeffi cients highly signifi cant (P<0.01).
Wholesale cut Growth coeffi cient (b±SE)† R2
Hereford Brahman Brahman x Hereford
Thin fl ank 0.921±0.116 1.203±0.121 0.953±0.123 0.78
Loin 1.012±0.051 1.038±0.053 1.076±0.054 0.95
Tender loin 1.065±0.050 1.002±0.053 0.936±0.053 0.95
Rump 0.998±0.061 1.093±0.064 1.063±0.065 0.93
Thick fl ank 0.951±0.053 0.867±0.056 0.922±0.056 0.93
Topside 0.833±0.030a 0.936±0.032b 0.897±0.032ab 0.98
Silverside 0.989±0.036 0.996±0.038 0.975±0.039 0.97
Shank 0.801±0.041ab 0.796±0.044a 0.916±0.044b 0.95
PE brisket 1.128±0.086ab 1.283±0.090b 0.983±0.091a 0.89
NE brisket 1.161±0.058a 1.340±0.061b 1.169±0.061a 0.95
Shin 0.861±0.129 0.989±0.135 0.933±0.137 0.70
Blade 1.039±0.044 1.103±0.046 1.091±0.047 0.96
Rib set 1.186±0.068 1.269±0.071 1.106±0.072 0.94
Chuck 1.377±0.063b 1.249±0.066ab 1.185±0.067a 0.95
Neck + sticking 1.186±0.067 1.101±0.070 1.174±0.071 0.93
Table 1. Allometric relationship between muscle weight of the wholesale cut (Y) and side muscle + bone weight (X), Ln Y = Ln a + b Ln X
Edisi April 2011 21
chuck than the other two breeds. Meanwhile, Brahman had signifi cantly (P<0.05) heavier muscle in the topside and silverside than Herefords and their cross-bred ca le. At this side muscle + bone weight, the total muscle weight for Herefords, Brahmans and Brahman x Hereford crosses were 59.96, 59.65, and 59.18 kg respectively.
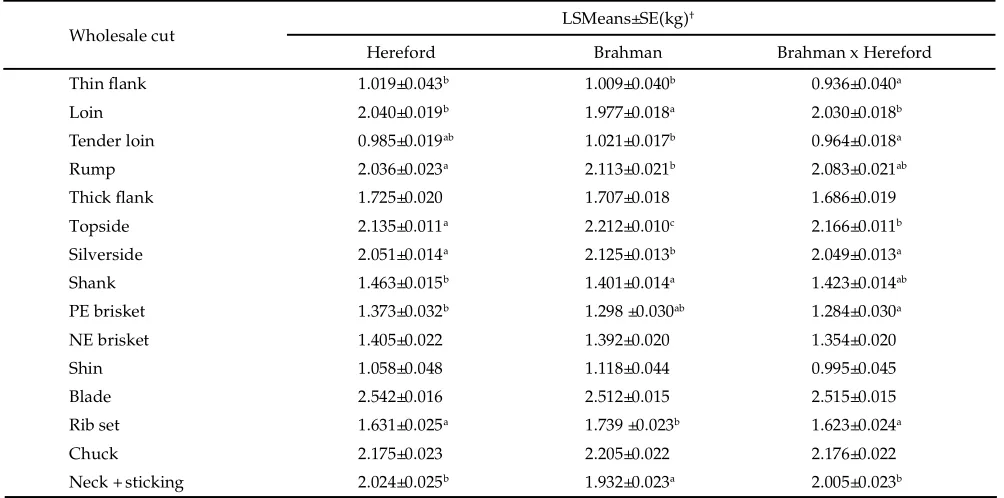
At the heavier muscle + bone weight (log natural of 114 kg or 4.733 kg), there was a general tendency for Brahmans to have more muscle in their wholesale cuts than Hereford and or Brahman x Hereford steers (Table 3). However, the Brahman had signifi cantly (P<0.05) less muscle in the loin and neck + sticking if compared with the other two breeds. Overall at this heavier muscle +
Means in the same row followed by a diff erent le er diff er signifi cantly (P<0.05); † Expressed in log natural value.
Table 2. Least-squared mean (LSMean) of muscle weight within wholesale cut adjusted to the overall mean of 4.313 kg side muscle + bone weight†
Wholesale cut LSMeans±SE(kg)
†
Hereford Brahman Brahman x Hereford
Thin fl ank 0.633±0.035b 0.505±0.040a 0.536±0.041ab
Loin 1.616±0.015b 1.542±0.018a 1.579±0.018ab
Tender loin 0.539±0.015a 0.601±0.017b 0.572±0.018ab
Rump 1.618±0.018 1.655±0.021 1.637±0.021
Thick fl ank 1.326±0.016 1.343±0.018 1.299±0.019
Topside 1.786±0.010a 1.819±0.010b 1.790±0.011a
Silverside 1.636±0.011a 1.707±0.013b 1.640±0.013a
Shank 1.127±0.012b 1.068±0.014a 1.038±0.015a
PE brisket 0.901±0.026b 0.760±0.030a 0.872±0.030b
NE brisket 0.919±0.017b 0.830±0.020a 0.863±0.020a
Shin 0.696±0.039 0.704±0.044 0.604±0.045
Blade 2.107±0.013b 2.049±0.015a 2.058±0.015a
Rib set 1.134±0.020a 1.207±0.023b 1.159±0.024ab
Chuck 1.598±0.019a 1.681±0.022b 1.679±0.022b
Neck + sticking 1.527±0.020 1.471±0.023 1.513±0.023
Means in the same row followed by a diff erent le er diff er signifi cantly (P<0.05); † Expressed in log natural value.
Table 3. Least-squared mean (LSMean) of muscle weight within wholesale cut adjusted to the overall mean of 4.733 kg side muscle + bone weight†
Wholesale cut LSMeans±SE(kg)
†
Hereford Brahman Brahman x Hereford
Thin fl ank 1.019±0.043b 1.009±0.040b 0.936±0.040a
Loin 2.040±0.019b 1.977±0.018a 2.030±0.018b
Tender loin 0.985±0.019ab 1.021±0.017b 0.964±0.018a
Rump 2.036±0.023a 2.113±0.021b 2.083±0.021ab
Thick fl ank 1.725±0.020 1.707±0.018 1.686±0.019
Topside 2.135±0.011a 2.212±0.010c 2.166±0.011b
Silverside 2.051±0.014a 2.125±0.013b 2.049±0.013a
Shank 1.463±0.015b 1.401±0.014a 1.423±0.014ab
PE brisket 1.373±0.032b 1.298 ±0.030ab 1.284±0.030a
NE brisket 1.405±0.022 1.392±0.020 1.354±0.020
Shin 1.058±0.048 1.118±0.044 0.995±0.045
Blade 2.542±0.016 2.512±0.015 2.515±0.015
Rib set 1.631±0.025a 1.739 ±0.023b 1.623±0.024a
Chuck 2.175±0.023 2.205±0.022 2.176±0.022
Neck + sticking 2.024±0.025b 1.932±0.023a 2.005±0.023b
22 Edisi April 2011
bone weight, the total muscle of Herefords, Brahmans and Brahman x Hereford crosses were 92.88, 93.55, and 91.55 kg respectively.
The present study indicated more muscle in the proximal hind limb region but less in the lumbar and shoulder regions from Brahman steer relative to Hereford steer and the breed diff erences were more apparent in the heavier side muscle + bone weight. Johnson et al. (2002) reported similar results that the larger Indicus steer tended to have more muscle particularly in the proximal hind limb if compared to the smaller British steers.
Despite several studies suggest that breed eff ects are not large enough to have any important infl uence on muscle weight distribution, noticeable diff erences in the muscle weight of combined cuts were observed when two extreme breed types were compared. Double-muscled type ca le were obviously superior in the deposition of muscle particularly in the proximal hind limb region if compared with normal ca le (Gotoh et al., 2009). Moreover, it was reported that the double-muscled ca le had almost twice the fi ber number of the normal ca le, indicating amore extensive hyperplasia of muscle fi bers during embryonic development (Wegner
et al., 2000).
At a similar maturity level, carcasses from large and small breeds diff er in their weights and sizes. Therefore, diff erences in maturity should be expected when muscle weight distribution between breeds is compared at a constant total side muscle + bone weight as used in this study.
Based on the demonstrated development of muscle from hind-limb to fore-limb (Priyanto et al., 2009), the smaller Hereford breed would have more muscle in the fore-limb while the larger Brahman breed would have more muscle in the hind-limb. In this study, because Brahmans were less mature than Herefords, the heavier muscle of the hind limb in the Brahman breed was not necessarily associated with superior muscle develop-ment in the region. Therefore, it was argued that breed diff erences in muscle weight distribution, especially in the proximal hind-limb, were not due to breed superior-ity in muscle development but rather to matursuperior-ity and size diff erences.
In the heavier weight of carcass side (165 kg), Hereford and Brahman had similar total muscle weights but they had obviously less total muscle if compared to Brahman x Hereford crosses (Priyanto et al., 1999). Meanwhile, this study indicated be er carcass muscling of Brahman steer relative to the cross-bred steer when adjustment was made at similar fat-free carcass weight (maturity). The remarkably faster growing fat relative to muscle in fa ening steer as reported by Priyanto et al. (2009) suggest earlier mature of Brahman relative to Brahman x Hereford cross breeds. Therefore, at similar carcass weight the Brahman steer would have deposited more carcass fat and consequently contained less carcass muscle.
CONCLUSION
In fa ening steer, there were signifi cant diff erences in muscle growth coeffi cient of several cuts. However,
the diff erences were small and did not follow any particular pa ern. At constant side muscle + bone weight, breed diff ered signifi cantly in muscle weight distribution and the diff erences were more apparent in the heavier side muscle + bone weight. The breed diff erences in muscle weight distribution, especially in the proximal hind-limb, were not necessarily associated with breed superiority in muscle development but rather to maturity and size diff erences.
REFERENCES
AUS-MEAT. 2003. Technical Manual of Australian Meat.
Australian Meat and Livestock Corporation, Sydney. Meat Animals.
Bidner, T. D., P. E. Humes, W. E. Wya , D. E. Franke, M. A. Persica, G. T. Gentry, & D. C. Blouin. 2009. Infl uence of Angus and Belgian Blue bulls mated to Hereford x Brahman cows on growth, carcass traits, and longissimus steak shear force. J. Anim Sci. 87:1167-1173.
Gotoh, T., E. Albrecht, F. Teuscher, K. Kawabata, K. Sakashita, H. Iwamoto, & J. Wegner. 2009. Diff erences in muscle and fat accretion in Japanese Black and European ca le. Meat
Sci. 82: 300–3008.
Hafi d, H. & R. Priyanto. 2006. Pertumbuhan dan distribusi potongan komersial karkas sapi Australian Commercial Cross dan Brahman Cross hasil penggemukan. Med. Pet. 29: 63-69. Pertanika J. Trap. Agric. Sci. 25: 19–26.
Kaps, M.& W. R. Lamberson. 2004. Biostatistics for Animal Science. CABI Publishing, Oxfordshire.
Mc Gee1, M., M. G. Keane, R. Neilan, A. P. Moloney, & P. J. Caff rey. 2007. Body and carcass measurements, carcass conformation and tissue distribution of high dairy genetic merit Holstein, standard dairy genetic merit Friesian and
Charolais x Holstein-Friesian male ca le. Irish J. Agric.
Food Res. 46: 129-147.
Mukai, F., M. Sadahira, & T. Yoshimura. 2004. Comparison of
carcass composition among Japanese Black, Holstein and
their crossbred steers fa ening on farm. Anim. Sci. J. 75:
393-399.
Priyanto, R., E. R. Johnson, & D. G. Taylor. 1999. The eco-nomic importance of genotype in steers fed pasture or lucerne hay and prepared for the Australian and Japanese beef markets. NZ Journal of Agric. Res. 42: 343-404.
Priyanto, R., E. R. Johnson, & D. G. Taylor. 2009. The growth
pa erns of carcass tissues within wholesale cuts in fa
en-ing steer. J. Ind. Trop. Anim. Agric. 34: 153-158.
Purchas, R. W., A. V. Fisher, M. A. Price, & R. T. Berg. 2002. Relationships between beef carcass shape and muscle to bone ratio. Meat Sci. 61: 329-337.
Shahin, K. A., R. T. Berg, & M. A. Price. 1993. The eff ect of
breed-type and castration on muscle growth and
distribu-tion in ca le. Livestock Prod. Sci. 33: 43-54.
Vieira, C., A. Cerdeno, E. Serrano, & A. R. Mantecon. 2006.
Adult steer for beef production : Breed eff ect on animal
performance, retail yield and carcass quality. Czech J. Anim. Sci. 51:467-474.
Wegner, J., E. Albrecht, I. Fiedler, F. Teuscher, H. J. Papstein,
& K. Ender. 2000. Growth- and breed-related changes
of muscle fi ber characteristics in ca le. J. Anim. Sci. 78:
1485-1496.