DOI: 10.12928/TELKOMNIKA.v13i3.1735 1047
Expert System Modeling for Land Suitability Based on
Fuzzy Genetic for Cereal Commodities: Case Study
Wetland Paddy and Corn
Fitri Insani*1, Imas Sukaesih Sitanggang2, Marimin3
1,2
Department of Computer Science, Faculty of Natural Science and Mathematics, Bogor Agricultural University, Bogor 16680, Indonesia
3
Department of Agroindustrial Technology, Faculty of Agricultural Technology, Bogor Agricultural University, Bogor 16680, Indonesia
*Corresponding author, e-mail: [email protected], [email protected], [email protected]
Abstract
Nowadays, threat of food shortages is happen in Indonesia. Most of crops that are consumed as main food are cereals commodities. Cereals cultivation often experiences some problems in determining whether land is suitable or not for the crops. Expert system can help researcher and practitioners to identify land suitability for cereal crops. In this research, an expert system model of land suitability for cereals crop was built. The model implemented soft computing methods to develop inference engine which combines fuzzy system and genetic algorithm. There are 16 parameters to define land suitability which consists of 12 numeric parameters and 4 categorical parameters. Two types of cereal crops that were used in this study namely wetland paddy and corn. Trapezoid membership function was used to represent fuzzy sets for numerical parameters. Genetic algorithm was used for tuning the membership function of fuzzy setfor land suitability which consists of very suitable (S1), quite suitable (S2), marginal suitable (S3) and not suitable (N). This expert system is able to choose land suitability classesfor cereals using the fuzzy genetic model with accuracy of 90% and85% for corn and wetland paddy respectively.
Keywords: cereal, expert system, fuzzy, genetic algorithm, land suitability evaluation
Copyright © 2015 Universitas Ahmad Dahlan. All rights reserved.
1. Introduction
Indonesia is facing food shortage problem. Cultivation areas decrease each year as an impact of uncontrollable land conversion to nonagricultural areas [1]. Because of that, farmers must optimize their existing land to produce crops effectively. Most of Indonesian crops are cereals. Cultivation of cereals often experiences many problems such as difficulties to determine whetherthe land is suitable or not for several species of cereals whereas crop productivity depends on its land quality. Meanwhile, farmers lack of knowledge about land characteristics and suitability for their crops. In addition, it also need long time to determine land suitability. Therefore an expert system is needed to simplify a process to evaluate land suitability for cereals crops. Expert systems which include knowledge from experts can help farmers and agricultural executive to determine suitability of land [2, 3].
In this research the problem to be covered is how to make a model of expert system for land suitability evaluation based on soft computing for cereal commodities by combining fuzzy systemand genetic algorithm. The combination of these two methods has been implemented for solving an electromagnetic field problem [4], formedical data classification [5], and for crew grouping [6]. Some other specific researches about fuzzy and genetic algorithm have also done by previous research [7-8].
This research was limited for two commodities cereals named wetland paddy and corn with the case study in Bogor. However the expert system model can be improved for other species of crops by modifying its parameters.
2. Research Method
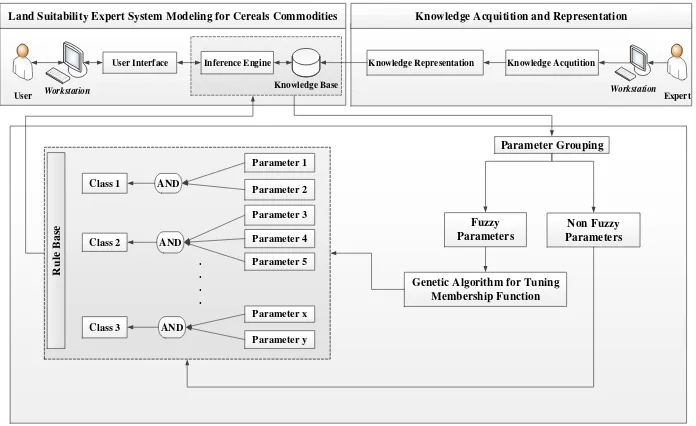
This system contains two components namely fuzzy system and genetic algorithm. The system framework can be seen in Figure 1. Knowledge resource of the system is obtained from soil and land experts from Department of Soil Science and Land Resources, Bogor Agricultural University and Indonesian Center for Agricultural Land Resources Research and Development, Ministry of Agriculture. Knowledge resource is also obtained from text books regarding Land Suitability Evaluation. The knowledge is used as input values in inference engine and training data for tuning fuzzy membership function.
User Workstation
User Interface Knowledge Acqutition
Workstation
Land Suitability Expert System Modeling for Cereals Commodities
Expert
Fuzzy is used in the inference system to represent human knowledge which not always exactly true or false. Fuzzy can represent values of variable using membership degree such as very bad, bad, moderate, good, and very good. In case of the land suitability system, not all variables are represented in fuzzy set, only some of them can be represented as fuzzy variables such as temperature, humidity, and rainfall. Some other variables are not represented as fuzzy variables because input values from experts and textbook are not numerical values but in ordinal values such as low, moderate, and high without knowing its values. The non-fuzzy variables are drainage, texture and erosion risk. The two kind variables (fuzzy and non-fuzzy) are separated because the fuzzy variables will be tuned using Genetic Algorithm (GA). But the non-fuzzy variables are not processed using GA. The two kind variables are combined in the next step after GA tuning.
The fuzzy approach used in this system is Sugeno. We adopts this approach because the purpose of this system is to produce classes of land suitability which consists of S1, S2, S3, and N.S1 means “very suitable”, S2 means “quite suitable”, S3 means “marginally suitable”, and N means “not suitable”. Those values form consequence of fuzzy rule. For simplicity, the land suitability classes represented as 1 for S1, 2 for S2, 3 for S3, and 4 for N.
there are about 415 (about one billion) rules generated. It results high computation cost for the system especially in applying the genetic algorithm.To solve this problem, the 15 variables are categorized into six groups: temperature, rooting media, nutrient retention, erosion, flood pool, and land preparation [9]. If each group has 2 variables and each group has 4 MF, there are 42 = 16 rules in a group which need low computation cost for the system to process such number of rules.
2.2. Genetic Algorithm
These worktunes fuzzy membership functions using natural selection and genetic mechanism called the genetic algorithm [6], [10-12]. It is used to optimize fuzzy membership functions. Figure 2 shows a usual genetic algorithm (GA) stage which consists of initialization, evaluation, selection, crossover, and mutation [13]. The GA stage of this system was done for each group of land suitability parameters to increase the system performance.
Figure 2. Genetic algorithm process
2.2.1. Individual Representation
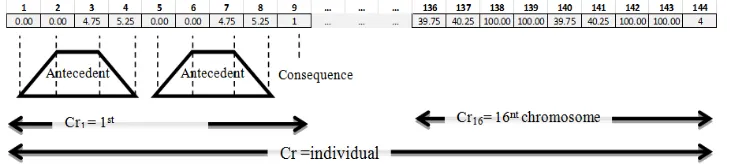
The main problem of GA is how to represent a problem into a chromosome or individual. The individual representation can be seen in Figure 3. The figure shows single individual design. The individuals formed by several genes in which the process is described as follows: An individual Cr represents a fuzzy rule set. In other word, each individual contains several rules. Lets define each rule as Cri chromosome, where the number of Crishows the
number of rules. Cri is called as a chromosome because this is a piece of individual.
A rule (single Cri) contains variables which are separated to antecedences and a
consequence. As described in section 2.1, antecedence is trapezoidal forms meaning that each variable needs four genes (four points). The gene number needed in a chromosome is based on the number of its variable. So the number of genes in a chromosome (single rule) is (4 × n) +1, where n is number of variables. In this case there are four points of trapezoid, and one variable of the consequence. The total gene for an individual can be calculated using this formula ((4 × n) +1) × r, where r is the number of rules. For example, in Figure 3 we have fuzzy set of 16 rules and 2 variables, the total genes needed to represent the rule set is (( 4 × 2) + 1) × 16) = 144 genes.
Figure 3. Individual and chromosome representation
2.2.2. Initialization
population. The first individual was created based on information from references and/or experts and the P- 1 individuals were generated randomly.
2.2.3. Evaluation
Each individual is evaluated using a fitness function to get their fitness value. Fitness function used in this case is mean square error (MSE). First, each individual generated in the initialization stage or recombination result (crossover and mutation) is converted to a fuzzy rule set. Then training data are tested to each individual so that the number of false class for each individualis obtained. The number of false class is used to calculate the MSE. Because the evaluation value is an error value, smaller evaluation value indicates better individual result.
2.2.4. Selection
Selection is a method to choose parents to be crossed over or mutated. To maintain several best individuals, elitism was done by choosing at least 10% of population from the best individuals of the initial population or recombined population. 90% remaining needed individuals are selected randomly using the roulette wheel approach.
2.2.5. Crossover
Crossover which is used in this system is max-min-arithmetical crossover [14]. The number of individuals selected is based on the probability of crossover (Pc). Pc along with Pm (probability of mutation) was determined at the beginning of GA. If and are crossed, we generate four new individuals:
1 1
, ′ , ′
is either a constant, or a variable whose value depends on the age of the population. The resulting offspring are the two best of the four individuals above.
All children as crossover results are combined with the parents. The combination of parents of children is called intermediate population. The intermediate population is set as parent for the next stage i.e mutation.
2.2.6. Mutation
Several genes of intermediate population were selected randomly as mutation objects. The number of genes selected is based on Pm. Pm is mutation probability of entire genes in population. Mutation was done by shifting the selected gene to the left or right. The left and right shifting barrier is determined by following formulas:
ckl = ck (ckck-1)/2;
ckr = ck + (ck+1ck)/2;
Where ckl: left shifting limit; ckr: right shifting limit; ck: mutated gene value; ck-1 : the left gene of
ck; ck+1 : the right gene of ck.
For each gene selected, the direction of the mutation is determined using a random value. If the random value produces 0 then the gene shifting direction is to the left, but if the random value produces 1 then the gene shifting direction is to the right. The shifting distance of the gene is determined by following formula:
′ ∆ , ∆ , ;;
2.3. Rule Based
As shown in Figure 1, all non-fuzzy parameters and fuzzy parameters that have been tuned in previous stages were combined using if-then rule base. The determination factor of land suitability is gained by looking at the worst value of the parameter. For example, if the classes of 5 variables (both fuzzy and non-fuzzy variables) are S1, S1, S2, S3, S1, then we know that the worst value is S3. So it can be determined that the final class of the 5 variables is S3.
2.4. Results and Analysis
We carry out experiments for wetland paddy and corn with the following parameters: a) Population size: 20
b) Probability of crossover: Pc = 0.6, = 0..35
c) Probability of mutation: Pm = 0.1
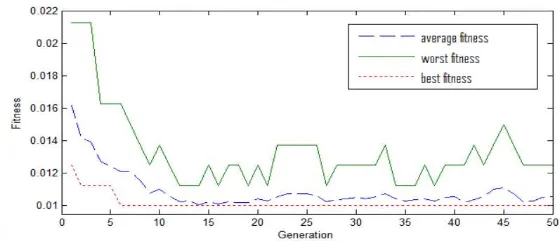
Figure 4 and Figure 5 provide the fitness values for wetland paddy and corn respectively. The figures show that the best and average fitness were getting better until 15th generation and then it reach its convergence. However, the worst fitness keeps fluctuating that may be caused by the mutation process that does not always return better results.
Figure 4. Fitness valuesfor wetland paddy
Figure 5. Fitness values for corn
The variations of Pc and Pm also affect to the fitness results. Table 1 and Table 2 show the fitness of Pm variations of wetland paddy and corn respectively.
Table 1. Effect of Pm variation to the tuning result of wetland paddy
Experiment Pc Pm Last Best Fitness Last Average Fitness
1 0.6 0.001 0.010000 0.010000
2 0.6 0.010 0.010000 0.010063
Table 2. Effect of Pm variation to the tuning result of corn
Experiment Pc Pm LastBest Fitness Last Average Fitness
1 0.6 0.001 0.017500 0.020375
2 0.6 0.010 0.010000 0.012125
3 0.6 0.100 0.010000 0.010500
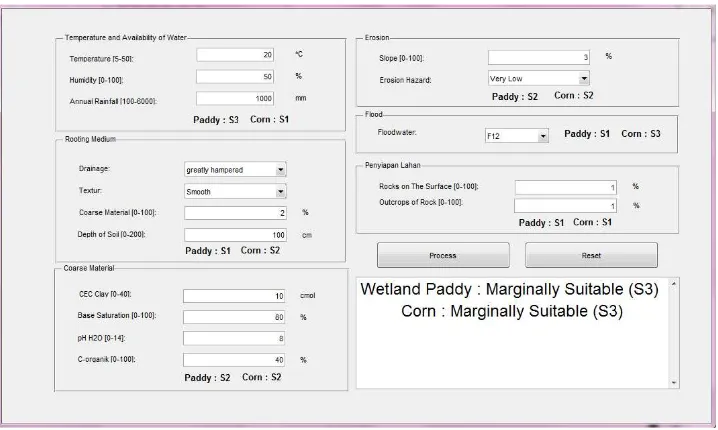
The best Pm and Pc were used to create a land suitability system. The main page of Land Suitability system can be seen in Figure 6. A user needs to fill land parameter values in the form then the system displays output in the right bottom side. The result is not only for single commodity but it may show multiple land suitability both for corn and wetland rice.
Figure 6. The main page of the Land Suitability System
The system has been tested by comparing its output and land suitability judgement from experts. 20 land suitability data of wetland rice and corn from expert shows that 85% of the system output is appropriate to the expert estimation for wetland rice commodity, meanwhile 90% is appropriate for corn commodity.
3. Conclusion
This work developed a model of soft computing based expert system that combine fuzzy system and genetic algorithm to determine land suitability for cereals commodity. Genetic algorithm was used to tune membership functions by adding new actual data. By using the actual data as training data, the system can improve its inference engine to get better result. By experimenting variations of Pm, we get different best result between corn and wetland paddy, best result for wetland paddy were produced by Pm 0.001 and best result for corn were produced by Pm 0.1. This expert system is able to determine the land suitabilityclasses of cereals using the fuzzy genetic model with accuracy of 90% for corn and 85% for wetland paddy.
References
[1] Direktorat Riset dan Kajian Strategis Institut Pertanian Bogor. Perspektif Baru Pembangunan untuk Menanggulangi Krisis Pangan dan Energi. Bogor. Institut Pertanian Bogor. 2008: 1-103.
[2] Sevani N, Marimin, Sukoco H. Sistem Pakar Penentuan Kesesuaian Lahan Berdasarkan Faktor Penghambat Terbesar (Maximum Limitation Factor) Untuk Tanaman Pangan. Jurnal Informatika. 2009; 10(1): 23-31.
[3] Hartati S, Sitanggang IS. A Fuzzy Based Decision Support System for Evaluating Land Suitability and Selecting Crops. Journal of Computer Science. 2010; 6(4): 417-424.
[4] Damousis IG, Satsios KJ, Labridis DP. Combined Fuzzy Logic And Genetic Algorithm Techniques-Application to An Electromagnetic Field Problem. Fuzzy Sets and Systems. 2002; 129(3): 371-386. [5] Dennis B, Muthukrishnan S. AGFS: Adaptive Genetic Fuzzy System for Medical Data Classification.
Applied Soft Computing. 2014; 25: 242-252.
[6] Cordon O, Herrera F, Villar P. Generating the Knowledge Base of a Fuzzy Rule-Based System by the Genetic Learning of the Data Base. IEEE Transactions on Fuzzy Systems. 2001; 9(4): 667-674. [7] Casillas J, Cord´on O, del Jesus M, Herrera F. Genetic tuning of fuzzy rule deep structures preserving
interpretability and its interaction with fuzzy rule set reduction. IEEE Transactions on Fuzzy Systems.
2005; 13(1): 13-29.
[8] Wang Y, Chen L, Chen Z. A Fuzzy Self-tuning Controlled Feeding Servo System of Machine Tool.
TELKOMNIKA Indonesian Journal of Electrical Engineering. 2013; 11(5): 2351-2358.
[9] Djaenuddin D, Marwan H, Subagyo H. Hidayat A. Petunjuk Teknis Evaluasi Lahan Untuk Komoditas Pertanian. Bogor: Balai Besar Litbang Sumberdaya Lahan Pertanian. Badan Litbang Pertanian. Departemen Pertanian. 2011: 1-154.
[10] Herrera F, Lozano M, Verdegay JL. Tuning Fuzzy Logic Controllers by Genetic Algorithms.
International Journal of Approximate Reasoning. 1995; 12: 299-315.
[11] Casillas J, Cord´on O, del Jesus M, Herrera F. Genetic tuning of fuzzy rule deep structures preserving interpretability and its interaction with fuzzy rule set reduction. IEEE Transactions on Fuzzy Systems. 2005; 13(1): 13-29.
[12] Qin G, Ma H. An Intelligent Course Scheduling Model Based on Genetic Algorithm. TELKOMNIKA Indonesian Journal of Electrical Engineering. 2014; 12(4): 2985-2994.
[13] Eiben AE, Smith JE. Introduction to Evolutionary Computing. Natural Computing Series. New York: Springer. 2003: 1-301.