11 CHAPTER II
THEORITICAL BACKGROUND
2.1 Literature Review
Liquidity is important for both individuals and companies. While a person
may be rich in terms of total value of assets owned, that person may also end up in
trouble if he or she is unable to convert those assets into cash. The same holds true
for companies. Without cash coming in the door, they can quickly get into trouble
with their creditors. Banks are important for both groups, providing financial
intermediation between those who need cash and those who can offer it, thus
keeping the cash flowing. An understanding of the liquidity of a company's stock
within the market helps investors judge when to buy or sell shares. Finally, an
understanding of a company's own liquidity helps investors avoid those that might
run into trouble in the near future.
2.1.1 Liquidity
12
versa. Illiquidity is driven by theexplicitand implicit costs of buying or selling thestock.
There are, of course, various assets in a company ranging from their most expensive prototype machinery materials if we are talking about advanced manufacturing company to the usual job desk and all of them could be converted into cash. The point is that there are degrees of liquidity when it comes to investment called the liquidity spectrum. An investment can be placed on a spectrum according to its level of liquidity, with cash at one end and less liquid alternative investments at the opposite end.
More Liquid Less Liquid
[image:2.595.87.526.282.624.2]Cash Savings Accounts Investment Accounts Securities Physical Assets
Figure 2.1 Liquidity Spectrum Source: www.bized.co.uk
13
There is no specific liquidity formula; however, liquidity is often calculated by using liquidity ratios. It is safer to invest in liquid assets than illiquid ones because it is easier for an investor to get his/her money out of the investment. Examples of assets that are easily converted into cash include blue chip and money market securities.
2.1.2 Liquidity Risk and Premium
Liquidity risk is the risk that a given security or asset cannot be traded quickly enough in the market to prevent a lossor make the required profit for that matter.Liquidity risk arises from situations in which a party interested in trading an asset cannot do it because nobody in the market wants to trade for that asset. Liquidity risk becomes particularly important to parties who are about to hold or currently hold an asset, since it affects their ability to trade.Liquidity risk can be divided into funding (cash-flow) or market (asset) liquidity risk. The first one
tends to manifest as a credit risk: inability to fund liabilities produces defaults, and
the latter manifests as market risk: inability to sell an asset drives its market price
down, or worse, renders the market price indecipherable. Market liquidity risk is a
problem created by the interaction of the seller and buyers in the marketplace. If
the seller's position is large relative to the market, this is called endogenous
liquidity risk.If the marketplace has withdrawn buyers, this is
called exogenous liquidity risk.
14
asset is worthless. However, if one party cannot find another party interested in trading the asset, this can potentially be only a problem of the market participants with finding each other. This is why liquidity risk is usually found to be higher in emerging markets or low-volume markets.Liquidity risk is financial risk due to uncertain liquidity. An institution might lose liquidity if its credit rating falls, it experiences sudden unexpected cash outflows, or some other event causes counterparties to avoid trading with or lending to the institution. A firm is also exposed to liquidity risk if markets on which it depends are subject to loss of liquidity.
Whileliquidity premium is a term used to explain a difference between two types of financial securities (e.g. stocks), that have all the same qualities except liquidity. Liquidity premium is a segment of a three-part theory that works to explain the behavior of yield curves for interest rates. The upwards-curving component of the interest yield can be explained by the liquidity premium. The reason behind this is that short term securities are less risky compared to long term rates due to the difference in maturity dates. Therefore investors expect a premium, or risk premium for investing in the risky security. Liquidity risk premiums are recommended to be used with longer term investments, where those particular investments are illiquid.
15
prices of two assets, which are similar in all aspects except liquidity, is called the liquidity premium.For example, an investor is looking at purchasing one of two corporate bonds, each with the same coupon payments, and time to maturity.
If one of these bonds is traded on a public exchange, while the other is not, the
investor will not be willing to pay as much for the non-public bond.
2.1.3 Excess Stock Return
Investopedia explain excess stock return or also known as alpha (investment) as investment returns from a security or portfolio that exceed a benchmark or index with a similar level of risk. It is widely used as a measure of
the value added by the portfolio or investment manager. Besides an investment manager simply making more money than a passive strategy, there is another problem, although the strategy of investing in every stock appeared to perform better than 75% of investment manager, the price of the stock market as a whole fluctuates up and down, and could be on a downward decline for many years before returning to its previous price.
16
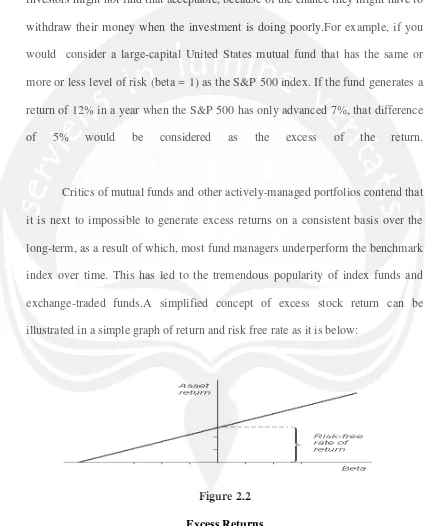
Investors can use both alpha (excess stock return) and beta to judge a company's performance. If the company has had a high alpha, but also a high beta, investors might not find that acceptable, because of the chance they might have to withdraw their money when the investment is doing poorly.For example, if you would consider a large-capital United States mutual fund that has the same or
more or less level of risk (beta = 1) as the S&P 500 index. If the fund generates a
return of 12% in a year when the S&P 500 has only advanced 7%, that difference
of 5% would be considered as the excess of the return.
Critics of mutual funds and other actively-managed portfolios contend that
it is next to impossible to generate excess returns on a consistent basis over the
long-term, as a result of which, most fund managers underperform the benchmark
index over time. This has led to the tremendous popularity of index funds and
exchange-traded funds.A simplified concept of excess stock return can be
[image:6.595.87.515.176.702.2]illustrated in a simple graph of return and risk free rate as it is below:
17
The graph above is illustrate that the on the right hand side of the slope is risk free rate of return. It is the U.S Treasury bills or if in Indonesia, the BI (Bank Indonesia) rate or simply the interest rate which is in Indonesia as of 2014 is 7.5%. On the right hand side, below the diagonal line is the risk free area and above that is the excess return which you can get after you subtract the asset return with the interest rate (if it is in Indonesia).
2.1.4Measures of Liquidity
There are various ways of measuring liquidity, namely from trading volume, turnover, and so on. Baker (1996) stated in his research that various measures of liquidity lead to conflicting results when examining the liquidity of a
financial market.Pam Newman in her site
(http://www.entrepreneur.com/article/187606) mentions that there are two mainfinancial ratios used to measure a company's liquidity ratio which are current ratio equals current assets divided by current liabilities and quick ratio equals current assets (less inventory) divided by current liabilities.But when talking about liquidity, there are various types of measuresaside from those two mentioned above. To name some of them which are:
2.1.4.1Absolute Measures
18
at the end of the year is $85, the absolute measure of forecasting error if $5 per share. If another analyst forecast a value of $80, this forecast has the same $5 absolute measure of error; absolute measures take the form of positive numbers, regardless of whether they represent high or low estimations.
Absolute measures of dispersion are expressed in same units in which original data is presented but these measures cannot be used to compare the variations between the two series. Relative measures are not expressed in units but it is a pure number. It is the ratios of absolute dispersion to an appropriate average such as co-efficient of standard deviation or co-efficient of mean deviation.Absolute measure dispersion encompasses the following:range, quartile deviation, meandeviation, standard deviation, and Lorenzcurve.
2.1.4.2 Relative Measures
19
encompasses the following:coefficient of range, coefficient ofquartile deviation, coefficient of mean deviation, and coefficient of variation.
2.1.4.3 Turnover Ratio
There is also other method that‟s more commonly used in
calculating the liquidity in general. One commonly used measure of stock performance is the stock turnover rate. This rate indicates the number of times the stock in a business has 'turned over', or been replaced, in a year. The lower the rate, the longer the stock is taking to turn over. Funds are invested in stock for longer periods, which, in turn, has an adverse effect on cashflow.For example, a stock index fund will have a low turnover rate, but a bond fund, whether passively or actively managed, will have high turnover because active trading is an inherent quality of bond investments. An aggressive small-cap growth stock fund will generally experience higher turnover than a large-cap value stock fund.
[image:9.595.87.517.178.564.2]20 2.1.4.4 Impact Cost
Market impact cost is a measure of market liquidity that reflects the cost faced by a trader of an index or security. The market impact cost is measured in the chosen number of the market, and is how much additionally a trader must pay over the initial price due to market slippage, i.e. the cost incurred because the transaction itself changed the price of the asset.Market impact costs are a type of transaction costs.
Concept of impact cost as measure of liquidity was introduced in Indian marketsrecently (Shah, 1996 and Thomas, 1998). It represents improvement over traditionalmeasures like volume orfrequency of trading. Basically this measure takes into accountinstitutional features of the screen based trading environment wherein structure of order bookwould represent liquidity.
2.1.4.5 Elasticity of Trading
21
Themainadvantage is it can be computed by anyone who has access to information onprices andvolumes of trading data.
2.1.4.6 Trade Frequency/Volume
Investopedia explains stock volume as the number of shares or
contracts traded in a security or an entire market during a given period of
time. It is simply the amount of shares that trade hands from sellers to
buyers as a measure of activity. If a buyer of a stock purchases 100 shares
from a seller, then the volume for that period increases by 100 shares
based on that transaction.
This method is the simplest in the logic that more frequently trading would equal high liquidity but with such an indicator it isnot possible to measure extent of liquidity among frequently traded shares.Gupta (1992)has used this measure to detect speculative trading.However, it would bedifficult to assess liquidity only with reference to absolutevolume of shares traded. A relativemeasure could be the ratio of traded volume to total number of shares issued which enablescomparison across different portfolio. Although, number of sharesactually available for tradingare different from number of shares issued because of which normally are not traded.Because of that, floating stock will belower than thetotal issued shares.
22
adjustmentswould becompany specific and it would be difficult to do such adjustments attheaggregate level. Moreover, stock prices, anticipated or actual, are linked todemand for stocksand the extent of trading volumes.
2.2 Previous Research
There are a few research of similar nature in which we found complements the idea of this research. Zimmerman and Keel (2004), in their research Measuring and Predicting Liquidity in the Stock Market, which the main purpose is mainly informative and to have better understanding of various methods regarding liquidity of a financial market and its component depicts a great array of detail concerning liquidity and its various measures (methodology) also various analysis and predictions done on the Swiss financial market and its components. It also covers the correlation of liquidity of the listed companies of Swiss financial market.
23
conditions may have beenoverlooked. Also there are positivecorrelations between trade frequency and each of thethree indicators of market liquidity.
Oliveira and Fortunato (2006) in their research about the dynamic analysis of liquidity constraints its relation to firm size which was conducted using a set data from Portuguese small business enterprise found that the higher investment/cash flow sensitivity of youngerand smaller firm in the lack of financial market flaw asthe outcome of these firms reaction to the fact that realisationof their cash flows shows them the direction they need to go in the presenceof uncertainty of their growth prospect. And that firms that weresmall and youngat the beginning of the sample period exhibitedmore persistent growth than those that were large and old.
PradoshSimlai (2009) in his journal about the research on the performance of common stock returns with its relation to two characteristics that are widely known which are: size and book to market ratio in the New York Stock Exchange. He found thattwo risk factors based on the mimicking return forthe size and book-to-market ratio play a significant role in capturing strong variation in stock returns;and volatility persistencecan significantly improve the common risk factors‟ impact in explaining thetime series variation in size and bookto-market
sorted portfolios.
Langnan, Steve, and Jinan, (2010) found about the method of capital asset pricing model (CAPM) incorporating liquidity and skewness factors is proposed
and tested with Chinese stock market data, which, empirical results indicate that,
24
provides a better fit to the realized returns of various stock portfolios. The
conclusion of this journal is that illiquidity cost, liquidity risk and as well as
skewness have important impacts on asset pricing in the Chinese stock market.
Mirfeyz, Gholamreza, Zahra, and Mohammad, (2011) found that the impact of systematic liquidity risk on stock price and that stockswhose returns have more sensitive to market wide liquidity fluctuations (illiquidity) command higherexpected returns and thereupon price adopt a higher value, as relationshipbetween stock and illiquidityis positive and this importance inIranian market capitalization,and Iranian investors decisions forinvesting in various securities base on orders prompt andsmooth and simplification trading.
Amihud and Mendelson (2000) argue that a company can raise its stock price by enhancing the liquidity of its stock. The greater the stock‟s liquidity, the
25
that the lower bid-ask spread ofexchange traded funds is due to their relatively large stock price synchronicity. The evidence suggests thatthe degree of return co-movement has a significant impact on market liquidity.
Hassan, Mehdi, and Elham (2012) did similar research in that they tried to investigate the factors of liquidity premium including the factors of size, value, and risk of the market to the excess return in the Tehran Stock Exchange. The result was that they found the factors are all significant to the excess return with its relationship to the market excess return, size, stock turnover, and book to market equity or value premium as they call it.
Amihud andMendelson (1986), Brennan et al. (1996 and 1998), Chordia et al. (1998) and Fiori (2000) haveestablished a negative relationship between stock's return and the level of itsliquidity. This is ofteninterpreted as reflection of liquidity risk premium. Moreover, Chordia et al. (2000) pointed out thatwell-known financial events such as the international stock market crash of October 1987 and theliquidity crisis in the bond market in 1998 were not linked to any specific major news, but werecharacterized by a temporary reduction in aggregate market liquidity. Such liquidity shocks arepotential channels through which financial asset prices are influenced by liquidity. It shows thatliquidity has a systematic component even after accounting for individual stock‟s
26
amount of compensation return, depending on stock‟s exposure to the
systematiccomponent of liquidity. Pastor and Stambaugh (2003) and Amihud (2002) formally test thisproposition. They found that expected stock returns and the level of marketliquidity have anegative relationship.
Chordia et al., (2000 and 2001) further expanded the scope of study by showingtheimportance of the second moment of individual stock liquidity, as measuredby trading volume andturnover rate. They hypothesized that variability in individual stock's liquidity should have apositive effect on stock returns as it represents a form of uncertainty to the investors. However, anegative but surprisingly strong cross-sectional relation was found instead, even after controllingfor the size, book-to-market ratio, and momentum effects. They were unable to provide a usefulexplanation for this unexpected finding. Lately,Goyenko (2005) documents that stock liquidity hasa cross-market effect, hence the expected stock return includes a premium for liquidity risk, whichappears to be a global phenomenon in another study by Liang and Wei, (2006).
27
not be perceived as thatmuch illiquid. Intuitively, a stock‟s liquidity scaled by the other stocks'average liquidity shouldprovide a better assessment of its liquidity than thatsolely based on its own specific characteristics (Oima et. Al, 2013).
Earlier researchers documented a negative relationship between the stock return and level ofits liquidity [e.g., Amihud and Mendelson (1986), Brennan et al. (1996 and 1998), Chordia et al.(2001) and Fiori (2000)]. This suggests that infrequently traded stocks provide higher returns toinvestors. This has been interpreted as the reflection of liquidity risk premium, since illiquid stockswhich are infrequently traded might be riskier than frequently traded stocks as investors cannotquickly adjust their portfolio of investments when it becomes necessary.Therefore, investorsshould require a premium for bearing non-diversifiable liquidity risk and if the relative measure ofliquidity.
Apart from illiquidity of stocks, the variability in the level of liquidity isalso considered tobe risky to the investors as the more the stock liquidity fluctuates, the higher the uncertainty inmarket trading. This leads to erosion of investors‟ confidence in the trading activates. This isbecause investors realize that
their assessment of the likelihood of things going wrong has becomeless reliable. Therefore, investors would expect high return for trading in a market with morevolatile trading behavior.
2.3 Hypothesis
28
computed for each stock in each month as the ratio of a stock‟s turnover volume
to the average market turnover volume which do not include that particular stock itself. In this research, the liquidity of other stocks in the market has its own role of measuring a particular stock‟s liquidity. For example, the turnover volume of
stock X in month Z may be a tad bit low which indicates its liquidity may be low. But on the other hand, if the average market turnover volume for month Z is low also, then relatively, stock X should not be seen a very illiquid. In addition, a stock‟s liquidity when compared with other stock liquidity should provide better
view on assessment on its liquidity rather than based on that single stock itself. It is a widely known fact that there is a negative relationship between stock return and its level of liquidity (Amihud & Mendelson, 1986; Fiori, 2000). This fact suggest that stocks that are less traded gives higher return to investors.
H0: The relationship between the level of relative measure ofliquidity and excess stock returns isnegative.
If the relation between stock return and liquidity is negative, it means that stocks that are not that frequently traded give higher return to the investors. This has been interpreted as the mirror of liquidity risk premium, since stocks that are less liquid or illiquid might be riskier than its counterpart since investor cannot quickly adjust their portfolio when the time comes.
29