IDENTIFICATION PERFORMANCE AND MACHINE FAILURE OF
MANUFACTURING SYSTEM BASED ON OEE AND FMEA METHODS
Jazuli1, Angga Laksitama2, Adelia Dini Meinarwati3
1,2,3
Industrial Engineering Department, Dian Nuswantoro University 5-11 Jl. Nakula I Semarang 50131 Central Java Indonesia
Phone: +62243555628 Fax: +62243569684
ABSTRACT
This paper concerns for identify machines performance and the most dominant failure mode which appears in the PT. APF that causes low levels of quality of the products produced by the machine SDS 700 and SDS 900 in the manufacturing process at the texturizing (TX-1) department of PT. APF. The analysis was done by calculating availability machine 90%, performance rate <95%, and the quality rate <80% of the Overall Equipment Effectiveness (OEE) value of <85%. While the identification of failure modes with FMEA method the highest RPN value is 30 for misthreading failure, which the contribution method and maintenance of machinery by 48% of the processing of the fishbone diagram.
Key words: availability, performance, OEE, FMEA.
1. INTRODUCTION
All of activities within an industry are subjected to gain maximum profit as much as possible, by minimizing the amount of input and maximizing the amount of output (Chand, Shirvan, 2000). Grover (2008) said that from a whole of manufacturing times, only 5% that is used for machining process. About 70% from machining time is used just for loading process, positioning, gagging, etc. Waste elimination within manufacturing process should keep on working for getting an optimal performance from a machine. Overall Equipment Effectiveness (OEE) is one of methods which are commonly used by company which oriented on Total Productive Maintenance (TPM) for machine and equipment performance measurement. This method is used to identify location of the problems on manufacturing tool and machining (Zemestani. et. al., 2011)
The data shows that a number of manufacturing PT. APF year 2011 in machine SDS 700 is only reach 83 % and machine SDS 900 is about 94,5 %. Lack of numbers in this achievement is caused by many things, especially waste activity which
occurs in manufacturing activity. Due to the dominant that posed by the problems it then it is the quality, cost and delivery on texturizing (TX-1) department. This paper will identify the OEE performance and failure mode that happened in TX-1departement.
2. THEORETICAL BACKGROUND
2.1. Overall Equipment Effectivenees
Nakajima (1988) introduced quantitative matrix that usually called OEE for measure performance of equipment manufacturing. This concept then was studied and developed in a semiconductor industry on America which done by Giegling, et. al., (1997). OEE is formulated from the function of some interrelated components, such as availability efficiency, performance efficiency, and quality efficiency (Nakajima, 1988). The success value within OEE is appropriate with the international standard (about ≥ 85% ), while for each parameter is 90% for availability, 95% efficiency, and 99% for quality rate (Bendaya, et. al., 2009).
happened within shop floor. The calculation for value availability, performance, quality and OEE can use the equation (1), (2), (3), (4) as shown in Costa and Lima (2002).
(1)
(2)
(3)
(4)
In OEE concept there are six big
damages that cause reduction labor
productivity of the company. The six big damages are Breakdown, Set up and adjustment, Small Stop, Reduced Speed, Startup rejects or reduced yield, production reject (Nakajima, 1988).
2.2 Failure Mode and Effect Analysis (FMEA)
FMEA is a technique that uses for
identifying, prioritizing, and reducing
problems from system, design, or process before the problems are happened (Kmenta, 2002). Rhee J. et. al. (2003) claims that FMEA is a tool that uses widely in automotive industry, aerospace, and electronic for identifying, prioritizing, and eliminating failure potential, problems, and error system in design before the product is
launched. This method counts failure
potential, problems with Risk Priority Number (RPN).
(5)
RPN is used by a lot of FMEA procedures for estimating the risk it uses three criteria; Severity (S), Occurrence (O) and Detection (D). The value of RPN itself can be counted by using equation 5.
3. RESEARCH METHOD
This research was conducted in line of manufacturing department TX1 on machine SDS 700 number 24 and 25 and SDS 900A number 4 and SDS 900B number 5 with the normally schedule operation is 24 hour/day
It means that there will be no turnover machine operation. The 24 hour/day operation will make the production effective.
Texturizing machine consists of 216
positions, where each position is processing a single bobbin of thread. The machine is divided into 2 sides which are side A and side B, where each side has 108 positions which are divided again into 9 blocks. One block consists of 12 positions. It is divided into 3 levels so one level consists of 4 positions.
The object of the research is a whole product (machine 4, 5, 24 and 25) which have begun their production from February 2012 until April 2012 especially DTY product type normal (SDC) by either Single Heater process or Double Heater whether it is using Intermingle (rotto) or non-rotto. Research is begun by gaining data idle position machine
as shows in Table 1, the actual
manufacturing data shows in Table 2. That data are being analyzed to get the value of OEE. The result is used to identify the failure modes that happened in those machines.
Table 1. A Number of Idle Machine Position
Table 2. Target and Actual Manufacturing
Data on Table 2 shows the actual value manufacturing that use for calculating machine performance.
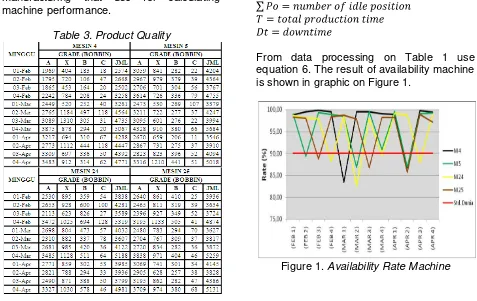
Table 3. Product Quality
While the data on Table 3 shows the actual value manufacturing that uses for calculating Quality rate.
4. RESULT AND DISCUSSION
4.1 Availability
Machine SDS 700 & 900 that became the object observation have 216 positions in each machine which operate as cell station manufacturing, so that each position produces one new product in every cycle. Idle is happened on each position and didn’t happen in a whole machine. The problem which appears in equation (1) is all of position is still operate entirely. Idle position theoretically will influence the availability of value of the machine. Then a number of idle position and operate position needs to calculate. Calculation by entering factor of idle position obtained by multiply number of available position with total manufacturing times and multiply number of position that operate with total operation times. So that for this approach itself needs adaptation availability equation as follows:
(6)
From data processing on Table 1 use equation 6. The result of availability machine is shown in graphic on Figure 1.
If we compare the result with international standard of OEE for availability value (90%), some values are below standards.
4.2 Performance
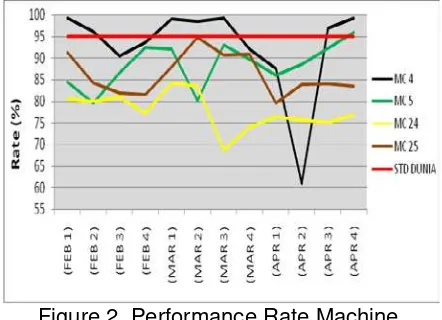
Performance Rate was obtained from comparison between numbers of target manufacturing in one operation time and number of actual manufacturing by using equation 2. The result of calculating performance manufacturing is appropriate with data on Table 2 as it is shown in Figure 2.
Figure 2.Performance Rate Machine
Figure 2 shows graphic performance rate of international standard (95%). From Figure 2 can be concluded that the lowest performance rate of machine 4 is on the second-week of April (61%) and the highest are on the first-week of February, third-week of March, and fourth-week of April which are 99,2%. The lowest Performance rate of machine 5 is on the second-week of February (79,5%) and the highest on the fourth-week of April (96%). The lowest machine 24 performance rate is on the third-week of March (68,7%), while the highest value on the first-week of March (84,2%).
The lowest Performance rate of machine 25
is on the first-week of April (79,5%), while the highest value is on the second-week of March (94,8%). Those results are so far below the international standard of OEE (95%).
4.3 Quality Rate
Quality rate is calculation between good product numbers and actual total product. The data is quality product in units (bobbin).
The standard reference is product Grade A, so that the calculation can use the equation 7.
(7)
Result from calculation of quality rate shows on Figure 3.
Figure 3.Quality Rate Machine
From figure 4.7 that shows quality rate machine it can be seen that the lowest quality (65,5%) and the highest is on the third-week of March (77,5%). The lowest Quality rate of machine 5 is on the second-week of February (60,6%) and the highest is on the fourth-week of February (76,5%). The lowest Quality rate of machine 24 is on the third-week of March (58,9%) and the highest is on the third-week of February (75,3%). The lowest Quality rate of machine 25 is on the second-week of March that is 64% and the highest is on the fourth-week of February that is 76%. If it’s compare with the international standard of quality rate OEE that is 99% then a whole of quality rate machine 4, 5, 24 and 25 is below the international standard, because all of them are under 80%.
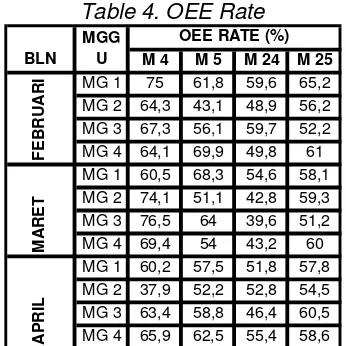
4.4 Overall Equipment Effectiveness Rate The calculation value of OEE rate can use equation 4 to identify the effectiveness of a manufacturing machine or generally can be used for measuring manufacturing
performance from PT. APF. Result
Table 4. OEE Rate
Table 4 shows that the value of OEE rate of the whole machine is below the international standards 85%.
4.4 Failure Mode and Effect Analysis (FMEA)
After it’s known that the height number of grade X because of the medium thread, so in this level, the FMEA method is used to identify the influence factor of the broken threads. The reason for that problem is because of the material reception, loading material, continuation process, and start/ threading and texturizing machine process. The calculation number of occurrences is performed by using the approach numbers of break each ton that occurred. It’s known that average number of break each ton is about 33 breaks each ton of every machine. It means that in 1.000 kg each machine uses 216 position, the average of break product is about 33 break product.
Table 5. Number of Failure Occurrence
From these event we can identify RPN for knowing the most often failure mode that happened, as shows on Table 6.
Table 6. RPN FMEA Value
From Table 6 we can conclude that the highest value of RPN is 30 that is misthreading, where the lane entry of the thread is misallocation or detached. The highest rank of severity (5) because misthreading can cause lapping that makes machine performance becomes heavy and it will stop. Some failure detection of misthreading is figure out in fishbone diagram that shows on Figure 4.
Figure 4.Fishbone Diagram Cause Medium
Weight (Broken Thread)
Number of this percentage was
obtained from number of occurrence in FMEA, which was distributing in fishbone diagram. Percentage factor in fishbone sequentially are method (48,5%), material (21,2%), equipment (21,2%) and human (9,1%). Occurrence with the highest value is misthreading with percentage 39,4% from percentage method 48,5%.
Misthreading (salah jalur) 24 0,005 Fly waste mesin 48 0,009
Putus merambat 48 0,009
Tail material tidak ada 24 0,005 Fly waste di POY 48 0,009 Tail material rusak/pecah 48 0,009 Ribbon material 72 0,014 Posisi material tidak benar 96 0,02 Run cover cacat 72 0,014
Potensi kegagalan Jml. Kejadian
1 2 4 8
2 2 5 20
1 2 1 2
2 2 5 20
Bottom Layer 2 3 4 24
Laju benang terhambat 2 2 2 8
Penyambungan Gagal sambung 1 3 3 9
Start/ Threading Misthreading 5 2 3 30
Fly waste mesin 2 2 2 8
Putus merambat 2 2 3 12
Proses mesin
5. CONCLUSION
Based on identification by OEE method, quality problem become the main of problem of performance productivity. Dept. TX 1. Generally, the value of OEE rate machine 4, 5, 24 and 25 are still in the range of 35% to 75 % which means it is far from international standard OEE (99%). Data shows that low value of quality rate on OEE is caused by the medium weight because the broken thread which happened in process. The results of the data processing show that misthreading FMEA RPN has the highest value (30), so it should be a priority of improvement.
6. REFERENCES
(a) Bendaya M, Duffua S.O., Raouf A, Knezevic J., Kadi D.A. (2009) Handbook of Maintenance Management and Engineering. Springer Verlag London Limited. London.
(b) Chand, G; and Shirvan, B. (2000) Implementation of TPM in Cellular
Manufacture. Journal of Materials
Processing Technology, 103 (1): 149-154.
(c) Costa, Lima. (1997) Uses and Misuses of the Overall Equipment Effectiveness for Manufacturing
Management. Journal of IEEE
International Electronics Manufacturing (IEEE).
07803-7385-5/02.
(d) Giegling, S., Verdini, W.A., Haymon, T. and Konopka, J. (1997) Implementation of overall equipment effectiveness (OEE) system at a semiconductor manufacturer.
Production Systems, and Computer Integrated Manufacturing, 3rd ed. Pearson Prentice-Hall, Upper Saddle River, New Jersey. 2008
(f) Kmenta, S. (2002) Scenario-Based FMEA Using Expected Cost :A New Perspective on Evaluating Risk in
FMEA. Proceedings of IEE
Workshop.
(g) Muchiri, Peter N, Pintelon L, Martin H dan Marie D.M.A. (2009). Empirical Analysis of Maintenance Performance Measurement in
Belgian Industries.International
Journal of Manufacturing Research 48:20, 5905- 5924. 27.
(h) Nakajima, S. (1988) Introduction to
TPM. Productivity Press. Cambridge,
MA.
(i)
Rhee J., Sheung I., Kosuke. (2003)Life Cost-Based FMEA Using Empirical Data. Proceedings of DETC2002, ASME Design Engineering Technical Conference. Chicago IL.
(j)
Zemestani, G., Rahmani K., BonabM. P., Naghded M.P.. (2011)
Evaluating the Overall Effectiveness
of Production Equipment and
Machinery. American Journal of