International Sensor Conferences 2014
53
SONAR TRANSDUCER CHARACTERISTICS FOR UNDERWATER
DETECTION
Henry M. Manik1
1
Email: [email protected]
Department of Marine Science and Technology Bogor Agricultural University (IPB) Kampus IPB Darmaga Bogor INDONESIA
Abstract. This paper presents the results of a study on sonar transducer characteristics for detection and quantification purpose. The main objectives was to provide Sonar tool for the evaluation of underwater target. The echo signal of the underwater target using quantified Sonar system operated at 200 kHz. Sonar algorithm designed and implemented for processing underwater acoustic data.
Keywords—detection, sonar, target, transducer, underwater;
1 Introduction
The development of underwater electroacoustic transducers expanded rapidly during
the twentieth century, and continues to be a growing field of knowledge, with many
significant applications, one that combines mechanics, electricity, magnetism, solid state
physics and acoustics. In the most general sense, a transducer is a process or a device that
converts energy from one form to another. Thus an electroacoustic transducer converts
electrical energy to acoustical energy or vice versa [1] . The term SONAR (SOund
Navigation And Ranging) is used for the process of detecting and locating objects by
receiving the sounds they emit (passive sonar), or by receiving the echoes reflected from
them when they are insonified in echo-ranging (active sonar).
The function of an electroacoustic transducer is to radiate sound into a medium such as
air or water or to detect sound that was radiated into the medium. The transducer responses
are measures of a transducer’s ability to perform these functions [2]. They are defined as
the transducer output per unit of input as a function of frequency. Transducers generally
radiate sound in a directional manner which changes with frequency and with distance
from the transducer. At a given frequency the far field is the region beyond which the
directional characteristics become independent of distance, and the sound pressure
becomes inversely proportional to distance.
Sound is an important tool for gaining insight into phenomena and processes in
underwater environments. In the ocean, the theory of sound is essential in such broad
applications as military operations, geological exploration, and biological surveys. Unlike
electromagnetic waves, acoustic pressure waves are able to propagate long distances in
International Sensor Conferences 2014
54
The typical frequency range used in underwater acoustics is 10 Hz to 1 MHz, with the
lower
frequencies able to travel many kilometers. An important aspect of the field is acoustic
scattering, that is, understanding how sound reacts to boundaries and obstacles in its path.
With SONAR (Sound navigation and ranging)—a method for marine vessels to navigate,
communicate, and detect one another—as its most well-known application, acoustic
scattering includes the study of the reflection, diffraction, and transmission of sound
incident upon a particular object. This analysis can often convey detailed information
about the nature of the object such as its shape, size, or material properties. Knowledge of
scattering mechanisms is important in such diverse applications as mine detection and
investigating zooplankton populations. There is a vast literature on the subject of
underwater acoustic scattering [3; 4]. In sonar instrument, a sound pulse is transmitted by a
sonar system and the time of arrival of the echo provides a measure of the height of the
sonar above the bottom. However, the shape and duration of the echo are often very
different from the original pulse and these distortions contain information about the sea
bottom [5].
Single beam monostatic sonar have been the tool for underwater organism and its
habitat observation [6]. This instrument is simple to uses and widespread on all vessels.
The shape of received echo give a lot of information such as bottom hardness and
roughness. New developed techniques of underwater acoustic signal analysis allow to
differentiate all collected data and distinguished habitats using various signal processing
methods.
2 Methodology
Sonar instrument principle is shown in Fig. 1. The transmitter and transducer generate
the transmit pulse; the same transducer then receives the echo, which includes signal
(backscatter information) and noise. A transmit/receive switch provides appropriate
connections during the transmit/receive cycle (ping). The received echo is filtered using
signal processing tools. Its upper frequency sets the sample rate required by the A/D
converter, which transforms the analogue signal to a digital signal or data stream. A
detector and low-pass digital filter follow to remove the carrier and higher frequency
components, including the out-of-band portion of the remaining noise; a smooth echo
envelope results. Finally, decimation may be used to reduce the data rate, often in a process
International Sensor Conferences 2014
55
echogram, serving as the raw material for sediment classification. Transmitter and receiver
characteristics must be stable over time, and environmental conditions, such as
temperature, moisture, and vibration to record backscatter information.
The sonar measurement incorporates the characteristics and geometry of the single
beam sonar such as the transducer’s beam pattern, its depth and with respect to vertical, the
characteristics of the transmitted sound pulse, and the roll and pitch angles of the platform
to which the transducer is mounted; and environmental factors: spherical spreading and
absorption losses as the signal propagates through the water column, backscattering of the
signal at the water–sediment interface, and by inhomogeneities in the sediment volume.
Fig. 1. Diagram of single beam sonar instrument
Sonar Equations
Acoustical techniques using Sonar instrument are routinely used for investigations of
aquatic organisms. Echo integration and echo counting are the common methods for
biomass assessment in oceans, lakes and rivers [8]. The established methods are all based
on the echo formation process, theoretically described by the wellknown sonar equation [9]
involving the transmitted pulse, the transmission loss through the medium, the acoustical
scattering by the target and how the echo is sensed and measured by the receiver.
The sonar equation for the backscattering from a resolved target, the received echo
excess, EE, for an active sound system can be expressed as:
EE = SL − 2TL + TS + DI − NL (1)
where SL is the source level, TL is the one way transmission loss including the spherical
spreading and the absorption, TS is the target strength, DI is the sonar directivity index, and
NL is the ambient noise level. For unresolved targets, the corresponding EE has a slightly
different form:
International Sensor Conferences 2014
56
where SV is the volume backscattering strength, where SV = 10 log Sv, which is Sv is the
volume backscattering coefficient. Ψ is the logarithmic form of the equivalent beam angle
measured by :
(3)
where θ and Φ are spherical polar coordinates used to determine the direction of a point (P)
relative to the origin (O) of the transducer, θ is the angle of OP from the acoustic axis, ф is
the azimuthal angle of OP projected onto the plane of the transducer face, and b is the
beam pattern, defined in terms of intensity. The entire beam patterns is used in the
integration, from θ = 0 to π and from ф = 0 to 2π. Values for ψ are supplied by some
manufacturers and can be modified in analysis software. Some manufacturers report
equivalent beam angle in steradians.
Sonar transducer should have a measured beam pattern showing the magnitude of the main
lobe and associated side lobes. Performed by the manufacturer, these transducer-specific
measurements also provide measures for Ψ (equivalent beam angle) and the 3 dB angle
used in data collection and processing. The active radius (a) of a circular transducer, the
half-intensity beam angle (θ3dB), and the equivalent beam angle (Ψ) are related and can be
calculated from each other through the following equations (when ka>10) :
(4)
where θ3dB is the half-power beam angle (º), k is the wave number
(5)
and λ is the wavelength (m)
The quantities of Ψ and DI can be determined by standard target calibration by measuring
echo level EL = EE + NL. For sonar systems, the transmission loss (TL) is compensated by
time vary gain (TVG) defined by
TL = 20 log10
for resolved target, and
r + α r (6)
International Sensor Conferences 2014
57
for unresolved target, where r is range in meters and α is the absorption coefficient
(dB/km).
Consider a simplified acoustic system (Fig. 2) where a narrowband monostatic sonar at
incident angle (θi) to the seabed with transmitting sensitivity b(φ,φ) and receiving
sensitivity b′(φ,φ) (where φ and φ are the angles relative to the beam axis) axis), emits a
short sinusoidal pulse of duration τ and average source intensity Is( θi), measured at a unit
distance from the source. The pulse propagates through an unbounded medium spherically,
spreading and being absorbed and refracted. At a range R, the pulse interacts with the
seabed and insonifies an area S of random homogeneous distribution of scatterers
producing surface reverberation ss(θi) at any one instant of time. Neglecting volume scatter
within the seabed, a part of the signal is backscattered towards the source as the sum of
random scatterers emanating from a large number of elemental areas dS within the area S.
Fig. 2. Monostatic sonar system measurement
For target strength (TS) measurement,
TS = - RS - SL + (2*TL) + Voltage(returned) - AVG + α – AG (8)
Voltage (returned) = 20* log10 (count*maxVolt)/(maxCount) (9)
RS is receiving sensitivity, SL is source level, AVG is array gain voltage, and AG is amplifier gain.
Results and Discussion
The operating frequency of sonar transducer is 200 kHz. The primary beam width is
about 4o
If 1 watt of acoustic power is transmitted omnidirectionally, then the intensity at a distance
of 1 meter is 1 watt per 4π square meters or 0.08 watts per square meters. For the
. The array is circular, then its radius can be determined from the formula relating
the product of wave number k and radius a. The product of ka is about 50, and the
directivity index at 200 kHz is 20 log ka = 32 dB. The output power P is specified as being
International Sensor Conferences 2014
58
standard pressure reference of an rms level of 1 microPascal (1 μPa), the intensity in sea
water is [10]
(10)
The sound pressure level (SL) for a 1 watt omnisource is given by
(11)
Then, the acoustic power is measured by
SL = 10 log Pa + DI + 170.8 (12)
or about 230 dB re 1 µPa at 1 m.
Since ka = 50, and k = 2π / λ, where λ is the wavelength at the 200 kHz, namely 75
cm, a is about 15 cm. The nearfield distance from R = πa2
The absorption coefficient (α) using Francois and Garrison formula [7] for temperature
27
/λ is 1.8 m, which is consistent
with the minimum depth of operation, namely 2 m, as given in the manufacturer’s
specifications. This distance will vary with the hydrographic condition. The beam width
(BW) for large ka is given by BW = 3.2/ka radians = 58λ/D degrees,where D = 2a is
the piston diameter.
o
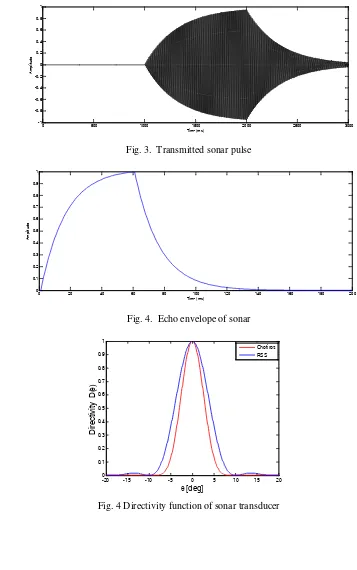
Figure 3 show the sonar pulse transmitting form underwater transducer. Echo
envelope of sonar is shown in Figure 4. Sonar directivity and calculated directivity is
shown in Figure 5. Comparison of measurement directivity of ring surface scattering (RSS)
was compared with Chotiros model [5]. From this figure, the RSS directivity is quiet similar
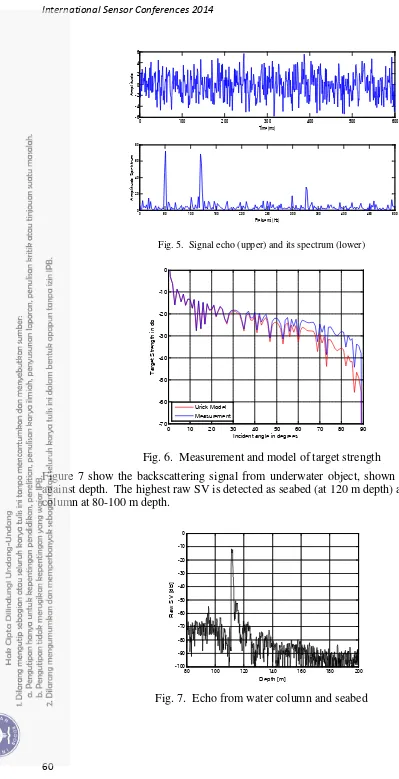
with the model. The signal echo from underwater target and its spectrum is shown in Fig. 6.
Figure 7 show the measurement and Urick model for Target Strength value.
C and salinity 33 ppt is about 0.0029 dB/m. The absorption at 20 m, namely α R is
International Sensor Conferences 2014
59
0 500 1000 1500 2000 2500 3000
-1
Fig. 3. Transmitted sonar pulse
0 20 40 60 80 100 120 140 160 180 200
International Sensor Conferences 2014
Fig. 5. Signal echo (upper) and its spectrum (lower)
0 10 20 30 40 50 60 70 80 90
Incident angle in degrees
T
Fig. 6. Measurement and model of target strength
Figure 7 show the backscattering signal from underwater object, shown in raw SV value against depth. The highest raw SV is detected as seabed (at 120 m depth) and other is water column at 80-100 m depth.
80 100 120 140 160 180 200
International Sensor Conferences 2014
61
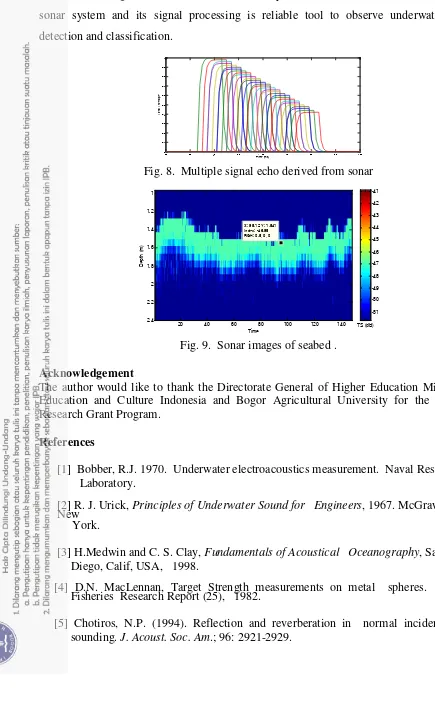
We derived the multiple echo received from target as shown in Figure 8, where the highest
reflection shown in highest peak of signal. Figure 9 shows the echogram of seagrass with
the TS value range from -46.9 to -48 dB. Finally, the conclusion of this research that the
sonar system and its signal processing is reliable tool to observe underwater target
detection and classification.
20 30 40 50 60 70 80 90 100
Fig. 8. Multiple signal echo derived from sonar
X: 95.12 Y: 1.541
The author would like to thank the Directorate General of Higher Education Ministry of Education and Culture Indonesia and Bogor Agricultural University for the Strategic Research Grant Program.
References
[1] Bobber, R.J. 1970. Underwater electroacoustics measurement. Naval Research Laboratory.
[2] R. J. Urick, Principles of Underwater Sound for Engineers, 1967. McGraw Hill
New York.
[3] H.Medwin and C. S. Clay, Fundamentals of Acoustical Oceanography, San
Diego, Calif, USA, 1998.
[4] D.N. MacLennan, Target Strength measurements on metal spheres. Scottish Fisheries Research Report (25), 1982.
[5] Chotiros, N.P. (1994). Reflection and reverberation in normal incidence echo
International Sensor Conferences 2014
62
[6] Applied Physics Laboratory, University of Washington. (1994). High Frequency Ocean Environmental Acoustic Models Handbook.
[7] Ziomek, Lawrence .J, Underwater acoustics: a linear systems theory approach, (Academic Press), (1985).
[8] Francois, R.E and G.R. Garrison. 1982. Sound absorption based on ocean measurements. II. Boric acid contribution and equation for total absorption. J. Acoust. Soc. Am. 72, 1879-1890.
[9] Buren, A.L.V.1991. Procedure for the in situ calibration of sonar transducer. J.
Acoust. Soc. Am.; 90: 48-52.
[10] Burdic, W. 1991. Underwater acoustics system analysis (2nd. Ed.) Englewood Cliffs,