Final Report
DRI NKI NG HABI TS AND HYDRATI ON STATUS
AMONG TEENAGERS AND ADULTS
I N TWO DI FFERENT ECOLOGI CAL AREAS
( Kebiasaan Minum dan Status Hidrasi pada Remaja dan Dew asa di Dua Wilayah Ekologi yang Berbeda)
Hardinsyah Endang S. Soenaryo Dodik Briaw an Evy Damayanthi Cesilia M. Dw iriani Yekti H. Effendi Mira Dew i Muhammad Aries
I SBN 978- 979- 95951- 4- 0
Food and Nutrition Society of I ndonesia ( PERGI ZI PANGAN I ndonesia) Department of Community Nutrition, Faculty of Human Ecology, I PB
SUMMARY
DRI NKI NG HABI TS AND HYDRATI ON STATUS AMONG TEENAGERS AND ADULTS I N TWO DI FFERENT ECOLOGI CAL AREAS. Hardinsyah, Endang S. Soenaryo, Dodik Briawan, Evy Damayanthi, Cesilia M. Dwiriani, Yekti H. Effendi, Mira Dewi and Muhammad Aries. Food and Nutrition Society of I ndonesia (PERGI ZI PANGAN I ndonesia), Department of Community Nutrition Faculty of Human Ecology (FEMA) I PB, and Danone Aqua I ndonesia. 2009.
Water is an important nutrient required for the human body. There is a tendency that some people neglect its important roles for health, and it is sometime called a forgotten nutrient. About two-third of our body weight is water. Water have many important roles in the body such as a solvent, catalyst, lubricate, temperature regulator, and as a body mineral and electrolyte supplier. Several studies done in overseas showed that adequate intake of water prevents many symptoms of diseases; improve physical performance and memory capacity. Thirsty is an early and simple indication of pre-dehydration. However, water is not only required when thirsty. Study in Singapore showed that the teenagers and adults (15 – 24 years) are more likely to be vulnerable to mild dehydration. However, there is no such evidence in I ndonesia. Therefore, PERGI ZI PANGAN I ndonesia, Department of Community Nutrition, Faculty of Human Ecology (FEMA) I PB and Danone Aqua I ndonesia conducted this study in I ndonesia.
The main objective of the study is to obtain scientific evidences on types, amount, sources and habitual intake of water among teenagers and adults in two different ecological areas of I ndonesia. The specific objectives of the study were: 1) the types, amount and sources of drinking water and beverages; 2) the habitual intake of drinking water and beverages (frequency, time, place); 3) the reasons of choosing several types of drinking water and beverages (bottle water, fountain water, boiled water, soft drink, sport drink, energy drink, milk, juice, and etc); 4) the knowledge on healthy drinking; and 5) the magnitude of mild and moderate dehydration among teenagers and adults.
A cross sectional study design was applied to address the above objectives. Considering the influence of the different altitude and temperature (ecological area) on the water supply and intake, two study sites are being chosen, namely: 1) West Bandung, close to Lembang (a highland area with 700-1050 meters above sea level), which reflects a medium temperature (daily temperature is about 22oC); and 2) North Jakarta (a low land area with 5-50 meters above sea level), which reflects a high temperature (daily temperature is about 28oC). This study conducted in October 2008. The sample or subjects for this study is teenagers and adults both male and female). I nclusions criteria of the subjects were: 1) adolescents aged 15 – 18 year and adults aged 25 – 50 year, 2) they spent most of their time in the study site, and 3) healthy. Exclusion criteria of the samples were they did not suffering from: 1) renal failure, 2) diabetic, or 3) liver failure. Exclusion criteria determined by medical examination and urine analysis.
variation of inter-observer; and 4) Supervision during data collection. Dehydration status (mild dehydration status) was determined based on both urine analysis and dehydration symptoms. Subjects categorized as dehydrated if they meet all of the following criteria: 1) urine specific gravity is more than > 1.020, 2) urine color is dark yellow 3) erythrocyte 1-5/ lpb, leukocyte 1-1-5/ lpb or positive cylinder hialin, 4) light proteinuria; and having two of the following symptoms such as thirsty/ dry throat, headache/ dizziness, dry skin, dry lip/ mouth, rapid heart rate, high body temperature, rarely urinated, and small amount of urine volume. Normal BMI (Body Mass I ndex) if BMI 18.5 – 23.0. Physical activity levels categorized based on US-DHHS criteria (2008); light activity level if intense physical activity less than 150 minutes/ week; medium activity level if 150-300 minutes/ week, and heavy activity level if more than 300 minutes/ week. The data was analyzed statistically. The results of the data analysis were presented in the form of tables, diagrams and graphs in order to answer the objectives of the study.
The results showed that in the highland area most of the teenager subjects stated that the sources of family drinking water are gallon water (38.1 % ), wellspring (27.8% ), pump-water (26.8% ) and well-water (20.6% ). Similarly the sources of family drinking water of adult subjects are gallon-water (34.8 % ), wellspring (30.4% ), well-water (21.7% ) and pump-water (15.2% ). While in the low land, more gallon-water is consumed, which is 74.3% for teenagers and 72.5% for adult? The second source of drinking water among teenagers in the low land is pump-water 32.1% , and then the third is 33.3% respectively.
The family consumption of gallon water of teenager group both in the highland and in the lowland was 2.3 and 7.8 gallons/ month respectively. About two-third (65-70% ) of teenagers consumed branded gallon water, and 88.2% of them using Aqua brand. The family consumption of gallon water of adult group was 1.6 and 7.3 gallons/ moth in the highland and lowland areas respectively. There are 70 - 72% of the adult samples used the branded gallon water which is 45 - 50% used Aqua brand.
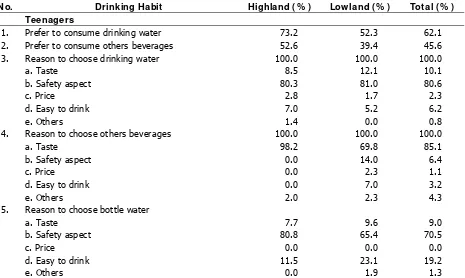
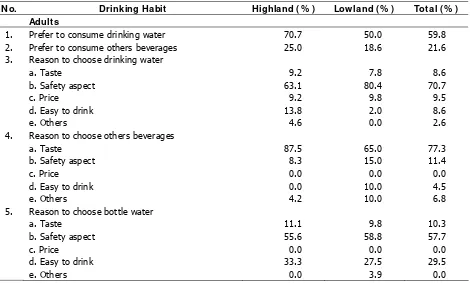
Most of the teenagers (73.2% ) in the highland prefer to drink unbottled water rather than the bottled ones. Meanwhile in the lowland, the number of the teenagers who prefer to drink the unbottled water is relatively similar to the bottled ones which are 52.3% and 47.4% respectively. The frequency of bottled water consumption in the lowland is higher than in the highland which is 3.9 times/ day compare to 1.8 times per day. Among adult group, about 70.7% in the lowland and 50.0% in the highland prefer to drink unbottled water.
The safety of the water drink is the main reason of 80 - 85% teenagers to use bottled or packed water. Tea and coffee is the next beverage that is being chosen by the teenagers. The number of the teenagers who consume tea and coffee is 79% in lowland and 84% in highland area. The frequency of tea/ coffee consumption in the lowland is 1.5 times/ day and in the highland 1.6 times/ day. For the beverages, a taste is the main reason to choose it. There are only 25.0% of the adult in the highland and 18.6% in the lowland prefer to drink the beverages. Adult preference in consuming drinking water is based on the safety reason which is 63.1% in the highland and 80.4% in the lowland.
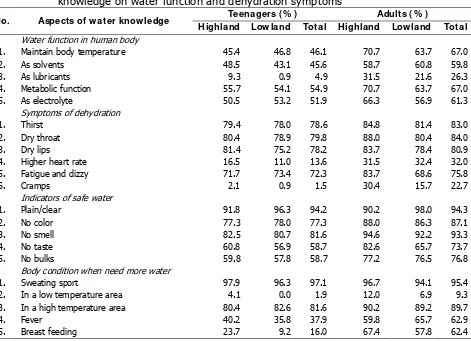
Regarding the knowledge of healthy drink, most of the teenagers in the mountain (53.6% ) is categorized as medium and in the lowland as low (57.8% ). However, the most of the adults in the highland (57.6% ) and the lowland (59.8% ) are both categorized as medium. Based on the knowledge aspect on the water function, water food source, and dehydration symptoms; these aspects are the poor score of knowledge in the teenagers and the adult in both ecological areas.
highland and 24.05 % in the low land. The percentage of mild dehydration in the two groups of sample is higher in the lowland than in the highland area.
RI NGKASAN
KEBI ASAAN MI NUM DAN HI DRASI PADA REMAJA DAN DEWASA DI DUA WI LAYAH EKOLOGI YANG BERBEDA. Hardinsyah, Endang S. Soenaryo, Dodik Briawan, Evy Damayanthi, Cesilia M. Dwiriani, Yekti H. Effendi, Mira Dewi dan Muhammad Aries. Perhimpunan Peminat Gizi dan Pangan I ndonesia (PERGI ZI PANGAN I ndonesia), Departemen Gizi Masyarakat Fakultas Ekologi Manusia (FEMA) I PB, dan Danone Aqua I ndonesia. 2009.
Air merupakan salah satu zat gizi penting bagi kesehatan tubuh. Ada kecenderungan pemenuhan kebutuhan air terabaikan, dan kadangkala air disebut sebagai zat gizi terlupakan. Sekitar dua-pertiga berat badan manusia adalah air. Air mempunyai peranan yang penting dalam tubuh, diantaranya adalah sebagai pelarut, katalisator, pelumas, pengatur suhu tubuh serta sebagai penyedia mineral dan elektrolit bagi tubuh. Beberapa hasil penelitian di Mancanegara menunjukkan bahwa pemenuhan kebutuhan air tubuh dapat mencegah gejala berbagai penyakit, meningkatkan kemampuan kerja fisik dan daya ingat atau kecerdasan. Rasa haus merupakan indikasi awal bahwa tubuh mengalami kekurangan air (predehidrasi). Meskipun begitu, air tidak hanya dibutuhkan pada saat tubuh merasa haus. Penelitian di Singapura menunjukkan bahwa para remaja dan orang dewasa muda lebih berisiko mengalami dehidrasi dibanding kelompok lainnya. Di I ndonesia masih belum ada bukti ilmiah mengenai hal tersebut. Oleh karena itu PERGI ZI PANGAN I ndonesia, Departemen Gizi Masyarakat FEMA I PB dan Aqua Danone melakukan penelitian ini di I ndonesia.
Tujuan utama penelitian ini adalah untuk memperoleh bukti-bukti ilmiah mengenai jenis, jumlah, sumber dan kebiasaan konsumsi air minum para remaja dan orang dewasa di dua wilayah ekologi yang berbeda di I ndonesia. Tujuan khususnya adalah untuk mempelajari: 1) jenis, jumlah dan sumber air minum dan minuman yang biasa dikonsumsi; 2) kebiasaan minum air dan minuman meliputi frekuensi, waktu, dan tempat; 3) berbagai alasan pemilihan jenis air minum dan minuman; 4) pengetahuan mengenai kebutuhan air, air minum yang aman serta manfaatnya; dan 5) mempelajari besaran masalah dehidrasi pada remaja dan orang dewasa.
Penelitian ini menggunakan desain cross sectional. Mempertimbangkan bahwa perbedaan suhu (wilayah ekologi) akan berpengaruh terhadap asupan air, maka pada penelitian ini dipilih dua lokasi, yaitu: Bandung Barat (suatu wilayah dataran tinggi dengan ketinggian 700 - 1050 m di atas permukaan laut), yang mencerminkan wilayah dengan suhu rendah (suhu hariannya sekitar 22oC); dan 2) Jakarta Utara (wilayah dataran rendah dengan ketinggian 5-50 m di atas permukaan laut), yang mencerminkan wilayah bersuhu tinggi (suhu hariannya sekitar 28oC). Pengambilan data di lapang dilakukan pada bulan Oktober 2008. Sampel atau subjek adalah remaja dan dewasa laki-laki dan perempuan dengan kriteria inklusi: 1) remaja usia 15 - 18 tahun dan dewasa usia 25-50 tahun, 2) mengalokasikan sebagian besar waktu di dua lokasi penelitian, 3) berbadan sehat. Kriteria eksklusi subjek adalah tidak menderita: 1) kaki bengkak (kelainan ginjal), 2) kencing manis, dan 3) kelainan hati berdasarkan pemeriksaan dokter dan analisis urin.
membahas desain dan metode; 2) Uji coba lapang kuesioner yang digunakan; 3) Pelatihan peneliti dan tenaga lapang; dan 4) Supervisi selama pengumpulan data. Penentuan status dehidrasi didasarkan pada hasil analisis urin dan gejala dehidrasi ringan (mild dehydration). Seorang subjek dikategorikan dehidrasi ringan bila memenuhi kriteria: 1) berat jenis urine > 1.020, 2) warna urin kuning pekat, 3) eritrosit 1-5/ lpb, leukosit 1-5/ lpb atau silinder hialin positif, 4) proteinuria ringan, dan 5) mengalami dua gejala dehidarasi dari berbagai gejala berikut haus/ kerongkongan kering, sakit kepala/ pusing, kulit kering/ kemerahan, bibir dan mulut kering, berdebar-debar, tubuh terasa panas , jumlah urine sedikit, jarang buang air kecil. I ndeks Masa Tubuh (I MT) normal bila 18.5 – 23.0. Aktifitas fisik dikategorikan ringan bila aktifitas fisik yang intens kurang dari 150 menit/ minggu; aktifitas fisik sedang bila aktifitas fisik yang intens 150-300 menit/ minggu, and aktifitas fisik berat bila aktifitas fisik yang intens lebih dari 150-300 menit/ minggu (US-DHHS, 2008). Data dianalisis secara statistik, dan hasilnya disajikan dalam bentuk tabel, diagram dan grafik untuk menjawab tujuan penelitian.
Hasil penelitian menunjukkan bahwa di daerah dataran tinggi, sebagian besar remaja menyatakan bahwa sumber air minum untuk keluarga berasal dari air galon (38.1 % ), mata air (27.8% ), air ledeng (26.8% ) dan air sumur (20.6% ). Demikian pula pada kelompok dewasa sumber air minum keluarga diperoleh dari air galon (34.8 % ), mata air (30.4% ), air sumur (21.7% ) dan air ledeng (15.2% ). Kebutuhan air galon yang sangat besar ditemukan di wilayah dataran rendah, yaitu 74.3% remaja dan 72.5% dewasa, dan selebihnya berturut-turut berasal dari ledeng 32.1% dan 33.3% .
Jumlah konsumsi air galon untuk minum keluarga remaja di dataran tinggi dan dataran rendah adalah berturut-turut 2.3 dan 7.8 galon per bulan. Sebanyak 65-70% remaja menyebutkan jenis air galon yang digunakan adalah bermerk, dan sebanyak 88.2% menggunakan merek Aqua. Pada kelompok dewasa jumlah air galon untuk sumber air minum keluarga adalah 1.6 galon per bulan di wilayah dataran tinggi dan 7.3 galon per bulan di dataran rendah. Sebanyak 70-72% kelompok dewasa air galon bermerk, dan 45-50% diantaranya menggunakan merk Aqua.
Sebagian besar remaja (73.2% ) di dataran tinggi lebih menyukai air minum tanpa kemasan dibandingkan kemasan. Namun di dataran rendah, remaja yang menyukai air minum tanpa kemasan sebanyak 52.3% , relatif sama dengan 47.4% remaja yang menyukai air minum kemasan. Frekuensi air minum kemasan di dataran rendah jauh lebih banyak dibandingkan di dataran tinggi, yaitu 3.9 kali/ hari dibandingkan 1.8 kali/ hari. Kebiasaan minum pada kelompok dewasa di dataran tinggi sebanyak 70.7% dan di dataran rendah sebanyak 50.0% lebih menyukai air putih tanpa kemasan.
Keamanan minuman menjadi alasan utama remaja 80-85% untuk menggunakan air minum kemasan maupun tanpa kemasan. Teh dan kopi merupakan jenis minuman yang disukai setelah air minum. Jumlah sampel yang mengkonsumsi teh/ kopi berturut-turut 79% dan 84% . Frekuensi konsumsi teh/ kopi di pantai rata-rata 1.5 kali/ hari dan di pegunungan 1.6 kali/ hari. Rasa menjadi pertimbangan utama untuk konsumsi minuman selain air minum. Hanya 25.0% sampel dewasa di dataran tinggi dan 18.6% di dataran rendah yang menyukai minuman selain air putih. Sampel dewasa memilih minuman dengan pertimbangan utama karena keamanannya, yaitu 63.1% di dataran tinggi dan 80.4% di dataran rendah.
Keadaan dehidrasi yang ditemukan pada contoh remaja dan dewasa termasuk dalam kategori dehydrasi ringan. Pada kelompok remaja proporsi dehidrasi ringan di dataran tinggi 24,75% dan di dataran rendah 41,70% . Pada kelompok dewasa proporsi dehidrasi ringan di dataran tinggi 15,40% dan di dataran rendah 24,00% . Prosentasi dehidrasi ringan pada kedua kelompok lebih tinggi di dataran rendah dibandingkan dengan di dataran tinggi.
FOREWORD
During the last 15 years, there was a better trend of the I ndonesian policy on drinking water. Firstly, it can be seen on one of the thirteen core messages of the I ndonesian dietary guidelines, called Pedoman Gizi Seimbang (PUGS), which is launched by the Ministry of Health in 1994. The message is “Drink adequate amount of safe drinking water”. I n that guideline, an I ndonesian adult is suggested to drink 2 liters or eight glasses of safe drinking water everyday to accomplish the healthy body and good physical performance. Secondly, in 2004, the first time the National Food and Nutrition Workshop (WNPG – LI PI ) discussed and promote the allowances (RDA) of drinking water and electrolyte for I ndonesians. The workshop suggests that the RDA of water is from 0.8 to 2.8 liters per-day depends on age, sex, activity and temperate (ecological areas).
However, a study on the drinking habits and hydration status of I ndonesians at the community setting had not been done yet. I t is more likely that people consumed less than it was recommended each day, and many people have not yet realized on the negative effects of water deficient for the body (pre-dehydration) on health and physical performance. This is the first study to analyze the drinking habits and hydration status of I ndonesians. We hope the results of this study will be useful for government and private sectors as well as academicians on providing information on types, amount, and sources and habitual of water intake, knowledge on safe drinking water, and magnitude of mild dehydration among teenagers and adults in two different ecological areas of I ndonesia.
This study might not be done without helps and supports from some important people and institutions. We would like to take this opportunity to thanks to the study team and field assistants who had worked hard as a solid team, as well as spent ideas, time and energy for the success of the study. Thanks also go to all the subjects, the principles of the high schools, and the health district medical doctors in Lembang and North Jakarta. We thank also to the Aqua Danone I ndonesia team who initiated the idea and supported the study.
Bogor, 2009 Principle I nvestigator
LI ST OF CONTENT
SUMMARY...I
FOREWORD...VI I
LI ST OF CONTENT...VI I I
LI ST OF TABLES...I X
LI ST OF FI GURE...X
1. I NTRODUCTI ON... 1
1.1. Background ... 1
1.2. Objectives ... 3
1.3. Expected Outputs ... 3
2. LI TERATURE REVI EW... 4
2.1. Role and Requirement of Water ... 4
2.2. Source of Water... 4
2.3. Determinants of Water Requirement and Consumption... 6
2.4. Hydration and Dehydration ... 11
2.5. Effects of Hydration on Physical Performance and Health... 12
2.6. Effects of Hydration on Mental and Cognitive Performance ... 13
3. METHOD... 16
3.1. Design and Location... 16
3.2. Sampling ... 16
3.3. Type and Method of Data Collection ... 18
3.4. Management of Data Quality ... 19
3.5. Data Processing and Analysis... 20
4. DRI NKI NG HABI TS AND STATUS OF HYDRATI ON... 21
4.1. Social, Economic and Health Characteristics of Subjects ... 21
4.2. Source and Type of Drinking Water ... 28
4.3. Water Consumption and the Reasons ... 29
4.4. Knowledge of Drinking Water ... 31
4.5. Physical Activities... 34
4.6. I ndicators and Status of Hydration ... 37
5. CONCLUSI ONS AND RECOMMENDATI ONS... 43
5.1. Conclusions ... 43
5.2. Recommendations ... 44
REFERENCES ... 45
LAPORAN VERSI BAHASA I NDONESI A ( I NDONESI AN VERSI ON REPORT).... 47
LI ST OF TABLES
Table 1. Water balance in human body ... 7
Table 2. Water requirement ... 10
Table 3. Water requirement estimation for teenagers and adults ... 10
Table 4. Body water losses and their indicators... 11
Table 5. Variable, data and method used ... 18
Table 6. Signs of dehydration ... 18
Table 7. Socio-demography characteristics of subjects ... 23
Table 8. Health aspects, frequency and length physical exercise ... 25
Table 9. Pocket money and expenditures for food and beverages ... 26
Table 10. Preferences to type of beverages and its reasons... 29
Table 11. Knowledge on drinking water... 32
Table 12. Percentage of subjects correctly answered questions on nutrition knowledge... 33
Table 13. Percentage of subjects who correctly answered to the detail questions Knowledge on water function and dehydration symptoms ... 34
Table 14. Time allocation of subjects for daily activities (hour/ day) ... 35
Table 15. Percentage of subjects based on physical activity level ... 37
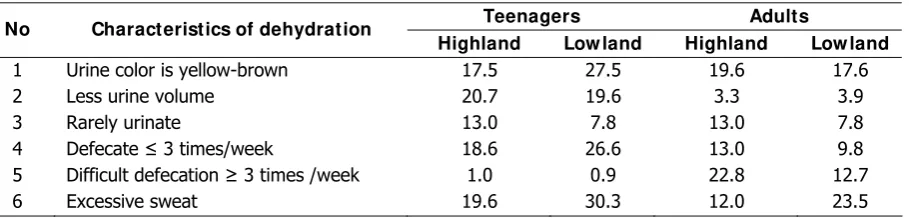
Table 16. Percentage of subjects by characteristics of dehydration ... 37
Table 17. Percentage of subjects having symptoms of dehydration during last week .. 38
LI ST OF FI GURE
Figure 1. Scheme of sampling procedure... 17
Figure 2. Nutritional status of teenagers in highland (A) and lowland (B) ... 23
Figure 3. Nutritional status of adults in highland (A) and lowland (B) ... 23
Figure 4. Family expenditure per month of teenagers ... 27
Figure 5. Family expenditure per month of adults ... 27
Figure 6. Teenager subjects categorized as mild dehydration... 40
I NTRODUCTI ON
1.1. Background
Human body requires water for the active and healthy life. The human body can only live about one week without water. Our bodies are comprised of 55-75% water. A state of negative fluid balance called dehydration, which occurs when the body water decrease > 1% of body weight. The dehydration caused by decreased water intake, increased water output (renal, gastrointestinal, or insensible losses), or fluid shift. The decrease in total body water causes reductions in both the intracellular and extra cellular fluid volumes. Clinical manifestations of dehydration are most closely related to intravascular volume depletion, and its progresses may result in end organ failure and death (Sawka and Montain, 2001).
Thirsty is the early and simple indication of pre-dehydration. However, water is not only required for releasing thirsty, but it is also needed as an essential nutrient. Drinking water have many important roles in the body, namely as a solvent, catalyst, lubricate, temperature regulator, and as a body mineral and electrolyte supplier. These all are very useful for high physical performance, stamina, better healthy body and mind, and wealthier life. Several studies done in overseas showed that the fulfillment of water requirement can prevent many symptoms of diseases, and diseases, and furthermore, make life more comfort and wealthier (FNRI, 2002; Whitmire, 2004).
Individual water requirements can vary greatly depends on physical activity, age groups, body weight, climate (ecology), and diet. In Indonesia, one of the thirteen messages of the Indonesian dietary guidelines, called Pedoman Gizi Seimbang (PUGS), is “Drink adequate amount of safe drinking water” (Ministry of Health, 1995). In that guideline, an Indonesian adult is suggested to drink 2 liters or eight glasses of safe drinking water everyday to accomplish the healthy body and good physical performance. Although the message already formulated since 1995, in reality the message was not yet popular in the community.
In 2004, the first time the National Food and Nutrition Workshop (WNPG – LIPI) discussed and promote the allowances (RDA) of water and electrolyte for Indonesians (Proboprastowo and Dwiriani, 2004). The workshop suggests that the RDA of water is from 0.8 to 2.8 liters per-day depends on age, sex, activity and temperate (ecological areas). However, it is more likely that people consumed less than it was recommended
each day, and many people have not yet realized on the negative effects of water deficient for the body (pre-dehydration) on health and performance. Further studies are required on the magnitude of the problem in Indonesia.
Rapid development may have negative side effects on the quality of ecology, including partly on the quality of air, soil and water. The more ecological changes, the more likely water contaminated and polluted. Public-private-academic partnerships are urgently required for better ecology, better drinking water supply, and better drinking water consumption for better healthy life and better physical performance of the Indonesian’s people.
Indonesia is an archipelago country consists of several temperate or ecological areas such as low land, high land and highland areas. Requirement of body fluid among people living in those areas can be different depend on the daily temperature and other factors. The higher temperatures the more likely people consume more water and beverages.
Although water is actually a nutrient, there is a tendency that some people neglect its important roles for health; some said water is a forgotten nutrient. Study in Singapore by Tamasek Polytechnic and AFIC (1998) showed that the teenagers and young adults (15 – 24 years) drink the least amount of fluid. This implied that the teenagers and adults, who are more physically active, are more likely to be vulnerable to mild-moderate dehydration. However, there is no such evidence in Indonesia. Meanwhile the number of Indonesian teenagers and adults is about 70 million – nearly one-third of the total population. Theoretically, the earlier the prevention of thirsty and mild-moderate dehydration, the better the health of teenagers and adults, which results in better physical performance, stamina, health, mind, and life.
The Food and Nutrition Society of Indonesian (PERGIZI PANGAN) has a mission on advocating and promoting food and nutrition science for the better life of the people, including healthy drinking water and beverage, through public-private–academic partnership. Besides, Aqua Danone has a commitment to supply quality mineral water for Indonesian families. Based on above considerations, PERGIZI PANGAN Indonesia, Department of Community Nutrition, Faculty of Human Ecology (FEMA) – Bogor Agricultural University (IPB), in collaboration with Aqua Danone are planning to conduct a study entitle Survey on Drinking Habits and Magnitude of Mild – Moderate Dehydration among Teenagers and Adults in Two Different Ecological Areas of Indonesia.
1.2. Objectives
The main objective of the study is to obtain a scientific evidences on types, amount, sources and habitual of water intake among teenagers and adults in two different ecological areas of Indonesia (North Jakarta and West Bandung). The specific objectives are as follows:
1. To study types, amount and sources of drinking water and beverages among teenagers and adults.
2. To study habitual drinking water and beverages (frequency, time, place, condition) among teenagers and adults
3. To study reasons of choosing several types of drinking water and beverages (bottle water, fountain water, boiled water, soft drink, sport drink, energy drink, milk, juice, and etc) among teenagers and adults .
4. To study perception and knowledge of teenagers and adults on water requirement, and safe drinking water, and its benefits.
5. To study the magnitude of dehydration among teenagers and adults.
1.3. Expected Outputs
Theoutputs of the study will be useful for government and private sectors as well as academicians, as follows:
1. Provide information on types, amount, sources and habitual of water intake among teenagers and adults in two different ecological areas.
2. Provide information on reasons of choosing several types of drinking water and beverages, and the perception and the knowledge on safe drinking water among teenagers and adults in two different ecological areas.
3. Provide information on the magnitude dehydration among teenagers and adults.
LI TERATURE REVI EW
2.1. Role and Requirement of Water
Water plays important roles in the human body, namely : 1) as a filler of each of good cavity in cell and also among body cell; 2) as part of body fluids or to forms body fluids such as blood, hormone, enzyme etc; 3) as a reaction promoter and a solvent for mineral, vitamin, amino acids, glucose, and other nutrients; 4) as vehicle for distribution, transportation, and use of nutrients and others in human body; 5) as vehicles for eliminating waste, toxin and metabolism products, and 6) as body temperature regulation ( Kleiner, 1999). Water is also important for taking care of vascular volume. Hydration of cell represents a good signal for metabolism regulation of cell and genetic expression (IOM, 2004).
Water is an essential nutrient needed for healthy life. However its important role is sometimes disregarded by people. Most people do not realize that they drink not enough water. Study done in Singapura showed that woman drink water 5-6 glasses and man drink 6-8 glasses everyday. Their water intake is lower than the recommendation (suggestion of serving size) namely 8 glasses of water every day. Only the old age group (55-64 year) and the adult (25-34 years) fulfill the requirement (AFIC, 2000). Study in Hongkong showed the same result that 50% subjects drink water less than 8 glasses, and even 30% of subjects drink less than 5 glasses.
Various study show relationship between hydration status with health status and physical performance. Dehydration can occurs acutely when drinking not enough water and having heavy physical activities. Dehydration can also occur chronically when water intake is not enough to fulfill the daily requirement. Both types of dehydration could negatively effects health status and physical performance. Signs of dehydration will be felt when the body water decreased of 1-2% of body weight.
2.2. Source of Water
Amount of water required by human body depend upon a balance between water intake and water outtake. Human body obtains water from consumption of food and beverage, and also from the result of metabolism. Solid food especially the fruit and vegetable provide significant contribution to water intake. While water excretes through
exhalation, husk, kidney (urine), and the digestion channel. It was estimated that the total body water loss for an adult with light activity is 1050 - 3100 ml per day ( IOM, 2004). A survey on adult population in USA showed that the 28% of water intake is from food, 28% from drinking water, and 44% from other beverage. Water intakes by someone depend on body water, activity level, ecology, and food pattern.
Human body can produce water through the oxidation in limited number. Study at male adult group with 70 kg weight showed that 2900 kcal energy intake will contribute 2900 ml water body per day. Water production in human body equal to 250 ml, hence the rest have to be fulfilled from drinking water and other beverages.
Natural food contains 40-90% of water. Water intake to human body commonly come from drinking water and beverages such as juice, canned beverage, and milk; and others come from solid food like rice, vegetable, and fruit. For example in List of Food Composition (DKBM), water contends in rice is 13%, 12% in flour, 60-70% in meat, 75-80% in fresh fish, 71-85% in vegetables, and 60-90% in fruits. Various study in several countries showed that there are variation contribution of water intake from multifarious beverages. Estimation of water content from various type of beverage is 95% in sport drink, 90-94% in fruit juice, and 87% in milk (WHO, 2005).
Data of NHANES III showed that mean of total water intake (from food and beverage) at male adolescent (14-18 year) is 3.4 L/day and female adolescent is 2.5 L/day. Total water intake of male adult (31-50 year) is 3.85 L/day and female adult is 3.10 L/day. Difference of water intake among inactive and active group at male is 0.6 L and 0.5 L at female (IOM, 2004).
to drink, 3) wasting time; 4) do not want too often to toilet. 70% subjects will take the drink after they feel thirsty, and in fact this was late because thirsty is early indication of dehydration.
Study in US showed that water intake to human body is 1764 ml per day, which consist of drinking water (673 ml), milk (312 ml), tea and coffee (360 ml), and the rest (420 ml) from soft drink ( Kleiner, 1999). This water intake is not inclusive from food. This study show has been happened mild dehydration at chronic level. Another study with 170 new officers at Johns Hopkins hospital as subject showed as much 5% and 27% subject have been dehydration at moderate and mild level.
2.3. Determinants of Water Requirement and Consumption
Total body water (TBW), comprising extra cellular fluid (ECF) and intracellular fluid (ICF), averages approximately 65% of body weight, with a range from approximately 55 to 75% (IOM, 2004). Body water is distributed between the ICF and the ECF, which contain 65 and 35 percent of TBW, respectively. The ECF is further divided into the interstitial and plasma spaces. An average 70-kg man has approximately 42 L of total body water, 28 L of ICF, and 14 L of ECF, with the ECF comprising approximately 3 L of plasma and 11 L of interstitial fluid. These are not static volumes, but represent the net effects of dynamic fluid exchange with varying turnover rates between compartments (Guyton & Hall, 2000 in IOM, 2004). Women and older persons have reduced TBW primarily because of having lower fat-free mass and increased body fat. Gender differences in TBW are not observed until after approximately 12 years of age (IOM, 2004), when boys start increasing their fat-free mass at a rate faster than girls do.
include clothing worn, ambient temperature, humidity, air motion, and solar load, and the rest loss through urine and fecal.
Water requirement for everyone will be different, depend on physical size, age, gender, occupation and environment. Estimation of water requirement express by energy intake, size of body surface, or body weight. Another factor that influences the requirement of water body is exercise, temperature, humidity, height, high fiber consumption, and loss of water body cause coffee and alcohol consumption. While its factors give various influence amongst group, so that there are no special corrective factor to stipulating water body requirement.
Loss of water body especially through kidney (urine) and digestion channel (fecal) referred as sensible/measurable water loss. While water loss through lung and skin referred as insensible water loss. The Kidneys are responsible to regulating water balance in human body. Amount of water intake and output will be formed water body balance and the detail show in following table (Whitmire, 2004):
Table 1. Water balance in human body
Water Body Volume ( ml) Source
I ntake 1400 Drinking water
700 Food
200 Cellular oxidation
2300 Total Output
Normal Temperature 1400 Urine
100 Feces
100 Skin
350 Skin (invisible) 350 Respiration (invisible)
2300 Total
High Temperature 1200 Urine
100 Feces
1400 Skin
350 Skin (invisible) 250 Respiration (invisible)
3300 Total
Source: Guyton AC. 1996. Textbook of medical physiology (Ed 9). WB Saunders.
a. Institute of Medicine (2004)
A simple formula of water body requirement is based on the amount of energy expenditure. Average of water requirement for the adult group is 1 ml/kcal, and for male adult is equivalent with 2900 ml and 2200 ml for female adult. Water body requirement for baby and children is 1.5 ml/kcal of energy expenditure (FNB 1989). At adult group, assumption for the calculation method are normal environmental condition, male with 19-50 years of age, 70 kg of body weight, and has low or medium activity. Result of this assumption is water body requirement equal to 2660-2870 ml/day or 11-12 cup (glass). Requirement for the people with high physical activity, such as athlete will be different with the standard above.
At 2004, FNB releases the Dietary Recommended Intake of water for male teenager (14-18 year) is 3.3 L/day and female 2.3 L/day. At adult group (19-70 year) the DRI of water is 3.7 L/day (male) and 2.7 L/day (female).
b. World Health Organization (2005)
Result from the review by ILSI and WHO the water requirement for hydration in adult group with normal condition is 2.9 L/day (male) and 2.2 L/day (female). Nevertheless for the labor in high temperature place equal to 4.5 L/day (male and female). Generally, water requirement is 2 L/day, but the requirement will increase as high as physical activity and temperature. Amount of sweat can reach 3-4 L/hour which vary depend on work intensity, temperature, air, humidity, cloud condition and cloths. US Military specify the consumption of drinking water is not to exceed 1.03 L/hour or 11.35 L/day.
c. Grant and DeHoog (1999)
According to Grant and DeHoog (1999) in Mahan and Escott-Stump (2004), water body requirement for adult group is calculated by its own body weight (BW). Water required is 100 ml/kg to the first 10 kg of BW, 50 ml/kg to the next 10 kg of BW, 20 ml/kg (age < 50 years) or 15ml/kg (age > 50 years) to the next of kg BW. For example, amount of water required by 40 years old male with 70 kg of BW is:
d. Zeman & Ney (1996)
According to Zeman & Ney (1996) in FNRI (2002), Estimation of water requirement at adult group is calculated based on the body weight (BW). Average of Requirement at 15-30 years of age is 40 ml/kg BW, 25-55 years of age is 35 ml/kg BW, 55-65 years of age is 30 ml/kg BB, and for age > 65 years old is 25 ml/kg BW.
Other estimation is pursuant by energy intake. Water requirement for child group is 1.5 ml/kcal, while at adult group is 1 ml/kcal. Beside that, the energy requirement is estimated by wide of body surface, that is 1500 ml/m. formula of the body surface is BB0.425 x TB0.725 x 71.8 or average of adult body surface is 1.73 m2.
e. Holliday and Segar (1957)
According to Holliday and Segar (1957) in FNRI (2002), Water body requirement calculated by body weight, 3-10 kg of BW equal to 100 ml/kg; 10-20 kg of BW equal to 1000 ml + 50 ml/kg the increasing of BW for each 10 kg; body weight > 20 kg equal to 1500 ml + 20 ml/kg the increasing of BW for each 20 kg.
f. Grandjean et al. (2003)
The water body requirement for adult group based on clinical practice is 35 ml /day. So that person who has 70 kg of BW will need water as much 2450 ml.
Amount of water required by human body depend upon a balance between water intake and water outtake. Human body obtains water from consumption of food and beverage, and also from the result of metabolism. Meanwhile, the water is excreted through exhalation, husk, kidney (urine), and the digestion channel. It was estimated that the total body water loss for an adult with light activity is 1050 - 3100 ml per day (IOM, 2004). A survey on adult population in USA showed that the 28% of water intake is from food, 28% from drinking water, and 44% from other beverage. Water intake by someone depends on body water, activity level, ecology, and food pattern.
Food And Nutrition Research Institute (FNRI, 2002) recommend that water requirement for child and teenager (1 - 18 years old) based on body weight, and for adult (> 18 years old) based on energy expenditure ( Tables 2). Especially for elderly should consume 1500 ml water per day, to avoid dehydration because decreasing sense of thirsty.
Table 2. Water requirement
Age Group Minimum Requirement per Day
Child & Teenager (1 – 18 year) BB : 10 – 20 kg
BB : > 20 kg
1000 ml (+ 50 ml/kg the increasing of BW for each 10 kg) 1500 ml (+ 20 ml/kg the increasing of BW for each 20 kg) Adult (>18 years old) 1 – 1.5 ml/kcal energy expenditure
Elder (> 65 years old) 1500 ml Source: FNRI (2002)
IOM (2004) recommended water allowance for American and Canadian based on adequate intake (AI). Based on result of consumption survey in USA, AI refers to median of total water intake (food and beverage) for healthy people. IOM (2004) was not give the number UL (Upper Level), because excessive of water consumption very rare happen in healthy people.
Tables 3 show recommended water allowance for Philippines (FNRI, 2002), American and Canadian (IOM, 2004), and also for Indonesian (AKG, 2004). This recommendation refers to a minimum recommendation water intake for Philippines and calculate based on healthy body weight of Indonesian and RDA for energy 2004.
Table 3. Water requirement estimation for teenagers and adults
Age Group FNRI ( 2002) ( L/ day)
I OM ( 2004) ( L/ day)
AKG ( 2004) ( L/ Day) Male
10 – 12 yr 1.8 2.4 1.8
13 – 15 yr 2.1 3.3 2.1
16 – 18 yr 2.3 3.3 2.2
19 – 29 yr 2.5 3.7 2.5
30 – 49 yr 2.4 3.7 2.4
50 – 64 yr 2.2 3.7 2.3
65 + yr 1.5 3.7 1.5
Female
10 – 12 yr 1.8 2.1 1.9
13 – 15 yr 2.1 2.3 2.1
16 – 18 yr 2.1 2.3 2.1
19 – 29 yr 2.0 2.7 2.0
30 – 49 yr 2.0 2.7 2.0
50 – 64 yr 2.0 2.7 2.0
65 + yr 1.5 2.7 1.5
2.4. Hydration and Dehydration
Dehydration is defined as a condition of water and electrolyte depletion that can cause serious injury and life-threatening (Thompson, Manore & Vaugan, 2008). It is explained that dehydration commonly happens because of excessive sports or an expose of high temperature whereas the body having significant body loss through excessive body water loss, through perspiration or respiration.
It is also said that dehydration could also happens in babies and older adults even they are not having an activity. These groups have a higher risk of dehydration than the teenagers and the adults. The total body water in older adults is decreasing and the thirsty mechanism is not as an effective as their age. Then it can be said that older adults has less ability to fulfill their body water requirement. In the other side, babies could excrete a lot of urine in one time yet have not had the ability to express their thirst. They also have a higher ratio of body surface and body core which respond dramatically to the current temperature (whether hot or cold) and loss a lot more body fluid compared to the older child. Table 4 shows the percentage of body weight loss and their symptoms.
Table 4. Body water losses and their indicators
% Body Weight Loss I ndicators
1-2 strong thirst, loss of appetite, feeling uncomfortable 3-5
dry mouth, reduced urine output, greater difficulty working & concentration, flushed skin, tingling extremities, impatience, sleepiness, nausea, emotional instability
6-8
increased body temperature that does not decrease, increased heart rate and breathing rate, dizzy, difficulty breathing, slurred speech, mental confusion, muscle weakness, blue lips
9-11
muscle spasms, delirium, swollen tongue, poor balance and circulation, kidney failure, decreased blood volume and blood pressure
Source : Thompson, Manore & Vaugan (2008)
2.5. Effects of Dehydration on Physical Performances and Health
About 12-15% of the population has kidneys stones with several inducing factors such as the drinking water habitual. The prevalence of kidneys stones resemble in the population which has low urine excretion so there are elevating concentrations that ease the formation of the stone. The risk will increase if the urine volume less that 1 liter per day. If the drinking behavior is increased until the urine excretion reaches 2-2.5 liters per day the formation of the kidney stones can be prevent even without the support of diet changing behavior and other medication.
Several studies show that there are a correlation between water consumption and the trend of cancer (bile, prostate, kidney, testicle, urethra, large intestines, and breast). Study in Seattle shown that women who drank more than 5 glass of water per day, had a decreased risk of having large intestines cancer of 45% compare to the ones who drank less than 2 glass of water per day.
It has been proven that in child and adult population, there is a correlation between the consumption of water with obesity reduction because consuming a lot of water can reduce hunger sensation. Besides that, mild dehydration in adult can cause salivary gland disorientation. Acute diarrhea can trigger mild to medium dehydration which is shown by dry mucous membrane of the mouth, dry skin, thirst, dizziness, and sunken eyes. Kleiner (1999) review the correlation of dehydration with health status usually in kidney stones patients.
Study review show that dehydration (1% of body weight loss) decreased physical and physiological performance that related to the sports ability. The reduction through 2.2% can lower the pulse rate and the increasing the incidence of stroke during light and excessive sports.
The effects of dehydration towards physical performance are being studied through two different sides of view which is voluntary and involuntary (Williams 2005). Voluntary dehydration often happen in athletes through perspiration by sports, the use of sauna, diuretics, or consuming less food or beverage. Involuntary dehydration usually happens through excessive perspiration during sports in a high temperature environment.
Studies on the effect of voluntary dehydration toward physical performances still inconsistence and needs further study (Williams 2005). It is explained that dehydration of 4-8% body weights did not interrupt the physical performances such as intense muscular effort, isomeric muscle strength or endurance. In the other side, it is reported that 4% dehydration has a significant effect towards anaerobic muscular endurance (slower to 20-30 seconds) and decreasing 15% knee extension endurance. The dysfunction mechanism analysis was related to the lost of cilium and the increasing of muscle temperature during sports. It is being stated that no study has shown that dehydration could increase physical performance.
Study on involuntary dehydration show that dehydration less than 2% of body weight has disturbed physical performances (Williams 2005). It is reported that it was related to the cardiovascular function and body temperature adjustment. Dehydration significantly decrease 4-8% maximal aerobic ability when the total body weight decrease into 3% in the athletes that doing sport in normal temperatures area and the disturbance getting severe in a high temperatures area. Dehydration also decreases plasma volume which affects the cardiac output and the stream flow of blood through skin and muscles. The reduction of blood flow through the skin is shown by the decreasing of perspiration and elevation of body temperature. The increasing status of dehydration will increase body temperature and heart beat and even decrease the amount of the blood that pumped by the heart per beat (stroke volume).
2.6 Effects of Dehydration on Mental and Cognitive Performance
The study of Gopinathan et al reflects the effect of dehydration caused by affected by the differences of weather towards mental performances. Two percents of liquid deficiency can decrease the arithmetic ability, short terms memory and visual focus.
dehydration. The subject progressively experienced disorientation on arithmetic ability, short-term memory and vasomotor function when less than 2% of body liquid decreased.
Cian et al. (2001) analyzed 7 healthy people in France by exposing them to heat and running on treadmill until their body weight loss reached 2.8%. Based on that research, dehydration could affect cognitive ability in short and long terms, perceptive discrimination and subjective estimates of fatigue.
Motoric coordination is sensitive to dehydration and could decrease even in mild dehydration (less than 1% of body weigh loss). Sarma et al. (1986) and Cian et al. (2000) showed that when the level of dehydration reached 2% then the cognitive ability in short and long terms, motorist coordination, reaction time, perceptive discrimination significantly decreased. A further level of dehydration of 3% could also further affect the cognitive ability. Arithmetic ability and the motorist speed showed significant degradation in the level of 4% of dehydration (Gopinathan et al., 1988). Besides that even in the 2% of dehydration, subjects felt exhausted easily (Chian et al., 2000).
Medium and severe dehydration determine cognitive function through intracellular, extra cellular and intravascular volume depletion (Wilson & Morley, 2003). Moreover, the hormonal and cellular approach is suggested to explain the relationships between dehydration effects towards cognitive performance. It is because the complicated mechanism of neurobiological which affect cognitive ability. Normally water homeostatic can be managed by our body automatically if there is an imbalance situation that interrupted the stability of body fluid. In sever accident or in a merge disorientation cases, an excessive respond of homeostatic can induces physiologic disorder. This condition is described by cellular responds to dehydration in molecular level through intracellular calcium accumulation which trigger nerve inactivation.
Even though study reports still inconclusively stated but there are a tendency that dehydration status could elevate cortisol serum (hypercortisolemia). This is relevant with the hypothesis of cognitive disorientation because medium dehydration can be caused by cortisol hormone. Study in animal assay showed that even though hypercortisolemia seemed not to affect the passive learning but there were a tendency to reduce active learning ability and short term memory.
through the mechanism of central homeostatic. Recently, NOS is being considered as important neurotransmitter molecules because it’s existence in all parts of the brain and holds an important role as a retrograde messenger factor in facilitate the long term memory. Animal assay study report has supported the NOS function as a central diffusible messenger in facilitating learning process and memory.
It is explained further that the cellular study has shown that glutamate hyper transition related closely with cellular dehydration and reduce cellular energetic. The isolated cell research showed that cell dehydration increase protein catabolism that release amino acid in the cell. The increasing of glutamine release in the cell which occurs when cell dehydrate and the intracellular glutamine concentration decrease when injure.
Dehydration effect to cytokine as a cognitive ability medium still has not been clear. Tumor necrosis factor (TNF) and interleukin-1 (IL-1) as a mediator of acute phase respond towards high temperature dehydration still inconsistently showed its role. Study in animal assay has identified TNF receptor in the brain and nerve connection of IL-1 in mice hypothalamus. Mice atrocities also produce TNF in vivo.
METHOD
3.1. Design and Location
A cross sectional study design was applied for this survey. Considering the different temperature or climate (ecological area) will influence the water intake, two study sites will be chosen, namely: 1) West Bandung, close to Lembang (a highland area with 700-1050 m above sea level), which reflects a medium temperature or (daily temperature is about 22oC); and 2) North Jakarta (a low land area with 5-50 m above sea level), which reflects a high temperature (daily temperature is about 28oC). This study conducted at 13 - 31 October 2008.
3.2. Sampling
As mention in the background, teenagers and adults (15-24 years) are more likely to be a vulnerable group. Therefore, the subject for this study is teenagers (males and females), aged 15-18 years from each of the two study sites. Inclusion criteria of this study are 1) adolescent (15 – 18 year) and adult (25 – 50 year), 2) spent most of the time in the study site, 3) healthy. Exclusion criteria of the study are 1) not suffering kidney diseases, 2) diabetic, 3) liver diseases. Exclusion criteria determine by medical doctor and urine analysis. The minimum subject size for each study site was calculated based on a minimum subject formula for a cross sectional study design by considering the proportion of dehydration 30% (Manz and Wentz, 2005) as follows:
n ≥ zα2 x p (1 – p)/d2
n = minimum subject size zα2 = 1,96
p = 0,3 or 30% (Manz and Wentz, 2005) d = estimation accuracy (0,1)
Based on above formula, the minimum subject size for each sex group and for each study site is 41 or rounded into 50 people for each age-sex groups. Since there are two sex groups and two age groups and two study sites, the total number of subject is 50 x 2 (sex groups) x 2 (age groups) x 2 (sites), which is equal to 400 persons.
Considering most of this age group (15-18 years) is studying at the high schools, the way to select the subject will be technically and economically feasible through
selecting the high schools and higher education in each of the study sites (West Bandung and North Jakarta).
This study also covers the adult subjects. Subjects for adults are the teachers and parents of the school students aged 25-50 years of the two study sites:
Figure 1. Scheme of sampling procedure
List of SelectedTeachers and School Stafs List of Senior High School in North Jakarta/West Bandung
List of School appropriate with criteria
Selected school (2 schools/location)
List of First Grade Class met the criterias
List of Second Grade Class met the criterias
List of Third Grade Class met the criterias
Selected First Grade Class
Selected Second Grade Class
Selected Third Grade Class
List of students met the criterias (male/female)
List of students met the criterias (male/female) List of students met the
criterias (male/female)
List of Selected Student (male/female)
List of Selected Student (male/female) List of Selected Student
(male/female)
List of Teachers and School Stafs
3.3. Type and Method of Data Collection
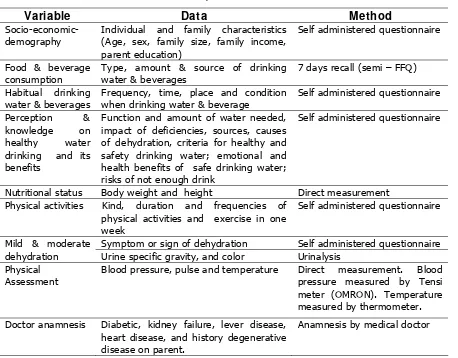
[image:30.595.81.539.168.526.2]Data to be collected are primary data. Table 2 shows the variables and method of each data to be collected.
Table 5. Variable, data and method used
Variable Data Method
Socio-economic-demography
Individual and family characteristics (Age, sex, family size, family income, parent education)
Self administered questionnaire
Food & beverage consumption
Type, amount & source of drinking water & beverages
7 days recall (semi – FFQ) Habitual drinking
water & beverages
Frequency, time, place and condition when drinking water & beverage
Self administered questionnaire Perception &
knowledge on healthy water drinking and its benefits
Function and amount of water needed, impact of deficiencies, sources, causes of dehydration, criteria for healthy and safety drinking water; emotional and health benefits of safe drinking water; risks of not enough drink
Self administered questionnaire
Nutritional status Body weight and height Direct measurement Physical activities Kind, duration and frequencies of
physical activities and exercise in one week
Self administered questionnaire
Symptom or sign of dehydration Self administered questionnaire Mild & moderate
dehydration Urine specific gravity, and color Urinalysis Physical
Assessment
Blood pressure, pulse and temperature Direct measurement. Blood pressure measured by Tensi meter (OMRON). Temperature measured by thermometer. Doctor anamnesis Diabetic, kidney failure, lever disease,
heart disease, and history degenerative disease on parent.
Anamnesis by medical doctor
The level of dehydration (mild – moderate) is assessed by some criteria’s such as criteria in following tables.
Table 6. Signs of Dehydration
Mild Dehydration Moderate Dehydration
1. Thirst
2. Headache
3. Fatigue
4. Flushed skin
5. Dry mouth and throat
1. Rapid heart rate
2. Dizziness
3. Weakness and lack of energy
4. Highly concentrated urine, but low in volume
3.4. Management of Data Quality 3.4.1. Control of Data Quality
To gain high quality data to be collected, four procedures of data quality control applied during the study period. The four procedures are: 1) Expert meeting or consultation for improving the study design and method; 2) Pre-testing of questionnaire or instruments to be used; 3) Controlling variation of inter-observer; and 4) Supervision of data collection.
To control inter-observer variation, training for field enumerators done prior to data collection. The enumerators for this study was graduated from S1 (Bachelor) in nutrition or public health. The training for all of filed enumerators conducted to explain the purpose and the method of the study, their tasks and responsibilities, and more importantly in how to collect data correctly using standardized procedures. The training includes class discussion and practices.
Re-interview of the subjects was conducted by area coordinator and research team to re-check data collected by enumerators. The re-interviewed focused on data of water intake and sign of mild-moderate dehydration. Supervision done by the study team and filed coordinator with the purpose to solve problems that may rise in the period of data collection as well as checking for data collection efficiency, completeness of data collection, and facilitation needed by enumerator during the data collection.
3.4.2. Data Entry, Verification and Cleaning
Data management includes completeness of data, reliability check of data, data entry, data verification and data cleaning. Regularly inspection on the completeness of data in the questionnaire was carried out directly in the filed to verify whether the identification number was given to each questionnaire and to check a missing or an incomplete information or data in the filled in questionnaire. The field coordinator responsible for these tasks. The study also conducted reliability check of data to identify the consistency of all inter-related variables.
different, the record is not match then rechecked. Data cleaning was conducted to check the completeness and the consistency of information that had been untried into the computer.
3.5. Data Processing and Analysis
Dehydration determine by criteria such as 1) urine specific gravity > 1.020, 2) urine color yellow condensed, 3) eritrosit 1-5/lpb, leukocyte 1-5/lpb or positive cylinder hialin, and 4) light proteinuria. Subject who diagnosed has hydration if the subject fullfilled all of dehydration criteria and show two dehydration symptom such as thirsty, dry throat, headache, flushed skin, dry mouth and lip, rapid heart rate, dizziness, and high concentrated urine but low in volume.
Index for normal category of BMI is range from 18.5 - 23,0 thin (CED) if less than 18.5 and overweight if more than 23.0 (WHO, 2004). Physical activity categorized by US-DHHS criteria (2008). Low level if time allocation for the medium intensity activity less than 150 minute/week, medium if the time allocation for medium intensity activity is 150-300 minute/week, and high if more than 150-300 minute/week. The examples for medium physical activity are fast walk, bike and gardening. Health level obtained if accumulation of medium physical activity is minimum 30 minute per day (WHO, 2003).
DRI NKI NG HABI TS AND
STATUS OF HYDRATI ON
1.2. Social, Economic and Health Characteristics of Subjects
This research involved two age groups which are teenager and adult group. Each group located in two different ecological areas (lowland and highland). The number of teenagers group in the highland are 97 people consist of 47 boys (48.5%) and 50 girls (51.5%). Meanwhile, the amounts of the teenagers in the lowland are 109 people consist of 59 boys (54.1%) and 50 girls (45.9%). The adult group in the highland are 92 people consist of 37 men (40.2%) and 55 woman (59.8%). The adult group in the lowland are 102 people consist of 44 men (43.1%) and 58 woman (56.9%).
The number of total subjects is more than the minimum required. The number of minimum subject required for each location per gender categories are 41 people. This amount is rounded to be 50 people to increase the accuracy of this research. The number of the adult group is less than the teenagers. To find adult subjects for this research is more difficult than the teenagers. They had to fill in questionnaire and provide urine samples (±10 ml) for urine analynalisis. After screening process, several adult candidates were drop out because they had not required the criteria such as kidney health. However, in general this research has already met the minimum requirement subject for statistical analysis.
The mean age of teenager group in the highland is 15.9 ± 1.0 year, while in the lowland is 16.0 ± 1.0 year. The age of the teenager’s group range from 15 to 18 years and this reflect the high school student at grade X, XI and XII. Therefore the teenagers recruited as subjects in this research correctly categorized as a teenager. According to WHO (1995) teenager age range from 10-19 years.
In the adult group, the mean age in the highland is 36.7 ± 8.4 year while in the lowland is 40.7 ± 9.8 year. The age of the adult group are from 36 up to 50 years. In the subject’s recruitment, the adult subjects must be under 55 years. However, for the most 50-55 years adults had health problems, so they were drop out as a subject.
The definition of family is a unit of people living in the same house and having blood relationship. The Coordination Agency of National Family Planning (BKKBN), a small
family consists of a father, a mother and two children (BPS 2000). The number of family members of the teenager subjects is from small family (≤ 4 people) to medium family (5 - 7 people). The mean of teenager family member in the highland and the lowland is 4.6 ± 1.2 and 4.9 ± 1.4 respectively. Meanwhile, the member of the adult family is in range of small to medium. The average number of adult family members in the highland and the lowland area is 4.5 ± 1.2 and 4.6 ± 2.0 respectively. There is an assumption when the family members are small, the mother attention to the member health care is much better, and this includes drinking water availability and sufficiency for all family members. According to Harper, Deaton and Driskel (1985), family size related to food consumption, whereas more the family member tends to less adequate food consumption for the family member.
In the teenager group, the distance of their house to the school in the highland and the lowland is 2.3 ± 2.8 km and 2.2 ± 3.2 km respectively. The teenager subjects spent about 7 hour/day at school, and the air temperature at the school is assumed not different with their home.
In the adult group, the distance of their house to workplace is 3.8±4.4 km in the highland and 9.8±17.2 km in lowland. In the lowland, Northern of Jakarta, where the urban societies are living, we found the far distance of working place is more than 5 km. However, the temperature of working place is almost similar with their home living (about 28°C). The adult subjects spent about 7 hour/day at the work place.
The environment temperature will influence the body physiological adjustment, which is related to the body respond, maintain and improve the quality of life. High temperature will increase body temperature and make some adaptation through sweat excretion mechanism. When the sweat is more and continually excreted without any adequate fluids replacement, it could lead to the dehydration.
A
64.9% 9.3%
25.8%
a. Kurus (IMT < 18.5)
b. Normal (18.5 ≤IMT≤ 23.0)
c. Gemuk (IMT >23)
B
29.4%
47.7% 22.9%
a. Kurus (IMT < 18.5)
b. Normal (18.5 ≤IMT≤ 23.0)
c. Gemuk (IMT >23)
A
31.5%
64.2%
4.3%
a. Kurus (IMT < 18.5) b. Normal (18.5 ≤IMT≤ 23.0) c. Gemuk (IMT >23)
B
17.6%
75.5%
6.9%
[image:35.595.81.547.92.463.2]a. Kurus (IMT < 18.5) b. Normal (18.5 ≤IMT≤ 23.0) c. Gemuk (IMT >23) Table 7. Social-demography characteristics of subjects
Ecological area No. Subject Characteristics
Highland Low land Total
Teenagers
1 Age (years) 15.9±1.0 16.0±1.0 15.9±1.0 2 Male (%) 48.5 54.1 51.5 3 Female (%) 51.5 45.9 48.5 4 Family member (person) 4.6±1.2 4.9±1.4 4.8±1.3 5 Distance from home to school (km) 2.3±2.8 2.2±3.2 2.3±2.9
Adult
[image:35.595.52.560.487.775.2]1 Age (years) 36.7±8.4 40.7±9.8 38.8±9.3 2 Male (%) 40.2 43.1 41.8 3 Female (%) 59.8 56.9 58.2 4 Family member (person) 4.5±1.2 4.6±2.0 4.5±1.7 5 Distance from home to school (km) 3.8±4.4 9.8±17.2 6.9±13.1
Figure 2. Nutritional status of teenagers in highland (A) and lowland (B)
In the adult group, the BMI indicate that most of the subjects are categorized as overweight (64.1% in highland and 75.5% in lowland); while the normal status is 31.5% and 17.6% respectively (Figure 3). It is show that the percentage of imbalance diet and physical activity in lowland is more higher compared to the highland area. The prevalence of chronic energy deficiency (CED) or thin adult in the highland area is less than in the lowland, area which is 4.3% in the highland and 6.9% in the lowland.
Figure 3. Nutritional status of adults in highland (A) and lowland (B)
Thin-CED (BMI < 18.5) Normal (18.5 ≤BMI ≤ 23.0) Overrweight (BMI > 23.0) Thin-CED (BMI < 18.5)
Normal (18.5 ≤BMI ≤ 23.0) Overrweight (BMI > 23.0)
Thin-CED (BMI < 18.5) Normal (18.5 ≤BMI ≤ 23.0) Overrweight (BMI > 23.0) Thin-CED (BMI < 18.5)
The overweight person indicates that the amounts of calories intake exceed the body requirement, which is called positive balance. The lowland area is a represent a metropolitan city located in North Jakarta; meanwhile, the highland area is a small towns namely Lembang and Cisarua in West Bandung. The adult subjects who live in the lowland prefer to eat fast food which is generally rich in simple carbohydrate (flour and sugar), high sodium and low fiber, and drink carbonated and high sugar. Their physical lifestyles are also tending to sedentary (body less motion). The high prevalence of overweight adult in lowland is very important when we concern with the risk problem such as coronary heart disease, hypertension, diabetes mellitus and also cancer.
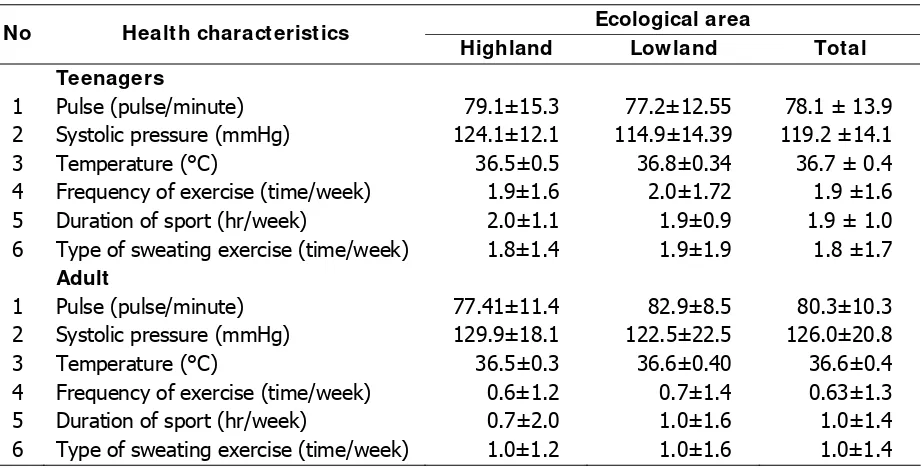
The average heart pulse of teenagers in highland is 79.1 ± 15.3; while in the lowland is 77.2 ± 12.55. In the adult group, the mean pulse is 77.41 ± 11.4 in the highland and 82.9 ± 8.5 in the lowland. Normal heart pulse range is in between 70 - 110 pulses, bradycardia is less than 70, and tachycardia is more than 110. Both of the subjects in two areas categorized as normal. The dehydrated person has a slow heart pulse.
Systolic pressure of the teenagers in the highland is 124.1 ± 12.1 mmHg; while in the lowland is 114.9 ± 14.39 mmHg. For teenager, the normal range of systolic pressures is 115 - 120 mmHg. For the adult, the systolic pressure in the highland is 129.9±18.1 mmHg and in lowland is 122.5 ± 22.5 mmHg. The mean of systolic pressure both for teenagers and adult subjects are better in the highland compared to the lowland. The teenagers and adults who live in the low land may have high salt intakes. These figures are also supported by the urinalyses related to the hydration status. The teenagers in the lowland tends to be hydrated, but not in the highland.
The body temperature of the teenagers in the highland is 36.5 ± 0.5°C and in the lowland is 36.8 ± 0.34°C. Meanwhile, at the adult body temperature in the highland is 36.5±0.3°C and in the lowland is 36.6±0.40°C. The body temperature categorized as normal between 36-37°C. Body heat loses is 75% from radiation, conduction and also sweat excretion; 20% from exhalation, and 5% from urine and fecal (Pearce, 1992).
the body temperature is high; it can cause fatigue (heat exhaustion) with symptoms as
exhausted, confused, queasy and weary. If the temperature increases up to 41°C, then it
can stimulate heat stroke and will imbalance fluids body circulation (Robergs & Roberts,
1997).
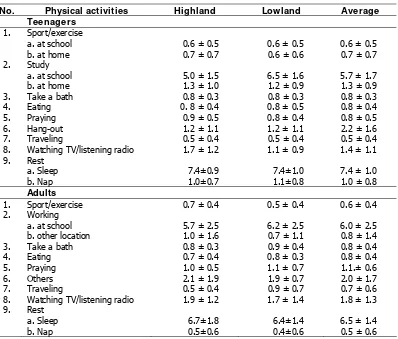
For the teenager, the frequency and sport intensity do not different at both ecological regions, which is twice a week and two hour per week. The kind of sweating sport is about twice a week. The teenagers of physical activity are still less compared to the healthy recommendation, which is only 0.5 hour/day with 5 - 6 times a week or total 2.5 - 3 hour. Regular physical activities potentially prevent the degenerative diseases such as heart attack, diabetes mellitus and cancer. Teenagers’ boys tend to have more exercise out-of school compared to the teenager girls. Wirna (2007) even reported that majority of teenage girls (59.7%) never have sports out-of school.
[image:37.595.77.538.448.682.2]Table 8 shows sport intensity on adult is lower than the teenagers for both ecological regions. The similar characteristics are for type of sweating sport. Teenagers have greater in sport frequency and duration and type of sweating sport compared to the adults.
Table 8. Health aspects, frequency and length physical exercise
Ecological area
No Health characteristics
Highland Low land Total
Teenagers
1 Pulse (pulse/minute) 79.1±15.3 77.2±12.55 78.1 ± 13.9 2 Systolic pressure (mmHg) 124.1±12.1 114.9±14.39 119.2 ±14.1 3 Temperature (°C) 36.5±0.5 36.8±0.34 36.7 ± 0.4
4 Frequency of exercise (time/week) 1.9±1.6 2.0±1.72 1.9 ±1.6 5 Duration of sport (hr/week) 2.0±1.1 1.9±0.9 1.9 ± 1.0
6 Type of sweating exercise (time/week) 1.8±1.4 1.9±1.9 1.8 ±1.7
Adult
1 Pulse (pulse/minute) 77.41±11.4 82.9±8.5 80.3±10.3 2 Systolic pressure (mmHg) 129.9±18.1 122.5±22.5 126.0±20.8 3 Temperature (°C) 36.5±0.3 36.6±0.40 36.6±0.4
4 Frequency of exercise (time/week) 0.6±1.2 0.7±1.4 0.63±1.3 5 Duration of sport (hr/week) 0.7±2.0 1.0±1.6 1.0±1.4
6 Type of sweating exercise (time/week) 1.0±1.2 1.0±1.6 1.0±1.4
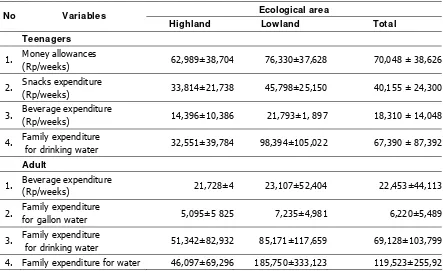
in Jakarta more allocated money expenses compare to the teenagers in small city such as Lembang and Cisarua. For the comparison, the average of money expenses in the favorite high school in Bogor is 87,918 ± 36,063 rupiah (n=246) is higher than in this study (Wirna, 2007).
[image:38.595.85.528.344.615.2]For the adult, expenditure to drink in the highland is 21,728 rupiah; while in the lowland is 23,107 rupee (Tables 9). This expenditure is slightly higher compared to the teenagers. It seen that the water and beverage expenditure in the lowland is higher than the highland areas. The temperature in the lowland is higher than the highland (28°C compared to 22°C). High temperature increase body temperature and to adjust the body will evaporated through sweating. The basal fluids excretion is required more water to be consumed.
Table 9. Pocket money and expenditures for food and beverages Ecological area
No Variables
Highland Low land Total
Teenagers
1. Money allowances
(Rp/weeks) 62,989±38,704 76,330±37,628 70,048 ± 38,626
2. Snacks expenditure
(Rp/weeks) 33,814±21,738 45,798±25,150 40,155 ± 24,300
3. Beverage expenditure
(Rp/weeks) 14,396±10,386 21,793±1, 897 18,310 ± 14,048
4. Family expenditure
for drinking water 32,551±39,784 98,394±105,022 67,390 ± 87,392
Adult
1. Beverage expenditure
(Rp/weeks) 21,728±4 23,107±52,404 22,453±44,113
2. Family expenditure
for gallon water 5,095±5 825 7,235±4,981 6,220±5,489
3. Family expenditure
for drinking water 51,342±82,932 85,171±117,659 69,128±103,799 4. Family expenditure for water 46,097±69,296 185,750±333,123 119,523±255,92
.
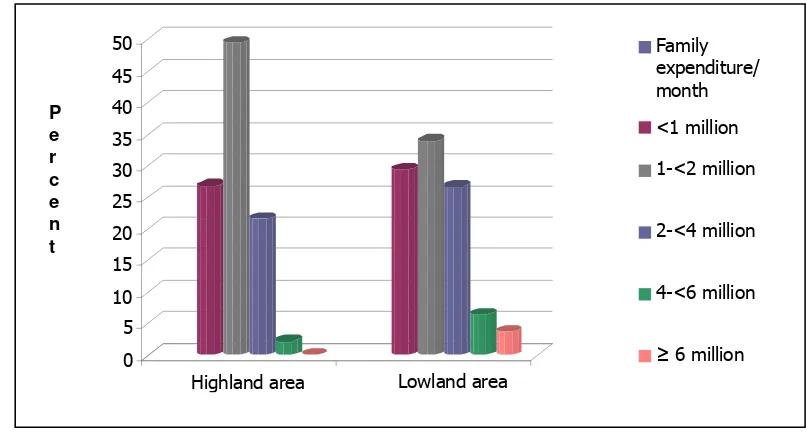
Figure 4. Family expenditure per month of teenagers
In the lowland, the teenager’s allocated beverage is higher than in the highland area. It seen that the water and beverage expenditure in the lowland is higher than the highland areas. The temperature in the lowland is higher than the highland (28°C compared to 22°C). High temperature increase body temperature and to adjust the body will evaporated through sweating. The basal fluids excretion is required more water to be consumed.
Figure 5. Family expenditure per month of adults
The amount of money spent to drink at school during one week in lowland is 21,793 rupiah and in highland is 14,396 rupiah. Meanwhile, the family expense for
0 5 10 15 20 25 30 35 40 45 50
Highland area Lowland area
Family expenditure/ month <1 million 1-<2 million 2-<4 million 4-<6 million
≥ 6 million
P e r c e n t P e r c e n t
Highland area Lowland area
Family expenditure
/month
< 1 million
1-< 2 million
2-< 4 mi