Leakage Current Analysis on Polymeric and
Non-Polymeric Insulating Materials Using
Time-Frequency Distribution
A. R. Abdullah, N.Norddin, N. Q. Zainal Abidin, A. Aman, M. H. Jopri Faculty of Electrical Engineering
Universiti Teknikal Malaysia Melaka (UTeM) Malacca, Malaysia
Abstract — This paper presents the performance of polymeric and non-polymeric insulation material in contaminated condition. The purpose of this study is to determine the accuracy of analysis technique on the performance these types of insulation against its tracking and erosion. Polypropylene and glass are selected as polymeric and non-polymeric material. Tracking and erosion test complying with BS EN 60587-2007 are conducted, then leakage current frequency components is used as a diagnostic tool for their surface condition monitoring and degradation severity. The analyses of leakage current are based on frequency domain and time-frequency representations are conducted. From the results, the surface condition of polymeric insulation material state can be classified accurately by using spectrogram compared to Fast Fourier Transform. It also proved that the performance of tracking and erosion of glass is better than polypropylene material.
Keywords-Inclined-Plane Test; leakage current; Fast Fourier Transform; Time-Frequency Representation; harmonic
I. INTRODUCTION
Insulation is the most vital part to avoid the flow of current to undesired paths in high voltage engineering or its applications. The major factors that resolve to the failure of the insulation are dielectric and electrical field which are the key properties of insulating material [1]. Polymeric insulators are widely accepted by many power utilities worldwide, including Malaysia. There are advantages and disadvantages between ceramic and polymer electrical insulation as explained in[2].
The surface of the insulator needs to have good hydrophobic properties in high voltage transmission system to avoid the incidence of contamination flashover [3]. Porcelain and glass are hydrophilic insulator often represent as ceramic whilst non-ceramic refer to hydrophobic materials [4, 5]. The ceramic insulator mostly have wet atmospheric conditions which create to water filming and existence of contaminations lead to uncontrolled leakage current and flashover occurred [6]. There are different of techniques used for determine hidrophobicity mostly involve surface material characterization
and chemical investigation. The Ganiometer, STRI classification and surface morphology by scanning electron microscope (SEM) used to establish loss of hydrophobicity of material surface. Apart from that, one of the indicator uses to determine performance of the insulation is leakage current signal (LC).
Most previous works use fast Fourier transform (FFT) to analyze the leakage current signal [7-9]. However, it does not provide temporal information and is not appropriate for non stationary signal. The analysis using time frequency representation (TFR) such as spectrogram can be used to identify the harmonic components for polymer and non-polymer materials.
Tracking and erosion test complying with BS EN 60587-2007 are conducted, then leakage current frequency components is used as a diagnostic tool for their surface condition monitoring and degradation severity. LC parameters such Irms, I1rms, ITHD, ITnHD, and ITWD instantaneously is estimated in order to develop and monitoring state condition of the materials insulating condition. Spectrogram in time representation provides information on frequency component with respect to time, frequency, and magnitude. The percentage of total waveform distortion TWD% is applied as rule based value for surface classification purpose.
II. MATERIALS
Porcelain and glass are hydrophilic insulator often represent as ceramic whilst non-ceramic refer to hydrophobic materials [4].
A. Polymer (Polypropylene)
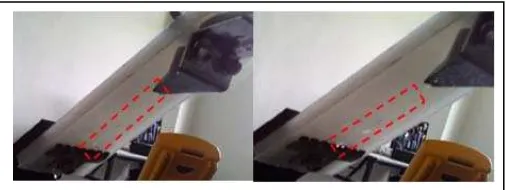
Fig. 1. Area sparking occur on the Polypropylene material during the IPT test
B. Glass
The glass surface is smoother and more hydrophilic which diverse from polymer. These properties of hydrophilic cause the fluid that flows over this surface would spread to most areas of the glass surface. Similarly, it occurs in the vicinity of the glass surfaces when liquid contamination on the surface of the glass discharges as shown in the Fig. 2.
Fig.2. Area sparking occur on the glass during the IPT test
III. EXPERIMENTAL WORK
Inclined-Plane Test (IPT) is normally used to evaluate the tracking and erosion resistance of insulating materials and recommended by BS EN 60587[10]. It is a valuable tool for the comparison and evaluation of new and different materials under electrical stress, and to compare the suitability of materials for the dielectric surface of an insulator. Two materials are being evaluated which are non-polymeric (glass) and polymeric having the dimensions of 50 mm wide by 120 mm long and 6 mm thick and inclined at 45° angle as shown in the schematic Fig. 3 which is the experimental setup for IPT test that are subjected to high voltage of 3.5 kV. In the test procedure, since it is done in the same place every day, there are three parameters that are assumed constant; humidity, pressure, and temperature. As stated in the standard, the contaminant conductivity level is set to 2.533 S/m and its flow rate at 0.6 ml/min. A non-ionic wetting agent (Triton X100) is added as prescribed in the standard test to provide uniform liquid for contamination[11]. This test is carried out for 6 h for both materials at constant voltage. LABVIEW program is developed for LC data monitoring and storage for analysis purpose.
Fig.3. Experiment setup for IPT Test
IV. LEAKAGE CURRENT ANALYSIS
A. Analysis in Frequency Domain
Fourier transform is mathematical techniques which convert signal from time to frequency domain. Discrete Fourier transform (DFT) is a digital filtering algorithm that calculates the magnitude and phase at discrete frequencies of a discrete time sequence while fast FFT are computationally capable algorithms for computing the DFT. FFT is useful to get the magnitude and/or phase of a number individual or band of frequencies [12]. The current peaks of leakage current waveform are efficient tool to collect information about surface condition on polluted insulators and performing an FFT analysis to extract its frequency characteristics [13]. The FT is defined as:
∫
∞
∞ −
− =
=F xt x t e j ftdt
f
X( ) { ()} () 2π (1)
where x(t) is the time domain signal, X(f) is the FFT, and ft is the frequency to analyze.
B. Analysis in Time-Frequency Representation
Spectrogram is one of the time-frequency representations (TFR) that represents a three-dimensional of the signal energy with respect to time and frequency. The analysis technique is motivated by the limitation of fast-Fourier transform (FFT) to cater nonstationary signals whose spectral characteristics change in time. It is the result of calculating the frequency spectrum of windowed frames of the compound signal [14]. Normally, the short-time Fourier transform (STFT) is computed at a finite set of discrete values of ω. In addition, due to the finite length of the windowed sequence, the STFT is precisely represented by its frequency sample as long as the number of frequency sample is larger than the window length. Spectrogram provides a distribution of the energy signal in a time-frequency plane [15] and it can be defined as:
2 2 ) ( ) ( ) , ( x
S ∫
∞
∞ −
− −
= x w t e j f dt
f
t τ τ πτ (2)
where x(τ) is the input signal and w(t) is the window
C. Instantaneous RMS Current (Irms) The instantaneous RMS current is
∫
=
max 0)
,
(
]
[
f xRMS
t
S
t
f
df
I
(3)where Sx(t,f) is time-frequency distribution and fmax is
maximum frequency of interest.
D. Instantaneous RMS Fundamental Current (I1rms)
Instantaneous RMS fundamental current I1rms(t) is defined
as the RMS current at power system frequency [17] and can be calculated as:
2
,
2
)
,
(
2
)
(
1 1 1f
f
f
f
f
f
df
f
t
S
t
I
lo hi f f x RMS hi loΔ
−
=
Δ
+
=
=
∫
(4)where f1 is the fundamental frequency that corresponds to the
power system frequency and Δf is the bandwidth which is set to 50Hz.
E. Total Harmonic Distortion (THD)
THD is the relative signal energy present at non-fundamental frequencies and written as:
)
(
)
(
)
(
1 2 2 ,t
I
t
I
t
I
RMS Hh hRMS
THD
∑
=
=
(5)Where Ih,RMS(t) is RMS harmonic current and H is the highest
measured harmonic component.
F. Total nonHarmonic Distortion (TnHD)
Nonharmonics are not multiple integer signal components frequency of the power system frequency. Therefore, TnHD is referred as distinguishing between nonharmonic and noise, and is calculated as:
2 , 1
( )
( )
( )
M m RMS m TnHD RMSI
t
I
t
I
t
=
∑
(6)Where Im,RMS(t) is instantaneous RMS nonharmonic current and
M is the highest measured nonharmonic component.
G. Total Waveform Distortion (TWD)
TWD consists of harmonic distortion and nonharmonic distortion. It can define as:
2 2
)
(
)
(
)
(
t
I
t
I
t
I
TWD=
THD+
TnHD (7)V. RESULT AND DISCUSSIONS
A. Polymer (Polypropylene)
It is observed that at low voltages levels between 0-1 kV, no erosion and arcing activities occurred. At this level of
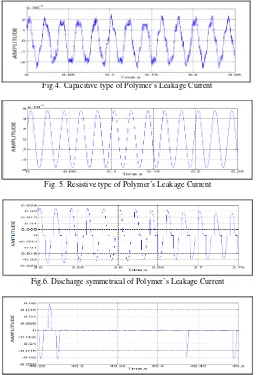
voltage, the LC is classified to capacitive type as shown in Fig. 4 at dry condition. On the other hand, at higher voltage levels between 1-2 kV, the LC is classified to resistive type which is a pure sinusoidal as shown in Fig. 5. Since the materials having the contaminant liquid at the surface before sparking occurs, LC flows and represented as pure sinusoidal waveform. In pure sinusoidal LC signal, only fundamental frequency signal is existed. The higher voltages until 3.5 kV will increase the energy and generate heat from arcing event and subsequently form dry-band on the surface which then leads to fast tracking and erosion[18]. This phenomenon form discharge activities as shown in Fig. 6. Arcing with lower sound is produced because of dry band region resulting from evaporation of conducting film. The effect of distorted non-linear symmetrical is associated with fundamental and non-fundamental frequency component.
Fig.4.Capacitive type of Polymer’s Leakage Current
Fig. 5. Resistive type of Polymer’s Leakage Current
Fig.6. Discharge symmetrical of Polymer’s Leakage Current
Fig.7. Discharge unsymmetrical of Polymer’s Leakage Current
0 0.2 0.4 0.6 0.8 1 1.2 1.4 1.6 1.8 2 0
50 100 150
Total Harmonic Distortion, THD
P
e
rc
e
n
t,%
0 0.2 0.4 0.6 0.8 1 1.2 1.4 1.6 1.8 2 0
50 100
Total Non-Harmonic Distortion, TnHD
P
e
rc
e
n
t,%
0 0.2 0.4 0.6 0.8 1 1.2 1.4 1.6 1.8 2 0
50 100 150
Total Wave Distortion, TWD
Time,s
P
e
rc
e
n
t,%
surface material condition. The frequency spectrum shows 1st and 3rd harmonics that occur from the LC as in the Fig. 9.
Fig. 8. Polymer’s leakage current on time-domain
Fig. 9. Polymer’s leakage current on frequency domain
As stated in [5] the hydrophobic condition of polymer can loss because of discharge activities and eventually fully regain their hydrophobicity. It can be seen that leakage current signal between glass and polypropylene is significant because of temporary loss of hydrophobicity during discharge. It shows the ‘rest’ time requisite for a full hydrophobic condition to take place as shown in Fig. 8.
Fig. 9 shows the 1st and 3rd harmonic even small value of nonharmonics at a specific frequency, meanwhile spectrogram distinguish in specific time, frequency and magnitude of those harmonics and nonharmonics that occurred as represented in Fig. 10. As stated in [19], the continuous discharges and random discharges show in periodic waveform analysis from frequency domain does not provide a clear signature compared to time frequency analysis that gives additional information. The nonharmonics exist in frequency domain but their amplitude values are too small compared to fundamental frequency and 3rd harmonic.
Fig.10. Polymer’s leakage current on time-frequency representation
Fig. 11. Harmonic components on leakage current of Polymer
B. Glass
During dry surface condition, there are no activities occur when the voltage level is increased from 0-3.5 kV. Meanwhile, during wet condition, it is observed that at low voltage levels between 0-1 kV, no erosion and arcing activities occurred but there is vapour on the glass surface. At this level of voltage, the LC is classified to capacitive type as shown in Fig. 12. On the other hand, at higher voltage levels between 1-2 kV, the LC is classified to resistive type which is a pure sinusoidal as shown in Fig. 13. At 2.5 kV, sparks have seen occur on the glass surface that started to form discharge activities as seen in the Fig. 14. From the observation, glass material shows no capacitive type in the discharge event differs from polymeric material. In fact, during discharge activities, its display only the pattern of symmetrical arcs.
Fig.12. Capacitive type of glass’s Leakage Current
Fig. 13. Resistive type of glass’s Leakage Current
Fig. 14. Discharge pattern of glass’s Leakage Current
40 60 80 100 120 140 160 0
0.5 1 1.5 2 2.5x 10
-5
Frequency, Hz
A
m
pl
itude
Frequency Spectrum
50hz
1440 144.5 145 145.5 146 50
100
Total Harmonic Distortion, THD
Time,s
P
er
c
e
nt
,%
1440 144.5 145 145.5 146 50
100
Total Non-Harmonic Distortion, TnHD
Time,s
P
er
c
ent
,%
1440 144.5 145 145.5 146 50
100
Total Wave Distortion, TWD
Time,s
P
er
c
ent
,%
0 0.2 0.4 0.6 0.8 1 1.2 1.4 1.6 1.8 2 0
0.005 0.01 0.015 0.02
Time (s)
A
m
pl
itude(
A
m
per
e)
irmspp irmsglass
Fig. 15 shows a LC pattern that was a deformed due to discharge activities. The leakage current is analyzed using Fast Fourier Transform (FFT) and the frequency spectrum is as shown in Fig. 16. The sampling frequency used is 5 kHz and frequency spectrum contained the LC values up to 2.5 kHz where the rest is the mirror image of the presented spectrum. Differ from PP, there are 1st, 3rd, and 5th harmonics for glass material tested.
Fig.15. Glass’s leakage current pattern on time-domain
Fig. 16. Glass’s leakage current on frequency domain
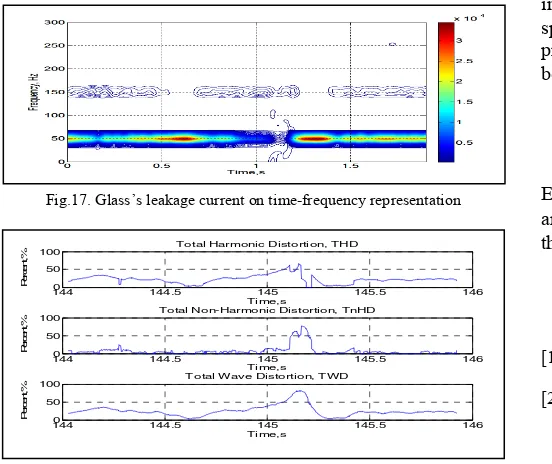
In the Fig. 17, it’s clearly shows 1st (fundamental frequency), 3rd, and 5th harmonic as shown in the frequency spectrum in Fig. 16. From the spectrogram, it reads at a particular time where the certain frequency occurs.
Fig.17. Glass’s leakage current on time-frequency representation
Fig.18. Harmonic components on leakage current of glass
The effect of distorted unsymmetrical is associated with harmonic and nonharmonic frequency component. The TWD for this condition of glass material is less than 100% as shown in Fig. 18. The higher TWD value is at the position of transition condition from symmetrical to unsymmetrical position as presented in Fig. 18.
VI. CONCLUSION
LC parameters such Irms, I1rms, ITHD, ITnHD, and ITWD
instantaneously is estimated in order to develop and monitoring state condition of the materials insulating condition. Spectrogram in time representation provides information on frequency component with respect to time, frequency, and magnitude. The frequency component is consisting not only harmonics but also nonharmonics (also known as inter-harmonics). Compared to polypropylene, glass material has lower TWD but higher RMS value as in Fig. 19.
Fig.19. RMS measurement of leakage current
Even though glass has lower TWD, due to hydrophilic property of the glass its surface condition contributes continuous LC flows behavior that sparks rapidly spread over the glass surface. It also form tracking more easier when compared to polymer which has greater hydrophobiticy property. From the results, the surface condition of polymeric insulation material state can be classified accurately by using spectrogram compared to Fast Fourier Transform. It also proved that the performance of tracking and erosion of glass is better than polypropylene material.
ACKNOWLEDGMENT
The authors gratefully acknowledge the Faculty of Electrical Engineering, Universiti Teknikal Malaysia Melaka and Universiti Teknikal Malaysia Melaka for the support for this study.
REFERENCES
[1] S. Naidu and N. M. S, High Voltage Engineering:
McGraw-Hill, 1999.
[2] M. A. R. M. Fernando and S. M. Gubanski, "Leakage
currents on non-ceramic insulators and materials," IEEE Transactions on Dielectrics and Electrical Insulation,vol. 6, pp. 660-667, 1999.
[3] Z. Fang, Y. Qiu, and E. Kuffel, "Formation of hydrophobic coating on glass surface using atmospheric pressure
non-250 Hz 150 Hz
thermal plasma in ambient air," Journal of Physics D: Applied Physics, vol. 37, p. 2261, 2004.
[4] D. Pylarinos, K. Siderakis, and E. Pyrgioti, "Measuring and analyzing leakage current for outdoor insulators and specimens," Reviews on Advanced Materials Science,vol. 29, pp. 31-35, 2011.
[5] D. K. Bhana and D. A. Swift, "An investigation into the temporary loss of hydrophobicity of some polymeric insulators and coatings," in Properties and Applications of Dielectric Materials, 1994., Proceedings of the 4th International Conference on, 1994, pp. 294-297 vol.1.
[6] J. Zhidong and G. Zhicheng, "The discharge along
hydrophobic and hydrophilic surfaces," in Electrical Insulation, 2002. Conference Record of the 2002 IEEE International Symposium on, 2002, pp. 280-284.
[7] M. A. R. M. Fernando and S. M. Gubanski, "Analysis of leakage current wave forms for field-aged and new composite insulators," in Electrical Insulation and Dielectric Phenomena, 1997. IEEE 1997 Annual Report., Conference on, 1997, pp. 350-353 vol.1.
[8] A. Krivda, L. E. Schmidt, X. Kornmann, H. Hillborg, H.
Ghorbani, A. Ghorbandaeipour, and M. Eriksson, "Inclined-Plane Tracking and Erosion Test according to the IEC 60587 Standard," in Electrical Insulation and Dielectric Phenomena, 2008. CEIDP 2008. Annual Report Conference on, 2008, pp. 263-267.
[9] H. H. Kordkheili, H. Abravesh, M. Tabasi, M. Dakhem,
and M. M. Abravesh, "Determining the probability of flashover occurrence in composite insulators by using leakage current harmonic components," Dielectrics and Electrical Insulation, IEEE Transactions on, vol. 17, pp. 502-512, 2010.
[10] "Electrical insulating materials used under severe ambient conditions - Test method for evaluating resistance to tracking and erosion," ed: BS EN 60857:2007, 2007. [11] R. J. Chang and L. Mazeika, "Analysis of electrical activity
associated with inclined-plane tracking and erosion of insulating materials," Dielectrics and Electrical Insulation, IEEE Transactions on, vol. 7, pp. 394-400, 2000.
[12] E. P. Leite, Matlab - Modelling, Programming and
Simulations: Sciyo.
[13] M. A. Douar, A. Mekhaldi, and M. C. Bouzidi, "Flashover process and frequency analysis of the leakage current on insulator model under non-uniform pollution conditions," IEEE Transactions on Dielectrics and Electrical Insulation, vol. 17, pp. 1284-1297, 2010.
[14] A. R. Abdullah, A. Z. Sha'ameri, and N. M. Saad, "Power quality analysis using spectrogram and gabor transformation," 2007.
[15] A. R. Abdullah and A. Z. Sha'ameri, "Power Quality
Analysis Using Linear Time-Frequency Distribution," presented at the IEEE International Conference on Power and Energy (PECon), Johor Baharu Malaysia, 2008. [16] H. I. S. Jayasundara, W. P. S. Sudarshani, and M. A. R. M.
Fernando, "Leakage current patterns on high voltage insulators: Analysis on frequency and time-frequency domains," 2008.
[17] A. Kusko and M. T. Thompson, Power Quality in Electrical Systems: McGraw Hill, 2007.
[18] A. El-Hag, L. H. Meyer, and A. Naderian, "Experience with salt-fog and inclined-plane tests for aging polymeric insulators and materials," Electrical Insulation Magazine, IEEE, vol. 26, pp. 42-50, 2010.
[19] M. A. R. M. Fernando and S. M. Gubanski, "Ageing of