Target detection of hyperspectral
images based on their Fourier spectral
features
Target detection of hyperspectral images based on their
Fourier spectral features
Khairul-Muzzammil Saipullah Universiti Teknikal Malaysia Melaka
Faculty of Electronic and Computer Engineering (06) 5552160, Malaysia
Deok-Hwan Kim Inha University
Department of Electronic Engineering 032 860 7424, Republic of Korea E-mail:[email protected]
Abstract. Original spectral features contain information pertinent to cer-tain target spectral features. Without an efficient spectral feature extraction method, the target detection performance might be degraded. We present spectral feature extraction techniques based on the Fourier domain for use in target detection. These feature extraction methods are the Fourier mag-nitude (FM), Fourier phase (FP), and Fourier coefficient selection (FCS) methods. In our target detection experiments, we compared the proposed methods to the principle component analysis (PCA) and independent com-ponent analysis (ICA) methods and the original spectral features. The experiment results show that the FCS target detection accuracy is 95.75%, whereas the accuracies of the FM, FP, PCA, ICA methods, and the original spectral features are 86.76%, 36.28%, 84.51%, 74.49%, and 78.92%, respectively. The average feature extraction times of the pro-posed methods are 223% faster than that found for the PCA and 304% faster than the ICA methods.©2012 Society of Photo-Optical Instrumentation Engi-neers (SPIE).[DOI:10.1117/1.OE.51.11.111704]
Subject terms: target detection; Fourier spectral feature; dimensionality reduction; hyperspectral image.
Paper 120304SS received Mar. 1, 2012; revised manuscript received May 7, 2012; accepted for publication May 8, 2012; published online Jun. 11, 2012.
1 Introduction
With the development of the hyperspectral sensor, research-ers in the remote sensing field are now able to extract ample spectral information to identify and discriminate between the spectral similarities of materials. The hyperspectral image (HSI) covers a large number of bands, which results in more accurate and detailed information regarding each mate-rial compared with other remotely sensed data, such as multi-spectral images. A typical HSI covers up to several hundred bands. Although a HSI provides more information, it has some disadvantages. Due to a huge number of dimensions in a HSI, an extremely high computational complexity is required. The greater the number of dimensions, the worse the discrimination becomes1; this is because a HSI contains a huge amount of spectral redundancy.2Therefore, the reduc-tion of the spectral dimensionality is indispensable in per-forming classification or target detection.
The most widely used algorithm for dimensionality reduction in the remote sensing field is the principal compo-nent analysis (PCA).3The PCA computes orthogonal projec-tions that maximize the amount of data variance, and yields a dataset in a new uncorrelated coordinate system. An improvement to the PCA is the independent component ana-lysis (ICA),4which uses higher order statistics. Some other methods utilize multiscale approaches, such as derivative spectroscopy5and the wavelet transform,6to extract relevant features from hyperspectral signals. In the derivative spectro-scopy method, a smoothing operator and a derivative opera-tor are used to detect “hills”and “valleys”in the spectral curves, whereas in the wavelet transform method, the means of hyperspectral curves using windows of various widths are applied during the feature extraction.
In single target spectral detection, one needs to discrimi-nate between the target class and the background, which usually contains more than 10 material classes. Although all of the dimensionality reduction methods are able to reduce the number of spectral bands and extract informative data regarding the spectral features, the effectiveness of the target detection feature recognition through the PCA or ICA methods is usually low and consumes a large amount of pro-cessing time. Therefore, the thrust of this research was to develop a fast and effective feature extraction method of the spectral features used for target detection.
In this paper, we present three target detection spectral feature extraction techniques based in the Fourier domain. These feature extraction methods are: Fourier magnitude (FM), Fourier phase (FP), and Fourier coefficient selection (FCS). For the FM and FP methods, the spectral features were converted into the Fourier domain and the magnitude and the phase of the Fourier complex coefficient were selected as the spectral feature. In regards to the FCS method, the real and the imaginary coefficients of the spectra’s Four-ier complex coefficient were compared. The real coefficients that were larger than the imaginary coefficients and the ima-ginary coefficients that were smaller than the real coefficients were selected for the spectral feature. This FCS technique employed the significant information extracted from the real and imaginary coefficients as being successfully applied in the feature extraction of the texture images.7,8Because the Fourier domain groups the coefficients from the most signif-icant data to the least signifsignif-icant data, we easily selected the most significant data to reduce the dimensionality of the spectral feature. Moreover, through the use of the fast Fourier transform method, the computation of the FCS, FM, and FP consumed only a small amount of time.
The feature extraction methods were evaluated through the detection of three real targets placed on the ground before 0091-3286/2012/$25.00 © 2012 SPIE
the HSI was taken. Three target detection algorithms, the matched filter (MF), generalized likelihood ratio test (GLRT), and adaptive coherence/cosine estimator (ACE) methods were tested along with the spectral feature extrac-tion methods. The remainder of this paper is organized as follows: Sec. 2 presents related work, Sec.3 presents the detailed algorithms of the proposed feature extraction meth-ods based on the Fourier domain phase, the experiment eva-luations are described in Sec. 4, and the conclusions and future work are discussed in Sec. 5.
2 Related Works
2.1 Principle Component Analysis
Milton et al.3used the PCA to reduce the spectra ality. The spectra can be converted to the relevant dimension-ality by a linear transformation with the significant eigenvectors computed from the PCA. When the eigenvec-tors are convolved with the spectra, they transform the spec-tra into fewer data points. The eigenvectors are determined by computing the covariance matrix of the mean of the spec-tral data matrix by:
gle band measurement, N is the number of spectra in the matrix, j and k are indices over the spectral bands, and i is an index over the number of spectra. The covariance matrix is then diagonalized by finding a matrixQin such a manner that:
½Q−1½C½Q ¼ ½λ½I; (2)
whereIis the identity matrix. The columns of matrixQare the eigenvectors and the column matrixλrepresents the
cor-responding eigenvalues. Matrixλis then sorted in
descend-ing order. The resultdescend-ing PCA feature is the element of matrix Q corresponding to the sorted eigenvalues indices. The sorted matrix Qis also named as the principle component of the spectra data. The principle component is sorted from the significant eigenvectors to the less significant eigen-vectors. These eigenvectors are then used as the feature vec-tors of the spectra.
2.2 The ICA
The goal of the principle component analysis is to minimize the reprojection error found in compressed data. The goal of the ICA is to minimize the statistical dependence between the basis vectors. Mathematically, this calculation can be written as:
WXT¼U; (3)
where the ICA finds the linear transformationWthat mini-mizes the statistical dependence between the rows ofUgiven by data matrix X. The basis vectors in the ICA are neither orthogonal nor ranked in order. There are a great many algo-rithms used to findW The algorithm proposed by Kolenda et al.9will be applied. This ICA algorithm is an enhanced
version of the Molgedey and Schuster algorithm4that pos-sesses a fast computation of the model. LetXτ ¼ fXj;tþτgbe the time shifted data matrix whereXj;tis the frequency of the
j’th term during timet. The lag parameterτis automatically
determined by exploiting the difference between the autocor-relations of the data matrixX. Then by using the singular value decomposition (SVD) method, the principle compo-nent subspace is calculated by decomposing:
X¼UDVT: (4)
The quotient matrix can now be written as:
^
Q¼1 2DðV
T
τVþVTVτÞD−1¼ΦΛΦ−1: (5)
TheΦcontains the rectangular ICA basis projection onto the PCA subspace andUholds the projection from the PCA subspace. The estimated mixing matrix and the source sig-nals are given by:
A¼UΦ (6)
S¼Φ−1DVT: (7)
Φcan be selected according to the significant principle com-ponents. By only selecting a certain number of significant principle components after the SVD, the dimensions of the input data can be reduced. The final estimated source signals S are used as the feature vectors of the input data.
3 Proposed Method
This section presents the proposed feature extraction methods based on the Fourier domain, the FCS, FM, and FP methods. The first step was to transform the original spec-tral sðnÞ, n¼0;2;3; : : : ; Nþ1 into the Fourier domain. The Fourier transform and inverse transform of sðnÞ are given by:
whereNis the number of dimensions of spectralsðnÞ. Using Eq. (8), the original spectral sðnÞ was converted to the Fourier coefficientsSðkÞ. For the FM feature extraction tech-nique, the magnitude ofSðkÞwas calculated using the fol-lowing formula:
FMðxÞ ¼qffiffiffiffiffiffiffiffiffiffiffiffiffiffiffiffiffiffiffiffiffiffiffiffiffiffiffiffiffiffiffiffiffiffiffiffiffiffiffiffiffiffiffiffiffiffiffiffiRefSðxÞg2þImfSðxÞg2: (10)
For the FP feature technique, the phase ofSðkÞwas cal-culated using the following formula:
FPðxÞ ¼tan−1
ImfSðxÞg
RefSðxÞg
And finally, for the FCS feature technique, a combination of the selected real and imaginary coefficients of SðkÞwas applied. The FCS was calculated using the following formula:
FCSðxÞ ¼RðxÞ þIðxÞ; (12)
where
RðxÞ ¼
RefSðxÞg; if RefSðxÞg≥ImfSðxÞg
0; otherwise
IðxÞ ¼
ImfSðxÞg; if ImfSðxÞg≥RefSðxÞg
0; otherwise : (13)
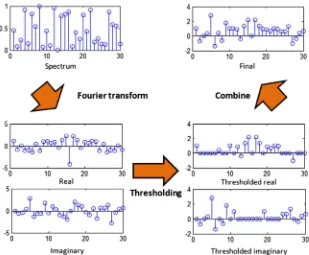
A graphical explanation of the FCS method is shown in Fig.1. First, the Fourier transform of the spectrum is calcu-lated. The first coefficient of the Fourier transform is very large compared with the other coefficients. For a clear gra-phical view of the Fourier coefficients, the first coefficient is normalized by dividing it by the sum of all of the coeffi-cients. Note that the normalization does not affect the discri-mination power of the feature extraction method. Because of this, the normalization is only done for the vivid graphical view of the coefficient and is not applied in the FCS to reduce the computation time. The Fourier transform will result in real and imaginary coefficients. Using Eq. (13), these coeffi-cients are thresholded according to the conditions given in the formula. Finally, the thresholded real coefficient and the thresholded imaginary coefficient are combined as in Eq. (12).
In Eqs. (11)–(13),xis the desired dimension of the spec-tral feature, which is in the range of0≤x<N∕2. The range ofxis limited to one-half of the original spectralN dimen-sion due to the redundancy of the Fourier transform of real numbers.10 The Fourier coefficients SðkÞof a real number repeat themselves in SðN∕2Þ. So only the halves of the
Fourier coefficientsSðkÞare significant. Because the Fourier domain groups the coefficients from the most significant data to the least significant data, the spectral feature can be easily reduced by selecting only the upper partFMðxÞ,FPðxÞ, and FCSðxÞwithin the range of0≤x<N∕2.
The magnitude and the phase of the Fourier coefficients are the basic feature extraction techniques widely used in the image and audio processing fields.11–13Some studies were performed on texture discrimination that apply the FCS approach.7,8 In these studies, the real Fourier coefficients were thresholded against the imaginary Fourier coefficients and converted into a binary code word. The approach used by the FCS was different from those studies in that the FCS does not only utilize the sign of the coefficients, but also Fig. 1The graphical explanation of the FCS method.
utilizes the value of the complex coefficients themselves. This produces a unique and specific pattern in regards to the FCS spectral feature, which is able to discriminate the spectral features used for target detection.
4 Experiment
This section discusses the experiment performed regarding the performance of the dimensionality reduction methods.
The methods are evaluated in terms of their spectral classi-fication accuracy and their HSI segmentation accuracy.
4.1 Experimental Setup
In the experiment, the proposed methods, namely the FCS, FM, and FP, were evaluated in terms of detection accuracy using various feature dimensions, receiving operating char-acteristic curves, detection versus threshold curves, and time
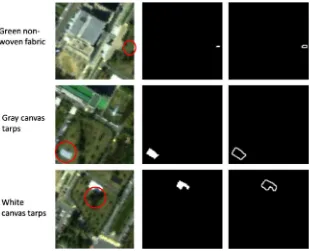
Fig. 3 The targets used in the experiment: (a) green nonwoven fabric, (b) gray canvas tarps, and (c) white canvas tarps.
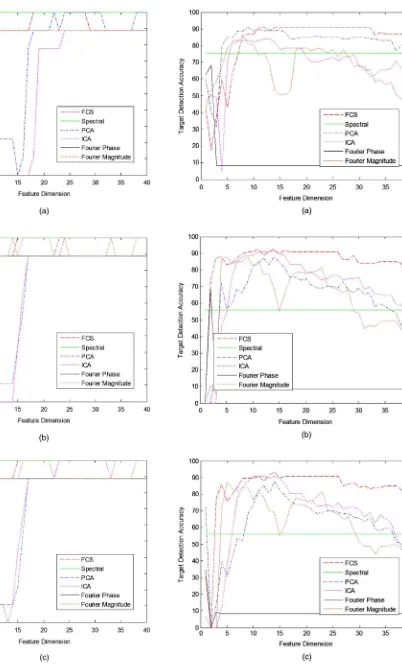
Fig. 5 The green nonwoven fabric detection accuracy according to method: (a) MF, (b) GLRT, and (c) ACE.
Fig. 6 The gray canvas tarp detection accuracy according to method: (a) MF, (b) GLRT, and (c) ACE.
efficiency. All of the experiments were executed on a com-puter with an Intel Core™ 2 Duo 2.33 GHz and 2 GB of main memory. The program was coded using MATLAB R2007a and the Windows XP operating system. The pro-posed FCS, FM, and FP methods were compared to original spectral features and two other dimensionality reduction fea-tures, the PCA and ICA methods discussed in Sec. 2.
A HSI of Inha University was used in the experiments. The resolution of the HSI is 545×618 pixels at a scale
of 30 m per pixel. These HSIs were captured using Hyperion sensors with a total of 96 bands after removing the noise bands and the corrupted bands. The wavelengths of the bands range from 365.2 to 1044.6 nm. The Inha University HSI in the RGB bands is shown in Fig. 2. The three real targets that were implemented in the experiment are indi-cated by circles. The targets were a green nonwoven fabric, gray canvas tarps, and white canvas tarps placed on the Inha University lawn. The images of the targets are shown in Fig. 3. The ground truth images of the three targets were carefully created by observing the spectral features manually. The three targets, their ground truth images, and the bound-ary of the ground truth images are shown in Fig.4.
The feature extraction methods were evaluated through the detection of three real targets that were placed on the ground before the HSI was taken. Three target detection algorithms, the MF,14 GLRT,15,16 and ACE17,18 were per-formed using the spectral feature extraction methods. To evaluate the FCS, FM, and FP algorithms, the spectral fea-ture extraction methods were compared to the PCA, ICA, and the original spectral features.
4.2 Experimental Results
The proposed FCS, FM, and FP methods were evaluated and compared with ICA, PCA, and the spectral feature methods through various experiments. The number of dimensions dif-fers for the FCS, FM, FP, ICA, and PCA methods according to their setup, whereas the number of dimensions for the ori-ginal spectral features always covers the entire 96 dimen-sional band. The first experiment measured the target detection accuracy using the various feature dimensions. Based on the results of the target detection accuracy experi-ment using the various feature dimensions, the most appro-priate dimension number was selected for the target detection accuracy with fixed feature dimensions. Finally, the effi-ciency of the spectral feature extraction was assessed by computing the target detection time consumption for each feature extraction method and target detector. The target detection accuracy was measured using the following formula:
Detection accuracy
¼Number of correctly detected pixels of the target Total number of pixels of the target :
(14)
4.2.1 Target detection evaluation
To ensure that the three target detectors, namely the MF, GLRT, and ACE methods, could operate automatically, the detection threshold of those target detectors were deter-mined. The detection threshold can be determined by using a constant false-alarm rate (CFAR) processor.19A CFAR
and background variations. By using an appropriate CFAR setting, target detection possessing a consistent false-alarm rate and high detection accuracy can be achieved. The performance of the original spectral feature can also be measured by scrutinizing how easily a threshold can be determined in maintaining a perfect balance between a low false alarm rate and high true positive or high correct target detection rate.20For this experiment, the CFAR was set to 0.001.
The target detection routines using the MF, GLRT, and ACE methods were repeated 40 times using different feature dimension sizes in the range from 1 to 40 dimensions. The target detection accuracies of the green nonwoven fabric using the MF, GLRT, and ACE methods with difference spectral features are shown in Fig. 5; the gray and white tarp results are shown in Figs. 6 and 7, respectively. As shown in Fig.5, the target detection accuracy was unstable at the beginning ranging wildly until it stabilized at a range of 15 dimensions and above. Most of the feature dimension results show an increase to 90% target detection accuracy. For the spectral feature extraction, the range was 100% because the spectra were not used in feature extraction. Figure6shows the results for the gray canvas detection accu-racy for different dimensions. In average, all the feature extraction increase in the 5 range and decrease when the range is 20 and above. From the graphs we can see that the FCS method was more stable than the other feature dimension methods. Figure 7 shows that the MF detector was better compared with the GLRT and ACE detectors,
the data was more stable and the difference percent of range was low.
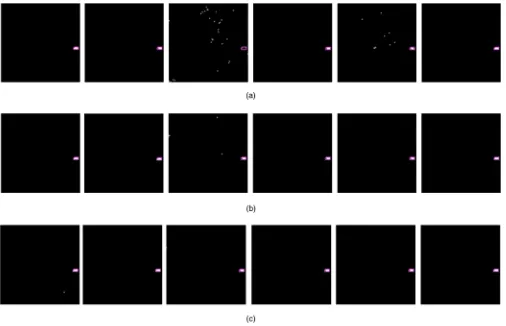
From these results, it can be seen that bydimension¼20, the detection accuracy became stable and high for all of the features in the MF, GLRT, and ACE methods for all three targets. Therefore the feature dimension of 20 was selected to execute the later experiments. To see the accuracy of the target detection accuracy visually, the segmentation between the target and the background was performed on all of the targets using the MF, GLRT, and ACE target detectors using the proposed and the other feature extraction methods. All of the target detection was done using dimension Fig. 8 The visual result of the green nonwoven fabric detection: (a) MF, (b) GLRT, and (c) ACE. White dots inside the target boundary are the true positives whereas outside the target boundary are the false positives; black is the background.
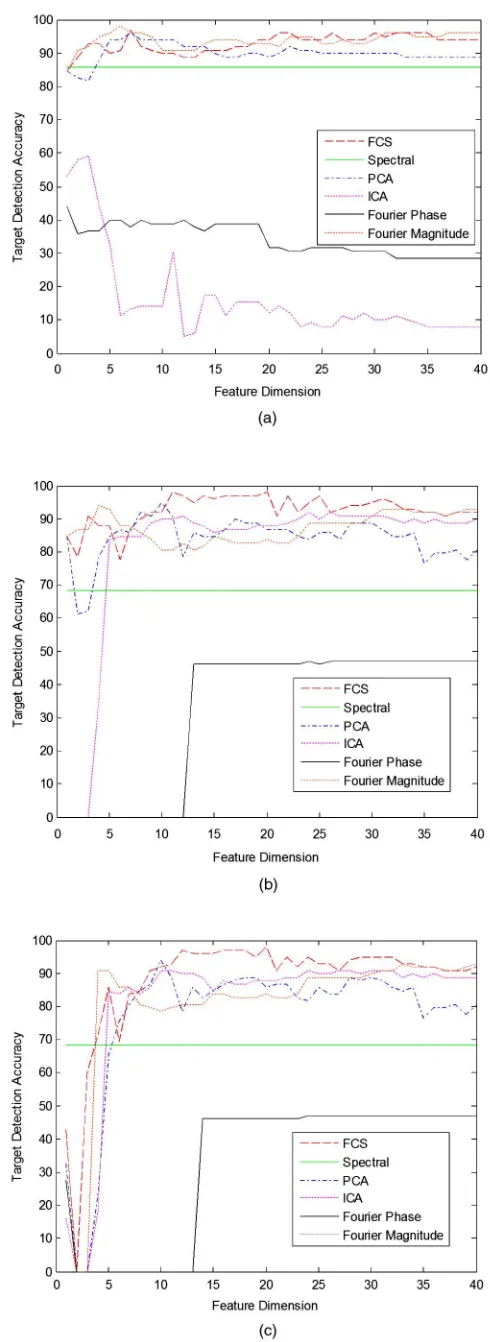
Fig. 9 The detection accuracy of green nonwoven fabric detection using MF, GLRT, and ACE target detectors.
D¼20,CFAR¼0.001. Figure8shows the target detection of the green nonwoven fabric. The target detection of this target was simple because the target was small and had a discriminative spectral feature. Most of the feature extraction methods were able to detect the whole target with a high true positive rate. Therefore, for the performance evaluation the detection of the false positives for each feature extraction method must also be observed.
Looking at Fig.8, it can be clearly seen that the FP and the original spectral methods performed badly for the MF target detector, generating a high false positive rate compared with the other feature extraction methods. For the GLRT and ACE target detectors, all of the feature extraction methods per-formed well, with a high correlation for true positives and few false positives. This demonstrates the superior perfor-mance of the GLRT and ACE target detectors compared with the MF detector. For an accurate observation of the tar-get detection accuracy, we refer to the bar plot shown in Fig. 9. For the MF detector bars, the FP feature extraction method was unable to detect any target. Compared with the MF, we can see from the bars that the ACE and GLRT target detectors are able to detect the target using all of the feature extraction methods. This shows the robust-ness of the ACE and GLRT detectors that can handle any type of input including the angle or phase. However, we were unable to conclude which detector or feature extraction method was better because the target was small and easy to detect. For a better comparison of the detectors and feature extraction methods, we analyzed the target detection
performance using the more difficult white and grey targets, because they were larger and contained more subpixels com-pared with the green nonwoven fabric.
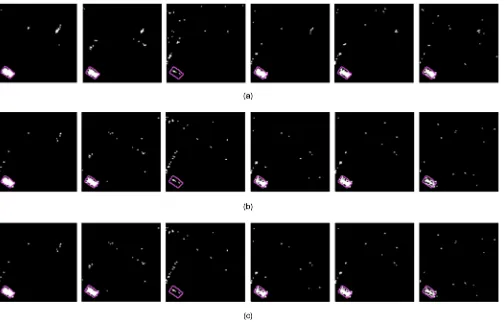
Figure10shows the target detection of the gray canvas tarps. Most of the feature extractors were able to detect the entire target but were unable to get a 100% accurate high true positive rate. There were some false positives detected by the detectors with a higher rate compared with the green nonwoven fabric detection. This is because of the large number of subpixels in the target. Most of the subpixels were located near to boundary of the target. These subpixels are hard to classify because they contain Fig. 10 The visual results of the gray canvas tarp detection: (a) MF, (b) GLRT, and (c) ACE. White dots inside the target boundary are the true positives whereas outside the target boundary are the false positives; black is the background.
other material spectral information. We can see that the FP and SPEC performed badly in all of the target detectors com-pared with other feature extraction methods. For the case of SPEC, no feature extraction was done to the spectral, so it still contains the redundant and insignificant information in it. FP is based on the phase of the spectra that contains posi-tive and negaposi-tive signs of the angles. These angle values are extremely sensitive to translation or position even a small change to the vector of the element in spectral could change the sign or the phase value significantly. Because of this dis-advantage, the performance of FP becomes inconsistent. For a better observation, we can see the bar plot of the accuracies as shown in Fig.11. If we focus on the SPEC and PCA detec-tion accuracies, the accuracies in ACE and GLRT are smaller than that of MF. This shows that MF could detect better using the raw spectra and eigenvectors compared with ACE and GLRT. But when it comes to Fourier transform based feature, ACE and GLRT perform better.
Figure12shows the target detection of the white canvas tarps. Most of the feature extraction methods were able to detect the entire target with a high true positive rate. From Fig. 12, the FP and ICA methods performed badly when the MF detector was employed. As explained before, MF is only good with the raw data and significant spectra vector (eigenvector) as implemented in PCA. Other approaches, such as ICA, perform badly in the MF. It can be seen that the FCS detector shows consistent accuracies in each target detector. To demonstrate the accurate observa-tion of the target, we refer to the bar plot in Fig. 13. The performance between the GLRT and ACE detectors were similar with a small difference in accuracies ranging from
0.01% to 10% for each feature extraction method. The accu-racy of FCS is slightly smaller in the MF compared with ACE and FCS. FCS is not based on the vector of the spectra so it performance might be lower in the MF.
4.2.2 The time consumption evaluation
Tables1–3show the time consumption in second (s) of the feature extractions (FE) and the target detections (DET) of the three targets using MF, ACE, and GLRT detectors. Each FE and DET operation underwent 100 iterations and the average time was recorded. The spectral method does not require feature extraction; its FE time is zero. From all of the tables, the target detection for Fourier (a) FCS, FM, FP, PCA, ICA, SPECTRAL using MF
(b) FCS, FM, FP, PCA, ICA, SPECTRAL using GLRT
(c) FCS, FM, FP, PCA, ICA, SPECTRAL using ACE
Fig. 12 The visual results of the white canvas tarp detection: (a) MF, (b) GLRT, and (c) ACE. White dots inside the target boundary are the true positives whereas outside the target boundary are the false positives; black is the background.
Fig. 13The detection accuracy of white canvas tarps detection using MF, GLRT, and ACE target detectors.
transform-based features (FCS, FP, FM) achieved the smal-lest time consumption compared with the other feature extraction methods. The time for the ICA and PCA feature extraction was longer than others. This method is not recom-mended for use in embedded systems or light computer sys-tems because the algorithm is more complicated and time consuming. Among all of the Fourier transform-based
feature extraction methods, FCS and FM consume less time compared with FP, because FCS and FM only utilize fast mathematical operations, such as addition, subtraction, and multiplication.
From the tables we can see that the MF detector consumes smaller time than other detectors when using the green nonwo-ven fabric. Table 2 summarizes the time consumption Table 1 The time consumption in second of the feature extraction (FE) and target detection (DET) of the green nonwoven fabric.
ACE GLRT MF
Method FE DET FEþDET DET FEþDET DET FEþDET
FCS 0.0765 0.1179 0.1944 0.1461 0.2226 0.0311 0.1075
FM 0.0554 0.1248 0.1802 0.1521 0.2075 0.0340 0.0894
FP 0.1002 0.2454 0.3456 0.2448 0.3449 0.3111 0.4113
PCA 17.8902 0.1435 18.0337 0.1860 18.0762 0.0217 17.9119
ICA 24.2299 0.3123 24.5422 0.3642 24.5941 0.0709 24.3008
SPEC 0.0000 0.1524 0.1524 0.2032 0.2032 0.0449 0.0449
TOTAL 1.0964 43.4486 1.2965 43.6487 0.5136 42.8658
Table 2 The time consumption in second of the feature extraction (FE) and target detection (DET) of the gray canvas tarps.
ACE GLRT MF
Method FE DET FEþDET DET FEþDET DET FEþDET
FCS 0.0775 0.0722 0.1497 0.0934 0.1708 0.0730 0.1504
FM 0.0566 0.0653 0.1219 0.0844 0.1411 0.0808 0.1374
FP 0.0987 0.1029 0.2016 0.1201 0.2187 0.0453 0.1440
PCA 17.9362 0.0584 17.9945 0.0756 18.0117 0.0501 17.9863
ICA 24.4663 0.0581 24.5245 0.0668 24.5331 0.0744 24.5408
SPEC 0.0000 0.0706 0.0706 0.0941 0.0941 0.0969 0.0969
TOTAL 0.4276 43.0628 0.5343 43.1696 0.4206 43.0558
Table 3 The time consumption in second of the feature extraction (fe) and target detection (DET) of the white canvas tarps.
ACE GLRT MF
Method FE DET FEþDET DET FEþDET DET FEþDET
FCS 0.0765 0.0579 0.1343 0.0753 0.1517 0.0562 0.1327
FM 0.0810 0.0480 0.1290 0.0621 0.1431 0.0522 0.1332
FP 0.0985 0.3096 0.4081 0.3981 0.4966 0.2108 0.3093
PCA 17.8045 0.0578 17.8623 0.0751 17.8796 0.0582 17.8627
ICA 24.3754 0.1089 24.4843 0.1372 24.5126 0.1877 24.5630
SPEC 0.0000 0.0705 0.0705 0.0943 0.0943 0.1020 0.1020
regarding the feature extraction and target detection of the gray canvas tarps. As shown in Table2, the FM feature extraction consumes the smallest time than other feature extraction meth-ods. The time consumption found for MF and ACE detector was almost identical; however, the MF detector performed bet-ter than the ACE detector in bet-terms of overall time consumption using all of the feature extraction methods. Table3shows the time consumption regarding the feature extraction and target detection of the white canvas tarps. As shown in Table3, the FCS method displayed the smallest time consumption regard-ing the feature extraction. The time consumption for the ACE detector was higher compared with the GLRT and ACE detec-tors, whereas the difference between the ACE and MF speeds was small.
5 Conclusion and Future Works
This paper proposed feature extraction methods based on the Fourier transform called the FCS, FP, and FM. FCS is based on the coefficient selection, whereas FP is based on the phase, and FCS is based on the magnitude. Among all of these feature extraction methods, FCS showed the most con-sistent and high discrimination output of the ACE, GLRT, and MF target detectors. In terms of time consumption, the Fourier transform-based feature consumes significantly smaller time compared with standard feature extraction methods, such as PCA and ICA. For the target detectors, MF performance depended on the feature. MF only worked consistently with the original spectra or the vectors of the spectra. ACE and GLRT seemed to be unaffected by the spectra feature type and generated more stable and consistent results compared with MF. For future works, we would like to build our own target detector that can be optimized the Fourier domain-based feature.
Acknowledgments
This work was supported in part by Basic Science Research Program through the National Research Foundation of Korea (NRF) funded by the Ministry of Education, Science, and Technology (2012-0001773), and in part by the Defense Acquisition Program Administration and Agency for Defense Development, Korea, through the Image Informa-tion Research Center at Korea Advanced Institute of Science and Technology under the contract UD100006CD, and in part by Key Research Institute Program through the National Research Foundation of Korea (NRF) funded by the Ministry of Education, Science and Technology (2012-0005858), and in part by Universiti Teknikal Malaysia Melaka.
References
1. D. Landgrebe,“Hyperspectral image data analysis,”IEEE Signal Pro-cess. Mag.19(1), 17–28 (2002).
2. N. Renard, S. Bourennane, and J. Blanc-Talon,“Denoising and dimen-sionality reduction using multilinear tools for hyperspectral images,”
IEEE Geosci. Rem. Sens. Lett.5(2), 138–142 (2008).
3. M. O. Smith, P. E. Johnson, and J. B. Adams,“Quantitative determina-tion of mineral types and abundances from reflectance spectra using principal components analysis,”J. Geophys. Res.90, 797–804 (1985). 4. L. Molgedey and H. Schuster,“Separation of independent signals using time-delayed correlations,”Phys. Re. Lett.72(23), 3634–3637 (1994). 5. F. Tsai and W. Philpot,“Derivative analysis of hyperspectral data,”
Remote Sens. Environ.66(1), 41–51 (1998).
6. L. M. Bruce, C. H. Koger, and J. Li,“Dimensionality reduction of hyperspectral data using discrete wavelet transform feature extraction,”
IEEE Trans. Geosci. Rem. Sens.40(10), 2331–2338 (2002). 7. V. Ojansivu and J. Heikkila,“Blur insensitive texture classification
using local phase quantization,”inProc. of 3rd ICISP'08, Vol. 5099, pp. 236–243, Springer-Verlag, Berlin, Heidelberg (2008).
8. K.-M. Saipullah and D.-H. Kim,“A robust texture feature extraction using the localized angular phase,”inMultimedia Tools and Applica-tions, pp. 1–31, Springer, Netherlands (2011).
9. T. Kolenda, L. K. Hansen, and J. Larsen,“Signal detection using ICA: application to chat room topic spotting,”inProc. Intl. Conf. on Indepen-dent Component Analysis and Blind Source Separation, pp. 540–545 (2001).
10. K. M. Saipullah et al.,“Texture classification by implementing blur, scale and grey shift insensitive texture descriptor based on local Fourier transform,”inProc. of IWAIT 2010p. 74, Kuala Lumpur, Malaysia (2010).
11. K. M Saipullah and D.-H. Kim, “Spectral dimensionality reduction based on intergrated bispectrum phase for hyperspectral image analy-sis,”inProc. of the SPIE Remote Sensing, Vol. 8180, 81801H, Czech Republic, Prague (2011).
12. F. Zhou, J.-J. Feng, and Q.-Y. Shi,“Texture feature based on local Four-ier transform,” inProc. of Intl. Conf. on Image Processing, Vol.2, pp. 610–613 (2001).
13. K. Muzzammil et al.,“Texture feature extractor based on 2D local Four-ier transform,”inproc. 31th (Korea Information Processing Society) KIPS Spring Conf., Vol. 16, pp. 106–109, Pusan, Korea (2009). 14. D. Manolakis et al.,“Is there a best hyperspectral detection algorithm?,”
Proc. SPIE7334, 733402 (2009).
15. E. J. Kelly,“An adaptive detection algorithm,”IEEE Trans. Aerosp. Electron. Syst.AES-22(2), 115–127 (1986).
16. E. J. Kelly,“Adaptive detection in non-stationary interference, part III,”
Technical Report 761, MIT Lincoln Laboratory (1986).
17. S. Kraut and L. L. Scharf,“The CFAR adaptive subspace detector is a scale-invariant GLRT,”IEEE Trans. Signal Process.47(9), 2538–2541 (1999). 18. S. Kraut, L. L. Scharf, and L. T. McWhorter,“Adaptive subspace
detec-tors,”IEEE Trans. Signal Process.49(1), 1–16 (2001).
19. D. Manolakis, D. Marden, and G. A. Shaw,“Hyperspectral image pro-cessing for automatic target detection applications,”Lincoln Laboratory J.14(1), 76–116 (2003).
20. D. W. J. Stein et al.,“Anomaly detection from hyperspectral imagery,”
IEEE Signal Process. Mag.19(1), 58–69 (2002).
Khairul Muzzammil Saipullahreceived his BS and MS degrees in electronics engineer-ing from Inha University, South Korea. He is currently working as lecturer at University Teknikal Malaysia Melaka. His research interests are real-time image processing for embedded devices, remote sensing, medical image analysis, robot vision for autonomous aerial vehicle, and embedded systems.
Deok-Hwan Kimreceived his MS and PhD from Korea Advanced Institute of Science and Technology. He is a professor of Inha University in Korea. His research interest includes storage system, embedded sys-tems, real-time image processing, medical image analysis, remote sensing, and brain computer interface.