INTERNATIONAl WORKSHOP ON TIMBER STRUCTURES
The Utilization of Low Density Timber As Structural Materials
Application of regardless of species conception for
mechanical stress grading on tropical timbers
BY
Anita Firmanti ,
セ
・ョ、ゥ@
Tri Bachtiar, Surjono Surjokusumo,
o e1 Komatsu, Shuichi Kawai
MINISTRY OF PUBLIC WORKS
Application of regardless of species conception for mechanical stress
grading on tropical timbers
Anita Firmanti \ Efendi Tri Bachtiar2, Surjono Surjokusumo2, Kohei KomatsuJ, Shuichi KawaiJ
1 Research Institute For Human Settlements, Jl. Panyaungan-Cileunyi Wetan , P.O. Box 812, Bandung
40008, Indonesia. Tel: + 62-22-779-8393, Fax:+ 62-22-779-8392
2 Faculty of Forestry, Bogor Agriculture University, Kompleks IPB Darmaga P 0. Box 69, Bogor
Indonesia. Tel : + Tel: +62-251-31-4294 ; Fax.: +62-251-31-4294
3 Wood Research Institute, Kyoto University, Uji , Kyoto 611-0011, Japan . Tel : +81-774-38-3673;
Fax: +81-774-38-3678
Key words: regardless of species, mechanical stress grading , tropical timbers, allowable stress,
reference resistance
Abstract. Some reports showed that for single species the relationship between modulus of elasticity
(MOE) and modulus of rupture (MOR) in bending was quite high. Tropical timbers consist of hundreds
species which were difficult to identify the timber species. This report is dealing with the application of
regardless of species conception for mechanical stress grading of tropical timber. Nine timber species
or group of species with total number of 1,094 pieces in 60x120x3,000 mm timber were tested in static
bending. MOE was measured in flat-wise while MOR was tested in edge-wise . Statistical analysis of
linear regression with dummy model and ANCOVA were used to analyze the role of MOE and effect of
species on the prediction of MOR. The analysis showed that using MOE as single predictor caused a
condition of under/over estimate for one or more species and/or group of species. The percentage of
the accuracy of prediction would be increased with species identification. An allowable stress and
of strength th rough timber grading. The timber strength class fo r species and/or group of species was
al so established to support the application of mechanical timber grading .
Introduction
As a material produced by the nature, wood has a large variation of strength and stiffness properties
among species even among pieces in one species. The variations of strength and stiffness are caused
by defects or imperfection conditions like knots (numbers, size and location in each piece of timber),
s!ape of grain , and interlocked grain as well . To guarantee the safety of structure, when timber is used
for structural purposes, predicting the strength of timber is necessary to be conducted. The strength
characteristic of a piece of timber should be evaluated by non-destructive methods . It could be done
through visual grading or mechanical grading or combination of such methods . For simplicity and
economy, pieces of timber of similar mechanical properties are placed in categories called stress
grades1l.
Tropical countries mostly are blessed with the biodiversity of the natural resources which means
hundreds or thousands of timber species available for the construction activities. In such cases, the
application of visual grading is complicated due to the difficulties of species identification and checking
on· the imperfection condition. Predicting the strength of wood in full-scale through density is poor in
coefficient of determination (R2). A set of study on Norway spruce (Picea abies) reported that the R2
value of the relationship between density and bending strength was in the range of 0.16 to 0.40 while
the R2 value of the relationship between the density and knots was 0.38. However, the stiffness which
is normally expressed as modulus of elasticity (MOE) is by far recognized as the best predictor of
strength2l. The most common method of sorting machine-graded lumber is to measure MOE1l. The R2
value of the relationship between MOE and bending strength (MOR) of Norway spruce was in the
range of 0.51 to 0.722.3l. The previous studies on acacia mangium timber showed the R2 value between
MOE in flat-wise and MOR was 0.614l and for mixed tropical wood of 0.535l. Combining MOE with
•
--In the application to the timber grading and strength classes, the strength of a piece of timber
regardless of species could be predicted and classified through measuring the MOE. Most species are
grouped together and the timber performances from such species are treated similar. With reference fo
the availability of timber for structural purposes consisting of plenty species in tropical countries, the
application of mechanical stress grading needs to be evaluated.
The objective of this study is to figure out the application of mechanical grading to tropical timber which
consists of timber from natural forest , timber from plantation forest , hardwood as well as softwood . It is
expected that the results could be utilized in timber structure design.
Materials and methods
The number of the specimens were 1,094 pieces of tropical wood consisting of the timber from natural
forest i.e. Kapur (Dryobalanops aromatica Gaertner f.) sp of 60 pieces., a group of meranti or Shorea
sp. of 192 pieces, and mixed unknown species namely "borneo" timber of 314 pieces as well as
hardwood from plantation forest i.e. Acacia mangium (Acacia mangium Willd) of 120 pieces4l , falcata
(Paraserianthes fa/cataria, L. Nielsen) of 60 pieces, rubber wood (Hevea brasiliensis, Willd) of 60
pieces, and maesopsis eminii (Maesopsis eminii Engler) of 60 pieces, and softwood from plantation
forest, i.e. pinus merkusii (Pinus merkusii Junghuhn & de Vriese) of 168 pieces and agathis (Agathis
dam mara Lambert Rich) of 60 pieces. The specimens were in full size of 60 mm x 120 mm x 3,000
(L) mm in air dried . For any piece of lumber, based on the visual grading system of Indonesian
Standard for Construction Timber (SNI 03-3527)6l, the imperfection condition was evaluated. Only
timber which classified as timber for building construction was used as specimens.
The MOE in flat-wise with center point loading was measured using a simple operated machine with a
deflectometer which can magnify the reading to about 40 times. Before measuring the MOE in flat-wise
the machine was calibrated based on a recognized dial gauge. Then the specimens were tested in
tons following the procedure of ASTM 0 1987l. Based on the moisture content and loading system,
adjusting factor had been applied to the MOE and MOR calculation based on the equilibrium moisture
content in Indonesia of 15 % and ASTM 2915 proceduresl.
Reg ress ion analysis was used for analyzing the relationship between MOE in flat-wise and MOR of
the timber. Based on the regression analysis , the allowable stress for the tropical wood and the stress
classification were established . The effect of timber species on the MOR of timber will be analyzed
using analysis of covariance (ANCOVA) with MOE as the covariate variable and the model as shown in
equation (1):
(1 )
キィ・セ・@ : Y ;;, measured MOR of species i1h and sample number jth ; セセN@ average MOR ; 1, additive
effect of species;
p,
regression coefficient which expresses the dependency of MOR to MOE ; X;;.measured MOE; X , average MOE, E ;; , error of sample number j1h of species number i1h.
Ho : 1 i.
=
0, there is no significant effect of species or group of species to MORH1 : 1 ;. セ@ 0, at least there is a species provide a significantly different MOR value than others.
The hypothetical test conducted through an F test.
The prediction of strength characteristic of the timber was analyzed through a model as equation (2):
(2)
where: Y ;;, measured MOR of species number i1h and sample number jth ; z ;;. dummy variable of
species number i1
h , a i, constant of dummy variable; f( X ;;) function of the relationship between MOR
and MOE; E ;; . error of of sample number jth of species number i1h. Two hypotheses were used as:
1) Ho: P1
=
P2= p3 .. .. =p k =
0, species and MOE provide no significant effect to MORH1 : 3
p
k セ@ 0, at least one species and/or MOE provide significant effect to MOR2) Ho : species provide no significantly effect on MOR when MOE was included in the analytical model
model.
Strength characteristic based on the allowable stress design (ASD) and load and resistance factor
design (LRFD) were established following the ASTM D 2915 and ASTM D 54579!, respectively.
Result and discussion
Modulus of elasticity and bending strength performance of the timber
The MOE and MOR of timber are the two parameters usually used in the evaluation of the bending
performance of timber in structural size. The MOE and MOR of timber may vary among the species,
trees, logs even among sawn timber of one log10l. The variations of strength and stiffness are caused
by density and imperfection conditions i.e. knots , slope of grain , and interlocked grain as well.
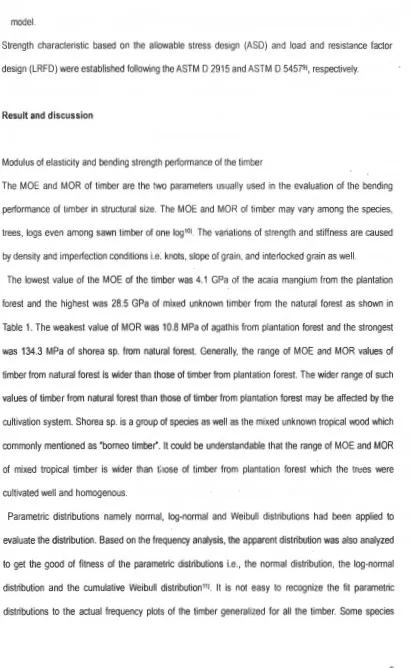
The lowest value of the MOE of the timber was 4.1 GPa of the acaia mangium from the plantation
forest and the highest was 28.5 GPa of mixed unknown timber from the natural forest as shown in
Table 1. The weakest value of MOR was 10.8 MPa of agathis from plantation forest and the strongest
was 134.3 MPa of shorea sp. from natural forest. Generally, the range of MOE and MOR values of
timber from natural forest is wider than those of timber from plantation forest. The wider range of such
values of timber from natural forest than those of timber from plantation forest may be affected by the
cultivation system. Shorea sp. is a group of species as well as the mixed unknown tropical wood which
commonly mentioned as "borneo timber". It could be understandable that the range of MOE and MOR
of mixed tropical timber is wider than tilose of timber from plantation forest which the trees were
cultivated well and homogenous.
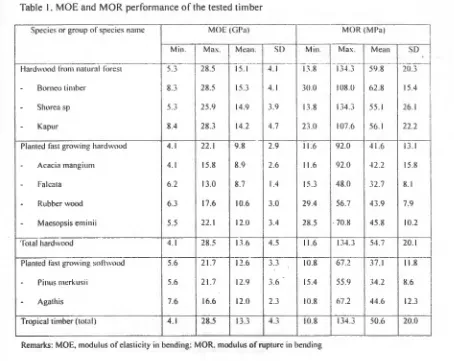
Parametric distributions namely normal, log-normal and Weibull distributions had been applied to
evaluate the distribution. Based on the frequency analysis, the apparent distribution was also analyzed
to get the good of fitness of the parametric distributions i.e., the normal distribution, the log-normal
distribution and the cumulative Weibull distribution11l. It is not easy to recognize the fit parametric
[image:6.612.61.472.46.714.2]have a high goodness of fit to the normal distribution , some to the log-normal and others to Weibull
distribution as shown in Table 2. The parametric distribution and actual frequency of the MOE and
MOR of the tropical timber could be shown in Figs . 1 and 2. Selecting the best fit distribution for the ·
actual frequency values is important especially for the lower tail values in the establishment of
allowable MOE and MOR. In ASTM 0 5457 , the distribution of timber is determined as Weibull
distribution while European standard tends to determine in log-normal distribution12l With reference to
Fig. 1, for the lower tail values, the log-normal and Wei bull distributions provide the better fit than the
normal distribution, but for the other plots the log-normal distribution seems better than Weibull
distribution.
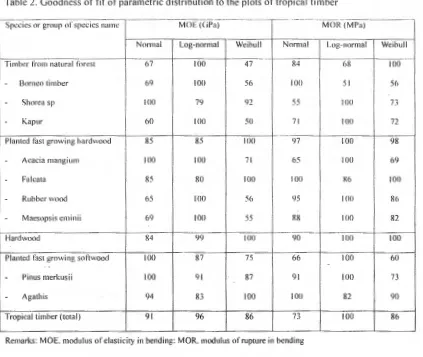
For each species or group of species, the mean and the standard deviation of log-normal distribution,
the shape and scale parameter of Weibull distribution as well as the fifth percentile limit have been
calculated and presented in Table 3. An observation to the lower tail of the distribution is important in
order to reduce error in the establishment of allowable stress . Although from the goodness of fit of the
parametric distributions to the actual frequency of MOE and MOR of the timber could not be specified
as shown in Table 2 and Figs. 1 and 2, the difference of the fifth percentile limit of both of log-normal
and Weibull distributions were relatively small as shown in Table 3. As described above, the fifth
percentile limit of the MOE and MOR of timber from natural forest was also higher than planted timber.
The MOE of planted softwood was higher than planted hardwood, vise versa, the strength of planted
hardwood was higher than that of planted softwood. It might be affected by the difference characteristic
of the timbers. Two distinct condiiions might be affected the MOE and MOR are the presence of
tracheid in softwood and vessels in hardwoods and the different formations of knots in both12l.
The establishment of allowable stress and reference resistance in LRFD of species or group of species
The basic concept of ASD is the working stress in the member of structure should be lower or the
same as the product of allowable stress of the member and corresponding duration of loading9l. The
Indonesia as well as in USA the safety factor of bending strength is 1/2.18•13!. Based on ASTMBl and
European Standards14l, the strength characteristic of the timber is the fifth exclusion limit Hr ッッセI@ of the
population distribution. The strength characteristic of timber is analyzed using parametric and/or
nonparametric proceduresBl.
As mentioned above that the distributions of the timber could not easily been distinguished clearly.
For parametric procedures, the allowable strength of timber species and group of species could be
obtained from Table 3 with the reference to Table 2 for the goodness of fit. There are two statistical
ways for non-parametric procedure i.e. non parametric point estimate (NPE) based on interpolated
date. and non parametric lower tolerance limit (NTL) based on order statistic. The width of the
confidence interval is sufficiently small fraction of the mean with the values in the range of 0.016 to
0.067. In such condition, the allowable value of modcl us of elasticity is the mean of MOE as shown in
Table 1Bl
Through parametric and non parametric procedures with the condition as mentioned above and
considering the safety factor of bending in 10 years loading was 2.18•13, the strength characteristic and
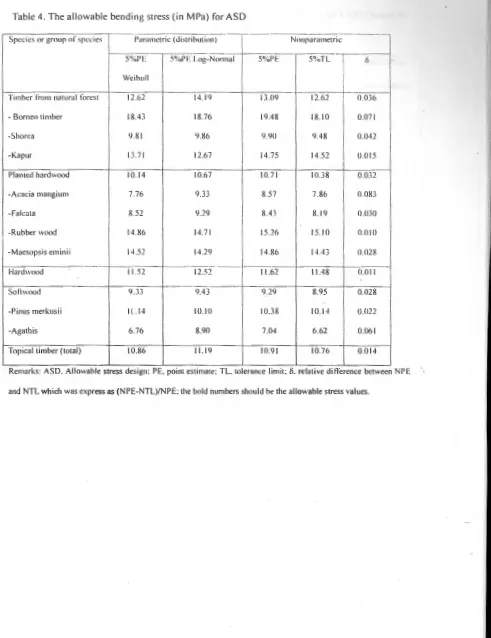
allowable strength is presented in Table 4. With the sufficiently small values of the relative difference
between NPE and NTL, the value of NPE as shown in Table 4 is the allowable stress for bendingsl. The
allowable stress of any species or group species could also be established through parametric
procedures with the small difference value between parametric point estimate (PPE) and NPE or NTL.
The reference resistance for LRi-0 of the timber was calculated based on the format conversion and
reliability normalization factor as mentioned in ASTM D 5457. Format conversion used the ASD load
duration adjustment factor of 1.15, LRFD time effect factor of 0.80 and specified LRFD factor for
bending 0.858!. The calculation based on reliability normalization factor was conducted using an
assumption that the distribution was in Weibull distribution although the goodness of fit of the Weibull
distribution for some species or group of species were lower than 100% as shown in Table 2. In
reliability normalization factor procedure, sample size and coefficient of variations are the decisive
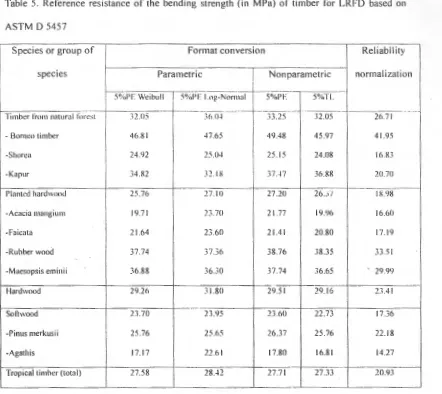
The reference resistance of a species or group of species which was established through format
conversion seemed higher than the one through reliability normalization as shown in Table 5. When the
coefficient of variation of the strength of a species is relatively high , the reference resistance based on
the reliability normalization would extremely lower than the one of format conversion due the reverse
position of the coefficient of variation in reliability normalization equation . Such phenomena indicate
that the application of LRFD based on the reliability normalization factor for tropical timbers need more
studies.
With reference to Tables 1, 4 and 5, the application of allowable stress and reference resistance for
species and/or group of species will be very safe but inefficient use of the timber due to the use of fifth
percentile of the distributions and/or statistical non parametric values as the predicted values.
Application grading with regardless of species conception for the tropical timber
Some difficulties appeared when applying the visual grading to the tropical timber due to the variety of
timber species with their embedded characteristics. Shorea sp. consists of 194 species of which 163
species were found in Melanesia15l. It was also reported that from 400 pieces of mixed tropical timber
namely "Borneo", 23 species were found with a wide range of density and strength of the timbefSl.
Visual grading for predicting the strength through the evaluation of imperfection condition, being
expressed as the "strength ratio" of clear straight grain small specimen of a species, is difficult to apply
to the tropical species in such conditions.
The MOE is by far the best predictor of MOR2l. Some studies on single species reported relatively
high relationship between MOE and MOR of the timber2.3.4•5l. Table 6 shows the relationship between
MOE in flat-wise and strength of the timber of some species and group of species. The coefficient of
detenmination (R 2 ) of the relationship between MOE and MOR of the known single species was in the
range of 0.60 to 0.71 , but it was lower for the mixed species. When all of the specimens were taken
into account, the R 2 value was 0.55 as shown in Fig . 3. The R 2 value of softwood which was
than combining the data of pinus merkusii with falcata of which the mean value of the strength was
similar to those of acacia mangium , rubber wood, and maesopsis eminii from the hardwood . The
R 2 value of the relationship between MOE and MOR of such combination was below 0.30.
Since the R2 value of MOE and MOR of all timber specimens in th is experiment was 0.55, MOE is a
good predictor of MOR but the application of using MOE as a single variable would become the
over/under estimation of MOR , at least for one species as expressed by the high value of F calculated
and a very small significant value. The hypothesis that at least there is a species providing a
significantly different MOR value than others could be accepted. The fact that there is at least one
species providing significantly different MOR endorsed that the identification of the timber species will
improve the prediction of MOR through MOE from 74.2% (R2=0.55) to the range of 77.5%( R2 =0.60)
to 84.3% (R2=0.7 1).
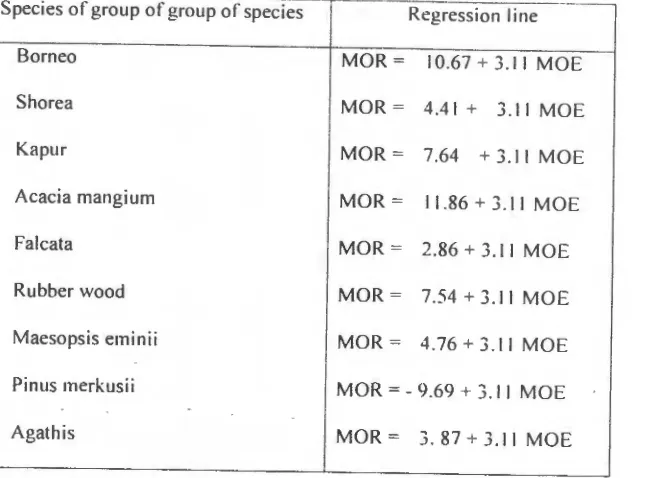
The prediction equation of MOR based on MOE was obtained through the regression dummy analysis
with matrices variables for species and/or group of species . It was found that species and group of
species and/or MOE gave a significant effect on the MOR with the high F calculated value and very
small significant value. The hypothesis that at least one species and/or MOE provide significant effect
on the MOR is accepted. The regression line of the species and group of species is shown in Table 7
and Fig. 4. Using the MOE as the strength predictor with a conception of regardless of species will be
over estimate for softwood especially pinus merkusii as shown in Fig . 4.
Although the timber from natural forest is still dominant in the timber construction industries in some
tropical areas, the promotion of the utilization of planted timber especially fast growing species have
been disseminated since some decades ago. As the selection cutting policy has been applied 1n early
1980s, the availability of some selected species for timber construction has been decreased into less
quantity. In many cases, rough visual grading and small clear specimen test results have been applied
for predicting the strength of the timber. For the unknown species from natural forest, it is classified as
a second class timber although it covers a wide range of strength5l. The utilization of timber from fast
construction. With such background , the application of mechanical timber stress grading to the tropical
planted timber based on MOE with regard and/or regardless of species is very important.
The establishment of timber strength classes
Although the regression line of agathis is close to hardwood as shown in Fig . 4 and Table 7, there is a
tendency for the MOE to predict lower MOR than those of hardwood . With a consideration that pinus
merkusii and agathis would be over estimated, the timber strength classes regardless of species was
established only for hardwood with the regression line and the 5% exclusion limit as shown in Fig . 5.
Exclusion of the values of softwood from the equation as shown in Fig . 3 increased the relationship of
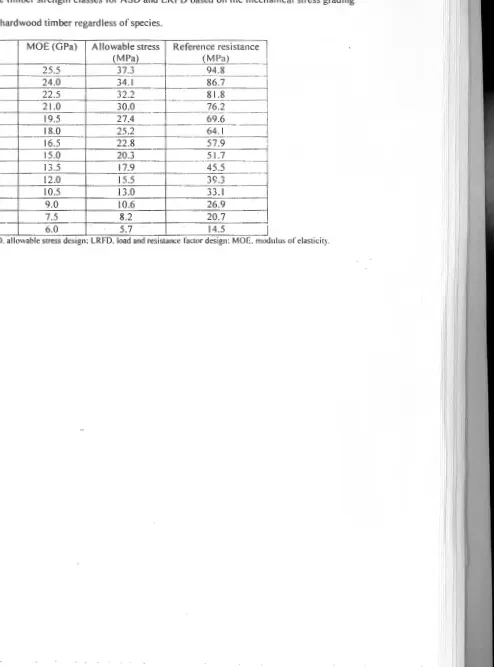
MOE and MOR to 0.64 as shown in Fig . 5. The strength classes of timber were derived based on 5 %
EL (Roos) of ASD and LRFD as shown in Table 8. The reference resistance was estimated through
format conversion with load adjustment factor of 1. 15, a LRFD time factor of 0.80 and ratio of live to
dead load effects of 3, and specified LRFD resistance factor for bending of 0.85.
The proposed strength classes of the timber provides a wider strength classes than common grades
for machine-graded lumber established by American Forest Product Society1l and Japanese standard
for timber structures16l. The upper parts of the proposed strength classes are occupied by the
hardwood
from
natural forest which usually being cut over 35 years while the planted hardwood mostlybetween 10 to 25 years depending on the species and the purpose of the plantation . With reference to
the Tables
4
and 5, the allowable stiffness and strength properties of planted hardwood timber arealmost similar to those of softwood in subtropical area116l.
In practical application, timber identification is uneasy to be done especially for mixed tropical wood
and shorea sp which consists of hundreds species so that the timber strength classes with regardless
of species conception should be applied. When the timber species is not well recognized by the
designers, the timber strength classes for regardless of species as shown in Table 8 should be applied
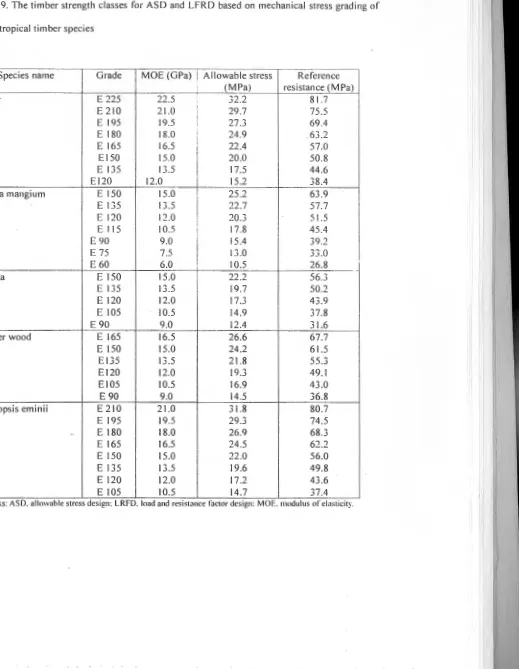
due to its more conservative than the strength classes specific for species as shown in Table 9. With
shorea sp was not provided . In the design , the timber strength classes for regardless of species as
mentioned above and showed in Table 8 should be applied for such group of species
Conclusion
Timber is a building material produced by the nature with the embedded properties from the tree and
during production process . The MOE and MOR of timber were in wide range and the distributions of
the performances were not clearly recognized fit to one parametric distribution i.e. normal, log-normal
or Weibull distribution . The allowable stress for timber produced inefficient of prediction. To utilize
timber for structural material effectively, timber grading could be applied visually and/or mechanically.
With various timber species available and technical difficulties for applying visual grading, the
mechanical grading with MOE as the predictor has been studied with regard and regardless of species.
The ANCOVA statistical analysis showed that using MOE as a single variable for predicting MOR
caused a condition of under/over estimate for one or more species and/or group of species. The
percentage of the accuracy of prediction would be increased with species identification . The analysis
model with regression dummy found that at least one or more species gave a significant effect on MOR.
It was also found that pinus merkusii as tropical softwood produced a significant different MOR in the
same MOE to other timber.
The hardwood timber strength classes had been proposed to support the application of mechanical
timber stress grading. To anticipate the application of LRFD concept in global development, a
reference resistance based on the stress graded timber has also been established through more
Acknowledgem ent
The authors sincere acknowledge the financial support of Research Institute for Human Settleme,nt
-Indonesia. High appreciation is delivered to Ass. Prof. M. Sato of Global Agricultural Sciences,
Graduate School of Agricultural and Life Sciences, The University of Tokyo Japan for invaluable
List of literatures
1. Kretschmann DE , Green OW (1999) Lumber stress grades and design properties Wood handbook:
wood as an engineering materials, chapter 6, pp 6-1 - 6-14 .
2. Johanson CJ (2002) Grading of timber with respect to mechanical properties. Timber engineering,
chapter 3, p 23-43, Wiley.
3.
Steffen A, Johansson CJ , Wormuth EW (1997) Study in the relationship between flat-wise andedge-wise moduli of elasticity of sawn timber as a means to improve mechanical strength grading
technology, Holz als Roh-und Werksoff 55:245-253
4. Firmanti
A.
sオセッォオウオュッ@ S, Komatsu K, Kawai S (2004) The establishment of strength characteristic offast growing acacia mangium timber for structural materials, submitted paper.
5. Firmanti, Anita . 1996. Basic concept of timber grading in Indonesia. Journal Masalah Bangunan. Vol.
346. RIHS. Bandung. Indonesia.
6. Indonesian Standardization Board (1994) Standard quality of timber for building structure, SNI
03-3527-2, Jakarta, in Indonesian.
7. ASTM Standard D 198-1999 (2000) Standard test methods of static tests of lumber in structural sizes,
Vol. 04.10. Wood, Philadelphia
04.1 0. Wood, Philadelphia
9. ASTM Standard 0-5457. 1997; Standard specification for computing reference resistance of wood
based materials and structural connections for load and resistance factor design. Vol. 04 10, Wood,
Philadelphia
10. Gloss P (1993) Strength grading . STEP EUROFORTECH lecture, 6A6:1-8
11 . Horie K (1997) The statistical and probability method of timber strength data, Timber Engineering
Institute Co. Ltd. Sunagawa-Hokaido Japan. In Japanese.
12. Brown HP, Panshin AJ , Forsaith CC (1949) Text book of wood technology, Structure, identification,
defects, and uses of the commercial woods of the United States, Vol. I, p 111 - 285. McGraw-Hill Book
Company, Inc. New York, Toronto, London .
13. Indonesian Standard Board (2002) Code of practice for timber construction, SNI 03-3974, Jakarta,
in Indonesian
14. European Committee for Standardization. 1995. EN 384: Structural timber - determination of
characteristic value of mechanical properties and density. Brussels, Belgium, 13p
15. Soerianegara I, Lemmens RHMJ (1993) Timber trees: major commercial timbers, p 391-434, Pudoc
Scientific Publishers, Wageningen.
16. Japan Institute of Architecture (2002) Standard for structural design of timber structures, p 335-337.
mathematical statistic. John Wiley and Sons Ltd.
Table I. MOE and MOR performance of the tested timber
Species or group of s pecies name MOE (GPa) MOR (MI'a)
I
Min . Ma ., . Mean . SD Min. Max.
mGBGG セ セ@
Hardwood from natural fore s t - 5.3 28 .5 15 . 1 - - - - ·---4 . 1 13 .8 - - - -13-U 59 .8 20.3-
Borneo timber 8 .3 28 .5 15 .3 4 . 1 30 0 I 08 .0 6 2. 8 15.4-
Shorea sp 5.3 25.9 14.9 3.9 13.8 134 .3 55 . 1 26 . 1-
Kapur 8.4 28 .3 14 .2 4.7 23.0 107 .6 56 . 1 22.2Planted fas t growing hardwood 4. 1 22 . 1 9.8 2.9 11.6 92 .0 41.6 13 . 1
-
Acacia mang ium 4.1 15.8 8 .9 2 .6 11 .6 92 .0 -1 2. 2 15 .8-
Falcata 6.2 13 .0 8 .7 1.4 15.3 48.0 32 .7 8 . 1-
Rubber wood 6.3 17.6 10.6 3.0 29.4 56.7 43 .9 7.9- Maesopsis eminii 5.5 22.1 12 .0 3.4 28 .5 . 70.8 45.8 10.2
セ ᄋ@
Total hardwood 4 . 1 28.5 13 .6 4 .5 11.6 134.3 5-1.7 20. 1
Planted fast growing softwood 5.6 21.7 12 .6 -' ·-' ' ' 10.8 67.2 37.1 118
-
Pinus merkusii 5.6 21.7 12.9 3.6 15.4 55 .9 34 .2 8.6-
Agathis 7.6 16.6 12.0 __ _ ) ' l10.8 67.2 44 .6 12.3
Tropical timber (total) 4.1 28.5 13.3 4.3 10.8 134.3 50.6 20.0
[image:17.612.34.488.59.420.2]Table 2. Goodness of fit or parametric distribution to the plots or tropical timber
Species or g.rnup of sp::cies name --·--- - - - ---- - - -- - - - --·· MOE ((iPa) MOR (MI'a)
Normal Log-normal Weibull Norma l Log-normal Wei bull
Timber from natural ti)l'est 67 100 47 84 68 100
- Borneo timber 69 100 56 100 51 56
- Shorea sp 100 79 92 55 100 73
-
Kapur 60 100 50 7 1 100 72Planted fast growing hardwood 85 85 100 ')7 100 98
- Acacia mangium 100 100 71 65 100 69
- Falcata 85 80 100 100 X6 100
- Rubber wood 65 100 56 95 100 86
-
Maesopsis eminii 69 100 55 88 100 82Hardwood 84 99 100 90 100 100
Planted fast growing softwood 100 87 75 66 100 60
--
Pinus merkusi i 100 91 87 91 100 73- Agathis 94 83 100 100 82 90
Tropical timber (total) 91 96 86 73 100 86
[image:18.612.53.476.68.425.2]Table 3. The parameters of parametric distribution and their ti fth percentile limit
Species or group of Modulus of elasticity (GPa) Modulus of rupture (MPa)
spec ies name Log-normal dist. Weibull Ji st. Log-normal dist. Weibull disL
:---·- ---- ---
--,
--M[[M ᄋO rZ セM
I .
I
セ@
R ntlli q !l R.,,, I . :; R .. ,, qTimber from na· 2.68
!
0.26 9. 1 1(1.5 -1 .5 9.3 Ni⦅HIセ@ 0.33 29.1! 66 .6 3.4 26.5tural forest
I
I-Borneo timber 2.69 0.26 9.4 16.8 4.6 9.6 4. 11 0.24 39.4 68 .5 4.9 38.7
-Shorca sp 2.67 0.26 R.X 16.3 4.4 8.5 3.91 0.45 20.7 62.2 2.5 20.6
-Kap ur sp 2.60 0.32 7.8 15.7 3.8 8.5 3.95 !Ull 26.6 62 .7 3.0 28.8
Planted fas t 2.24 0 .30 5.7 10.8 4. 1 5.3 3.68 0 .3 1 22 .4 46.2 3.6 21.3
growin g hardwood
-Acacia mang ium 2.15 0 .28 5.1 9.8 4.2 4.9 3.68 0 .36 19.6 47 .2 3. 1 16.3
-Falcata 2. 16 0.16 6.5 9.4 6.1! 6.6 3.46 0.24 19.5 36 .0 4.2 17 .9
-Rubber wood 2.32 0.27 6.2 11.6 4.3 6.0 3.77 O.IR 30.9 47. 1 6.4 31.2
--M aesopsis eminii 2.45 0.37 7.2 13 .2 4.4 7.7 3.80 0 .22 30.0 49.5 5.3 30.5
Hardwood 2.56 0 11 7.2 15 . 1 3.6 7.0 3.9-l 0.36 26.3 61.1 3.2 24.2
Planted fl1s t 2.51 0 .25 7.8 13 .8 4.7 7.6 3.56 0 .3 1 19.8 41.1 3.7 1---19.6
gmwin g so ftwood
-Pinus merkusii 2.52 0.27 7.6 14.2 4.3 7.3 3.50 0 .25 21.2 37.4 4.7 21.3
-Agathis 2.47 0. 19 8.4 12.9 6.2 8.4 3.74 0.33 18 .7 50.1 2.7 14.2
Tropical timber 2.54 0.32 7.2 14.7 3.8 7. 1 3.85 0.38 23 .5 56.6 3. 1 22.8
(total)
Remark : MOE, modulus of elasticity; MOR, modulus of rupturP.; セN@ mean of normal distribution; cr, standard deviation; 1., mean of
[image:19.612.61.497.74.718.2]Table 4. The allowable bendin g stress (in MPa) for ASD
MMMMセMMᄋMMᄋ@
Mセ@
Srccics or grou r of speci es Parametric (Ji strihution) No11parametri c
----s'X.1' l- 5'X.PE ャNッァ セ nッ ョ ュ[ャ MMᄋ@ 5%PE - · 5%TL
l - 6
,
Wei hull
I
I
Timber from natural forest 12.62 14. 19 13.09 12 .62 ().036
- Borneo timber 18.4 3 18.76 19.48 18. 10 O.o71
-Shorea 9.81 9.86 9.90 9.48 0.042
-K apur 13.7 1 12.6 7 14.75 14.52 ().() 15
Pl anted hardwood 10 .14 10.67 10 .7 1 10.38 0.032
-Acac ia mangium 7.76 9.33 8.57 7.86 0.083
-Fa leota 8 .52 9.29 8.43 8. 19 0 .030
-Rubber wood 14 .86 14 .7 1 15.26 15 . 10 0.010
-M aesops is eminii 14 .52 14.29 14.R6 1-1 43 0.028
M M LQ N U セ@ ·
-Hard\\'ood 12.51 11 .62 11.4 8 0.011
-
-So ft\\'ood 9.33 9.43 9 .29 8.95 0.028
-Pinus merkus ii I( . 14 10. 10 10.38 10. 14 0.022
-A gathi s 6.76 8.90 7.04 6.62 0.061
Topica l timber (total) 10.86 11 . 19 10 .9 1 10.76 0.014
Remarks : ASD. Allowable stress des1gn: PE. pomt est1mate: TL. tolerance lumt : 6. relatJve dlflerence between NPE
[image:20.612.44.535.51.689.2]Table 5. Reference resistance of the bending strength (in MPa) of timber for LRFD based on ASTM D 5457
Species or group of Format conversion Rei iabil ity species Parametric
I
Nonparametric normali zation5%PE
w・[ッNLセ@
M セGᄋiGeセ
N\^ ァ ᄋ@
'""'"" -f--5%PE-=-
UEt l セ@
-·---Timber !"rom natural f(lr-est 32.05 36 0-l 33 .2 5 32.05 26.7 1
- Borneo timber 46.81 -17 .65 49.48 45.97 41 .95
-Shore a 24 .92 25.0-l 25 .15 24.08 16.!U
-Kapur 3t1 .82 32. 1 X 37 .-17 36.88 20 .70
---Planted hardwood 25 .76 27. 10 27.20 26.J I I X.98
-Acacia rnangiu m 19.7 1 23 .70 21 .7 7 19.96 16.60
-Faicata 21.64 23.60 21.41 20.80 17. 19
-Rubber wood 37.74 37.36 38.76 38.35 33 .51
-Maesops is eminii 36.88 36.30 37.74 36.65
-
29.9')Hardwood 29.26 31 .80 29 .51 29 . 16 23.41
-Soli wood 23.70 23.95 23.60 21.73 17.36
-Pinus merkusii 25.76 25.65 26 .37 25.76 22.18
-Agathis 17. 17 22 .61 17.80 16.81 14 .27
-Tropical timber (total) 27 .58 2&.-12 27.71 27.33 20.93
[image:21.612.49.491.67.461.2]-Table 6. The coefficient of determination of the re lationship between MOE and MOR
·
-Species or group of species Number of Coefficient of
name sa mples determination (R1 )
--- ! - - -
---·-·---Timber from natural fore st 566 0.56
- Borneo timber 314 0.53
- Shorea 192 0.64
-
Kapur 60 0.711-:::-:----·
Planted hardwood 300 0.57
- Acacia mangium 120
0.71
-
Falcata 60 0.63- Rubber wood 60
0.61
- Maesopsis eminii 60
0.64
-Planted softwood 228 0.3 6
- Pinus merkusii 168
0.60
- Agathis 60
0.68
Table 7. The equation of predicted MOR based on MO E of the timber species
--Species of group of group of species Regress ion I i ne
-
Borneo MOR = 10.67 + 3.11 MOE-
Shorea MOR = 4.41 + 3 . 11 MOE- Kapur MOR = 7.64 + 3. 11 MOE
-
Acacia mangium MOR = 11.86 + 3.11 MOE-
Falcata MOR = 2.86 + 3.11 MOE- Rubber wood MOR = 7.54 + 3. 11 MOE
- Maesopsis eminii MOR = 4 .76 + 3 . 11 MOE
-
Pinus merkusii MOR = - 9 .69 + 3 . 11 MOE- Agathis MOR = 3. 87 + 3.11 MOE
[image:23.612.5.329.90.329.2]Table 8. The timber strength classes for ASD and LRFD based on the mechanical stress grading for tropical hardwood timber regardless of species.
Grade MOE (GPa) Allowable stress Reference resistance
(MPa) (MPa)
··-
-E 255 25.5 37.3 - - - -94.8
E 240 24 .0 34.1 86.7
E 225 22.5 セNNL@ ..,
jセ N M 81.8
·
-E 210 21.0 30.0 76 .2
セ M MMM - - - -19.-5- -- - -- - -- -! - - ---- ·
-E 195 27.4
_ 6?..i_ 1
E 180 18.0 25.2 64.1
E 165 16.5 22.8 57.9
---l
E 150 15.0 20.3 51.7
-E 135 13 .5 17.9 45.5
E 120 12.0 15.5 SセNS@
E 105 10.5 13.0 33.1
E 90 9.0 10.6 26.9
E 75 7.5 8.2 20.7
E60 6.0 5.7 14.5
[image:24.612.30.524.73.740.2]Table 9. The timber strength classes for ASD and LFRD based on mechanical stress grading of
some tropical timber species
Species name Grade MOE (GPa)
I
Allowable stress ReferenceI (MPa) resistance (MPa)
Kapur E 225 22.5 32.2 81.7
E 210 21.0 29.7 75.5
E 195 19.5 27.3 69.4
E 180 18 .0 I I 24 .9 63.2
E 165 16.5 I 22.4 57.0
El50 15.0 20.0 50.8
E 135 13 .5 17 .5 44 .6
El20 12 .0 15.2 38.4
Acacia mangium E 150 15 .0 25 .2 63.9
E 135 13 .5 22.7 57.7
E 120 12 .0 20 .3 51.5
E 115 10 .5 I I 17.8 45.4
E 90 9 .0
I
15.4 39 .2
E 75 7.5 13 .0 33.0
E 60 6.0 I 0 .5 26.8
Falcata E 150 15.0 22.2 56.3
E 135 13 .5 19 .7 50.2
E 120 12 .0 17.3 43.9
E 105 10.5
I
14 .9 37 .8E 90 9 .0 12.4 31.6
Rubber wood E 165 16.5 26.6 67.7
E 150 15.0 24.2 61.5
E135 13.5 21.8 55.3
El20 12.0 19.3 49.1
E105 10.5 16.9 43.0
E 90 9.0 14.5 36.8
Maesopsis eminii E 210 21.0 31.8 80 .7
E 195 19.5 29.3 74.5
.
E 180 18.0 26.9 68 .3E 165 16.5 24.5 62 .2
E 150 15.0 22 .0 56.0
E 135 13.5 19 .6 49.8
E 120 12.0 17.2 43 .6
E 105 10.5 14.7 37.4
-
.. [image:25.612.6.525.77.746.2]IC.U
14(1
--ittgress inn line 0
"'
120Q.,
セ@ Y = 3.52 X + 6 66. R' = 0.64 0
1:: IOU ::0
c.
E RU
.... 0
セ@
-=
(,(I::::
"'0
0 セ@ 4(1
20
0
0 Ill IS 2(1 25 JU
160
140
"
120
"-セ@
t 100 :::1
c..
e
1!0... 0
"' 60
:::1
:;
"'0
0
セ@ 40
20
0 0
- - Borneo - - - - Shnrea
- - - K apur
--6----/\Ci.H,."ti.l lllc.l ll!:!ll llll
--8- Fablla
セrオ「・ イ キッッ、@
セ@ m。・ウッー ウエセ@ cminii
-· * · ·
Pnltl' mcrkLt"iᄋ セ ᄋᄋ@ Agathis
10 IS 2(1
Modulus of claslicily (CPa)
.· ..
((,()
140
"' Q.. 120
"'-1:: 11)0
"
c.
E 1!0
... 0
セ N@
(,0
::: :;
""'
040
::<:
20
0
0
• nセエオイセ ャ@hardwood
• p「ョエ セ 、@ hardwood o Sol!wood
Y = 3.48X + 447. R1 = 0 .55
10 iセ@ 20
'\'lndulus ッヲイャ。ウャゥ」ゥエセ ᄋ@(C;Pa)
11.8 u 5 " g- 0.6 .!: " ;. ·; :; OA §
n.z
0
0 20 40 60 80 IIIII
0 Normdi s t ッヲエイッーゥイ[セャ@ セセ@ Maイエオ Zセ ャヲイ エB アNッヲエイッエャゥ オ ャセヲ@ 6Nonn<hl ofhardo.\.oodfrom
ュオオイセ@ fons t
X Ac tual f,-rq. of ィ。イセ@
fr om natural forrst
0 Nonnc:liu of pl an trd
ィ 。 ᄋ セ@
+ Actulll frrq. of tllllnttd hanh\.uotl 0 Nonmi 't of s oft"ood
X aイエオZセャ@ frt"q. of soft"'6Qd
120 QセP@ llJII M oduht'li of ューエオセ@ {M Pa)
Normal distribution and actual frequency of tested timber
U.H
u
=
u
& 0.6
'"
'""
"セ@
E UAc
0.2
0
0 20 40
0 セMエッョョゥウエ@ of"trOftiral
...
- ActuJd frrq. of tr0f1ical ""'Qd
l:J. Log-nonnth t o( h•rdrwood
from natunll forts I X ArtuHJ frrq. olhartMooct
ft·om muural forrst 0 Log-nornwht o( セ。イャャイ、@
ィセエイ」mッッ、@
+Actual frt(f. ol Pautrd
ィ。イセ@
0 log-normtfst ol sotl.-oOO X Atlual frrq. ol sol1"000
60 80 IOU 12(1 QセP@ 160
M oduhL< of n1ptur< (M Pa)
Log-normal distribution and actual frequency of tested timber
0.8 u f
"
g- 0.6 .!:..
Mセ@.; 0.4 E
"
u
0.2
0
0 20 40 60 80
-Actual frrq. of trotliral ""lUlU
A Wt-ihullc.i s t of harc:Moorl from n atural fon•sf
X Actual frt'q. ッヲィ。イセエ@ from muund forrst
0 Wrihullti s t of Pantt'd harct..ood
+ a」エオセエャ@ rrrq. or planltd harchtood
o Wrihulldisl or solhwod
X Aclual rrrq. or ウッHセ@
100 120 140 160
Modulus of rupture (MPa)
0.8
" " " :s セ@ !1.6 .;: " .z; UA :s E :s v 0.2 ()
u 10 15
•
0 セッョュィ@ 1 of lt"Otlinl wood
- Aclmtl ft·rq.. uf h 'Oflic;.d
セッッ、@
6 'unntli s I of h;.tl'ih,ood
n:lluntl fun• s f
X Artu:tl fr ·rq.. of h:1nMuud
ヲョキョョ Z オオイセ@ fot·r ,; t
0 Nonmh I nf tllanlrd hantm)()d
+Arcual fn·q. of エャャエエセエヲイ、@
h:u·th\tHltl
0 ' 'onudi s t of s nff\\ood
211 2S
セi@ ndulu' uf elasticity (GPa)
30
Normal distribution and actual frequency of tested timber
0.8 " セ@ :s セ@ 0.6 .;: " .:: セ@
:; OA E
:s
u
0.2
0
0 10 IS
•
- Artmtl fn•q. oflr·ostical M-00:1
fl l..og-IIOI' IItdi $ 1 ofhanMood ft ·om ョ。エオ ᄋ セ@ fon·st X Arlmd fr·rq. nfhanMood
ft·mnnatuntl fm·rsl 0 Log-nonndi s t of rJiantrd
ィセョィM|ッッ、@
+ ArluaJ fn•q. oftllanlrd h.-r·th,ood
0 l.og -non•xhl ofsofrwood
xa」ャオセ@ fn·q. ofsort .. lWMI
20 2S 30
Modulus of elasticity (GPa)
Log-normal distribution and actual frequency of tested timber
0.8 i
c
"
":s
0" 0.6
"
.;:
"
.<:!i OA
:s E :s I,; 0.2 0
0 Ill IS 20
•
-Actual frrq. of t•·o,Jiul
. wood
6 WriWIIdisr of hardwood
fr-om natural fo1-rst X Aclual frrq. of hardwood
ft·om naf\lr·al fot-rsl
0 \\'t'ibulldisl o( ... antrd
hart.Mood +Actual fn·q. of pomttd
ィッエョセッッ、@
0 \\ 'tib.lllli s t of!(o(h\ood
X Actual fr·rq. of sortl\OOtl
2S
Modulus ofelaslirily (CPa)
30