PREDICTION and MEASUREMENT of WELD DILUTION in ROBOTIC CO2 ARC WELDING
1
S.Thiru, 1Chew Lai Huat, 2S.Hemavathi, 1Phang Boo Onn, and 1Febrian bin Idral
1
Faculty of Mechanical Engineering, Universiti Teknikal Malaysia Melaka (UTeM), Hang Tuah Jaya, 76100, Durian Tunggal, Melaka, Malaysia
2
School of Civil Engineering, Linton University College, 71700, Mantin, Negeri Sembilan, Malaysia
Abstract: Weld dilution is an important feature of weld bead geometry that determines the mechanical and chemical properties of a welded joint. For robotic CO2 arc welding, several
welding process parameters are reported to be controlling the dilution. This paper investigates the relationship between four of these process parameters and dilution by depositing ‘bead on plate’ robotic CO2 arc welds over mild steel plates. Two level four factor full factorial design
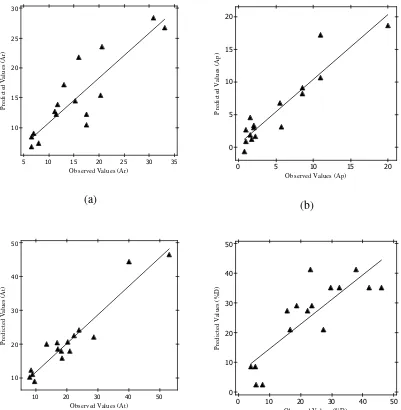
method was used for conducting the experimental runs and linear regression models were developed accordingly. The adequacy of the models were tested by applying students ‘t’ test and the predicted values from the models were plotted against the observed values through scatter diagram.The results showed that not only the proposed two level full factorial empirical models could predict the weld dilution with reasonable accuracy and ensure uniform weld quality, but also found to be a very simple and effective tool for quantifying the main and interaction effects of welding parameters on dilution.
Key words: Robotic CO2 Arc Welding, Process Control Parameters, Weld Dilution,
Mathematical Modeling.
INTRODUCTION
Weld surfacing is a metal deposition process in the form of a single or multiple layers over a basemetal, generally named as substrate. Based on the function, there are several classifications in surfacing process, namely a) hardfacing - the deposition to produce high wear resistance surfaces over a ductile base metal; b) cladding - to produce high corrosion resistant surfaces through deposition; c) buttering - a process of making chemically or metallurgically compatible surfaces; and d) the metal deposition to reconstruct and reuse the worn out parts [1].
_____________________________________________________________________________
Surfacing by fusion welding process has been increasingly becoming popular as it substantially saves some of the most imperative costs that involve men, machines, materials and manufacturing and has been evolved rapidly in recent years for a wide range of industrial applications. These applications include from relatively smaller food processing plants to much bigger petrochemical,cement,fertilizer and nuclear power plants [2]. Although most of the conventional welding processes viz., shielded metal arc welding (SMAW), submerged arc welding (SAW), gas tungsten arc welding (GTAW), plasma arc welding (PAW), flux cored arc welding (FCAW), electroslag welding (ESW), oxy-acetylene welding (OAW) and explosive welding are extensively employed by the industry [3], however gas metal arc welding (GMAW) is one of the most recognised and widely used process for all types of weld surfacing mainly due to its high productivity and ease of automization.
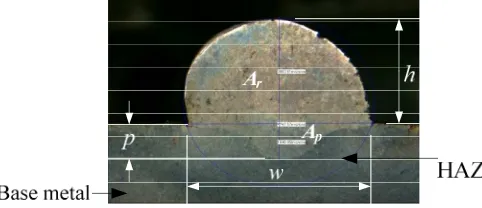
In general, the automized/robotic arc welding process has several means to sense and regulate the various, interdependant process control variables so as to ensure the process - product quality, productivity and the ensueing profitablity. The relationship between these process control variables and the resulting weld shape and weld bead geometry are inherently complex due to the number of variables involved and their inter-relationship on each other. The weld bead geometry (Figure 1), consists of several important features which include the weld width (w), weld penetration (p), weld reinforcement or weld height (h) etc., determines the quality of the weldment as well as the overall stress carrying capacity of the entire weld joint. Among many of these features of weld bead geometry, one of the most important is the weld dilution.
Fig. 1: Weld bead geometry related to dilution
The dilution percentage, by definition is the ratio between the area of reinforcement (Ar) to the total area of weldment (At). It is the single most important factor between a conventional welding of a joint and a weld surfacing, although surfacing is fundamentally a welding process. The weld bead geometry which determines the dilution, plays an important role in determining the mechanical properties of the weld [4–7]. To obtain the desired dilution, it is necessary to have a complete control over the related process control parameters so as to ascertain the relevant bead shape and geometry which would eventually determine the capacity of the weldment. Controlling of dilution is one of the major requirments for a successful weld surfacing process as the composition and properties of weld deposit have a very strong relationship with the dilution that prevails after welding. For cladding however, a low dilution is highly desirable as the final deposit composition needs to be closer to the corrosion resistant filler metal. There have been several attempts made by the researchers [8,9], to investigate dilution in several fusion welding processes however, there are very little work done with robotic CO2 process. The
process control parameters and dilution of bead on plate weldments made by using robotic CO2
arc welding process.
MATERIALS AND METHODS
Mathematical models, derived from the empirical data which are collected from statistically designed experiments [10-12], are generally intended by researchers to reduce the cost of the otherwise expensive yet exhausting “trial and error” methods. One of such models, based on the “factorial technique” is known for simplicity and reasonable accuracy in predicting the relationship (generally linear), trend (direct or inverse) and magnitude of the main and interaction effects of control parameters involved over the response factors in question. There have been several other empirical data based statistical methods which are successfully used in order to understand the relationship between the process control parameters and the weld bead geometry [3-5].
For robotic CO2 arc welding however, it is reported that the linear model obtained from
the factorial technique is more effectively predicted the bead geometry than the curvilinear models which are otherwise increasingly becoming popular for several other fusion welding processes [5]. For the present study, a two level four-factor full factorial design of experiments technique is, therefore, employed with three replicated experimental runs to develop linear mathematical models. Four individually controllable process control parameters such as welding current (I), rated voltage (V), arc travel rate (A) and electrode angle (W) are considered for dilution as the response parameter. All the direct and indirect parameters except the ones under consideration are kept constant. The upper limit (highest level) and the lower limit (lowest level) of a factor are coded as (+1) and (-1) or simply (+) and (-) respectively according to the equation (1).
-jn jo
j
j
X X
X
J
= (1)
Table 1: Welding process control parameters and their limits
Sl.No Control Parameter Unit Notation Limits
Actual Code Actual Code
Low Low High High
1 Welding current A I 180 -1 260 +1
2 Rated voltage V V 18 -1 26 +1
3 Arc travel rate cm/min A 24 -1 46 +1
4 Welding angle degree W 90 -1 145 +1
Table 2: Chemical composition of the welding wire
C Mn Si Pmax Smax Cumax
0.08% 1.2% 0.7% 0.008% 0.007% 0.1%
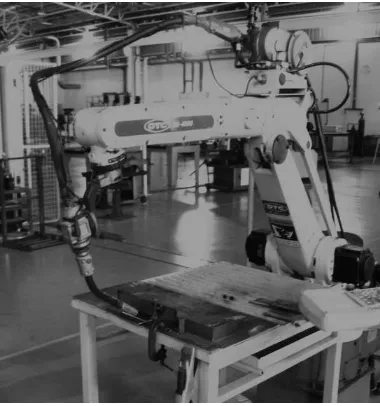
The robotic CO2 arc welding facility, OTC Daihen DR-4000, with a working range of
0-500A and 0-50V at the Faculty of Manufacturing engineering laboratory in Universiti Teknikal Malaysia Melaka (UTeM) was used for conducting the experiments as well as data collection. The shielding gas composition was kept at Ar 80% and CO2 20% for experimentation. A fixture
was made to locate and fix the specimens on the machine table. The robot was turned on and with the shielding gas mixture turned on simultaneously, weld beads were made using bead on plate technique. Weld beads were deposited for a total length of 135 mm, as per the welding conditions prescribed by the design matrix. The welding robot and the experimental set up are shown in Figure 2.
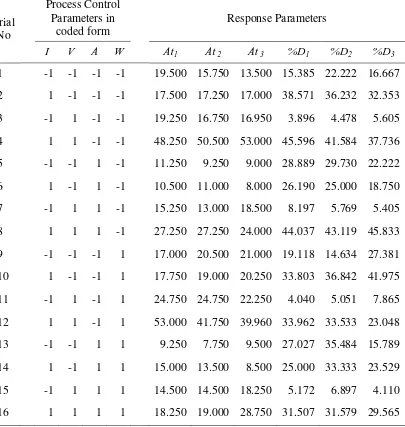
Since the full factorial technique prescribes 2n (n, number of control parameters) as the number of experimental runs and hence 24, 16 experimental runs are required for completing one set of DOE [12]. With three replications, there were totally 48 runs (3×16) required to fit each equation. Two sets of data were used to obtain the variance of optimization parameter and the third set was used to determine the variance of the adequacy of the model. To eliminate any systematic errors during the experiments, the experimental runs were randomized as per the table of random numbers. The detailed design matrix with observed response parameters for the three sets of experimental runs are given in Table 3.
Table 3: Design matrix and responses
Trial No
Process Control Parameters in
coded form
Response Parameters
I V A W At1 At 2 At 3 %D1 %D2 %D3
1 -1 -1 -1 -1 19.500 15.750 13.500 15.385 22.222 16.667
2 1 -1 -1 -1 17.500 17.250 17.000 38.571 36.232 32.353
3 -1 1 -1 -1 19.250 16.750 16.950 3.896 4.478 5.605
4 1 1 -1 -1 48.250 50.500 53.000 45.596 41.584 37.736
5 -1 -1 1 -1 11.250 9.250 9.000 28.889 29.730 22.222
6 1 -1 1 -1 10.500 11.000 8.000 26.190 25.000 18.750
7 -1 1 1 -1 15.250 13.000 18.500 8.197 5.769 5.405
8 1 1 1 -1 27.250 27.250 24.000 44.037 43.119 45.833
9 -1 -1 -1 1 17.000 20.500 21.000 19.118 14.634 27.381
10 1 -1 -1 1 17.750 19.000 20.250 33.803 36.842 41.975
11 -1 1 -1 1 24.750 24.750 22.250 4.040 5.051 7.865
12 1 1 -1 1 53.000 41.750 39.960 33.962 33.533 23.048
13 -1 -1 1 1 9.250 7.750 9.500 27.027 35.484 15.789
14 1 -1 1 1 15.000 13.500 8.500 25.000 33.333 23.529
15 -1 1 1 1 14.500 14.500 18.250 5.172 6.897 4.110
The welded plates were checked for any visible defects and uniformity and then cross-sectioned at their axial midpoints to make test specimens. These 15 mm wide test specimens were metallurgically polished and etched with 5% nital solution. A reflective type profile projector was employed to trace the weldbead profiles of the test specimens and the bead geometry which includes penetration, reinforcement, width, area of penetration and the area of reinforcement was measured using a digital planimeter. The weld bead parameters that are related to dilution viz., area of reinforcement (Ar) and area of penetration (Ap) shown in Figure 1 were measured and the percent dilution (%D) was calculated by applying the formula as follows:
100 ) /(
%D= Ar Ar+Ap × (2)
The objective of this research was to predict the percentage dilution as a function of direct welding parameters such as arc current, rated voltage, arc travel rate and welding angle and can be written mathematically as
) , , , (
%D= f I V AW (3)
The linear equation can be written in the form of a polynomial by taking into account all the possible two factor interaction:
AW VW VA IW IA IV W A V I
D 0 1 2 3 4 12 13 14 23 24 34
% =β +β +β +β +β +β +β +β +β +β +β (4)
Where %D is the measured dilution percentage, β0,β1,β2,β3 and β4are the linear coefficients to be estimated which depend on the four process control parameters I,V,A and W. A standard statistical software package (Minitab 16) was used for the statistical analysis. Employing the least square method based regression analysis, the measured values from the experiments - the area of reinforcement (Ar), area of penetration (Ap) and area of weldment (At) were analysed with dilution as response. A significance level of 5% on Fisher’s F-ratio that represents the main and interactive effects of the individual control parameters shown to be important, the following equations were to be estimated:
844 . 0 484 . 1 375 . 1 172 . 4 437 . 4 094 . 1 937 .
14 I V A IV VA AW
Ar = + + − + − − (5)
VW VA IA IV A V I
Ap =5.679+3.711 +1.695 −1.664 +2.726 −1.57 −0.805 −0.758 (6)
VA IA IV A V I
At =20.617+4.805 +6.133 −5.836 +4.102 −1.867 −2.289 ` (7)
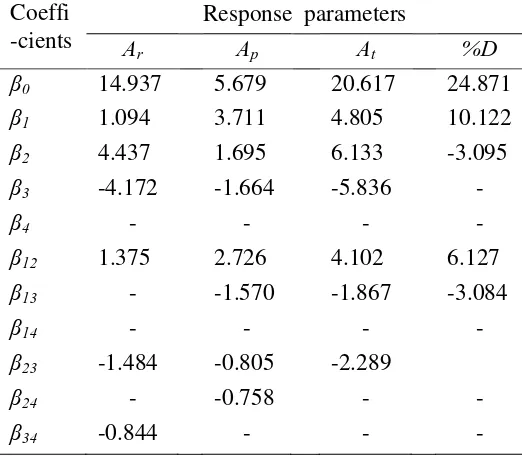
Table 4: Estimated values of the significant coefficients of the models
Coeffi -cients
Response parameters
Ar Ap At %D
β0 14.937 5.679 20.617 24.871
β1 1.094 3.711 4.805 10.122
β2 4.437 1.695 6.133 -3.095
β3 -4.172 -1.664 -5.836 -
β4 - - - -
β12 1.375 2.726 4.102 6.127
β13 - -1.570 -1.867 -3.084
β14 - - - -
β23 -1.484 -0.805 -2.289
β24 - -0.758 - -
β34 -0.844 - - -
The standard error of estimates (SE), coefficients of multiple correlations (R) and coefficients of determination (R2) made from the regression analysis are given in Table 5.
Table 5: Analysis of variance (ANOVA) tests for mathematical models for dilution
Number of equation
Standard error of estimate
Coefficient of multiple
correlation
Coefficient of determination (%)
5 0.336 0.981 96.37
6 0.299 0.971 94.33
7 0.791 0.950 90.26
8 0.750 0.966 93.36
35 30 25 20 15 10 5 30 25 20 15 10
Observed Values (Ar)
P re d ic te d V a lu es ( A r)
Scatterplot of Ar- vs Ar3
(a) 20 15 10 5 0 20 15 10 5 0
Observed Values (Ap)
P re d ic te d V al u es ( A p )
Scatterplot of Ap- vs Ap3
(b) 50 40 30 20 10 50 40 30 20 10
Observed Values (At)
P re d ic te d V al u e s (A t)
Scatterplot of At- vs At3
(c) 50 40 30 20 10 0 50 40 30 20 10 0
Observed Values (%D)
P re d ic te d V al u es ( % D )
Scatterplot of %D- vs %D3
Fig. 3: Scatter diagram for a) Area of reinforcement (Ar); b) Area of penetration(Ap); c) Area of weldment (At) and d) Percentage dilution (%D)
The results clearly demonstrate that the empirical data based linear mathematical models developed for the robotic CO2 arc welding process could be able to have predicted a
RESULTS AND DISCUSSION
The empirical data based mathematical models developed from the study can be used to predict the dilution control parameters by substituting the coded values of the respective process control parameters in the equations. The three response variables viz., Ar, Apand At which were calculated from those models for each set of welding parameters I,V,A and W individually in their coded form are represented in equation 4 and 7 respectively. Subsequently, it is possible to obtain the required values of each of the process control parameters by simply substituting the values of the desired dilution in the model. However, the factorial models of these three response variables and the influence of their respective process control parameters are beyond the scope of this paper and hence are not discussed. For the current discussion, Ar, Apand At are merely used to calculate dilution percentage (%D) as per equation (1) and to recheck the validity and conformity of the developed regression models. Under prescribed welding conditions, the proposed empirical model for the prediction of %D after neglecting the statistically insignificant coefficients in the coded form is given by:
IA V
I V
I
D 24.871 10.122 3.095 6.217 3.084
% = + − + − (8)
This empirical model could provide more useful information and possible guidelines for the robotic CO2 arc welding system with a reasonable accuracy by analysing both the main and
combined interaction effects of each of the individual process control variables on dilution. For a 2k factorial based experiment, the effect of a controlling factor over a given response (Y) can be represented as:
−
+ −
= A A
A Y Y
E (9)
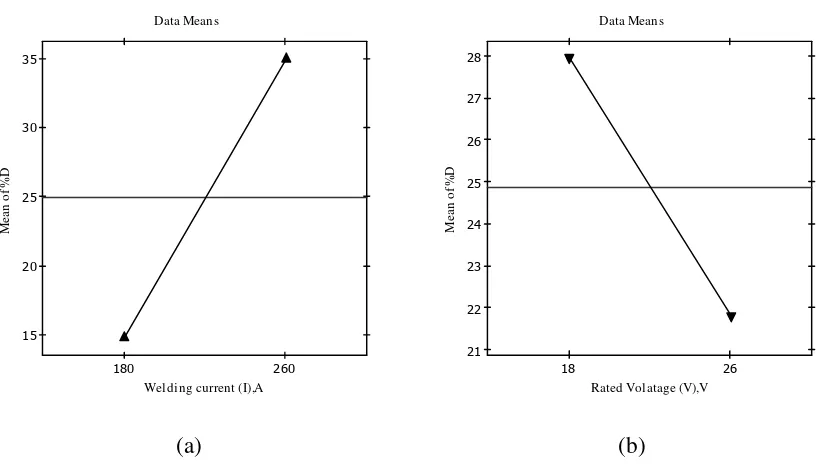
Where EAis the effect of A, andYA+, YA− are the response data means obtained from experiments when effect A was kept at its lower and higher limit values respectively [12]. Based on this principle, it is evident from the model [equation (8)], that among the four process control parameters (I, V, A and W) considered, only welding current (I), and rated voltage (V) had direct effects on %D while the other two control parameters, the arc travel rate (A) and the welding angle (W) were found to be statistically insignificant direct effects on the response. The model also indicated that the welding current had a direct relationship, while the rated voltage had an inverse relationship, each of them individually with the response, %D.
260 180
35
30
25
20
15
Welding current (I),A
M
ea
n
o
f
%
D
Data Means
(a)
26 18
28
27
26
25
24
23
22
21
Rated Volatage (V),V
M
ea
n
o
f %
D
Data Means
(b)
Fig. 4: Direct effects of process control parameters on dilution%D
From Figure 4(a) an increase in welding current (from 180A to 260A) increases the dilution whereas the increase in voltage (from 18V to 26V) reduces it [Figure 4(b)]. It is well known that the heat input from the welding arc is controlled by welding current which means an increase in welding current increases the heat input and hence the melting rate, thereby increasing the dilution. On the other hand, an increase in voltage spreads the arc further and reduces the heat intensity by affecting the heat flux over the surface area under the arc. In general, both results are in total agreement with most of the published results based on several types of arc welding processes [5,8]. The results also proved that the factorial technique is a simple yet very efficient and useful tool for understanding and evaluating the individual process parameters on dilution for robotic CO2 arc welding. Figure 5 and 8 show the interaction effects
of the process parameters with respect to the dilution.
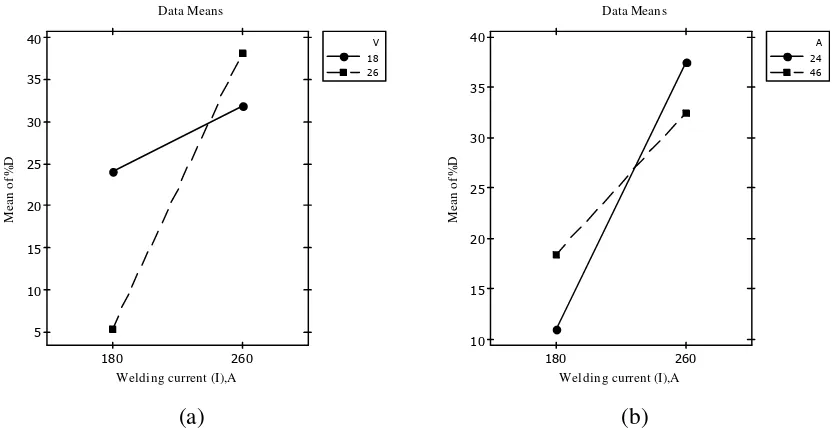
A closer look at the interaction effects plotted in Figure 5 reveals that when the welding current interacts with rated voltage [Figure 5(a)], as well as the arc travel rate [Figure 5(b)], has a direct relationship with dilution. It is interesting to note that in robotic CO2 arc welding the rated
260 180 40 35 30 25 20 15 10 5
Welding current (I),A
M ea n o f % D 18 26 V Data Means (a) 260 180 40 35 30 25 20 15 10
Welding current (I),A
M ea n o f % D 24 46 A Data Means (b)
Fig. 5: Interaction effects plot for process control parameters on dilution%D a). %D Vs Welding current (I) and Rated Voltage (V); b) %D Vs Welding current (I) Arc travel rate (A)
0 10 20 30 18 20 22 24 18 30 40 200 180 26 240 220 200 260 240 %D
Welding current (I),A
Rated Volatage (V),V
A 24
W 90 Hold Values
Fig. 6: Interaction effects plot for Rated Voltage (V) and Welding current (I) on dilution
2 2 6 0 4 0
2 2 0
2 2 0 2 4
2 8 3 2
5 2 0 0
3 6
3 0
3 5 4 0 1 8 0
4 5
% D
W e l d i n g c u rr e n t (I) ,A
A rc t ra v e l ra t e (A ),c m/ mi n
V 1 8 W 9 0 H o l d V al u es
The surface plot shown in Figure 6 confirms the results further that the welding current and voltage has a very strong interaction effect on dilution in robotic CO2 arc welding. It is also
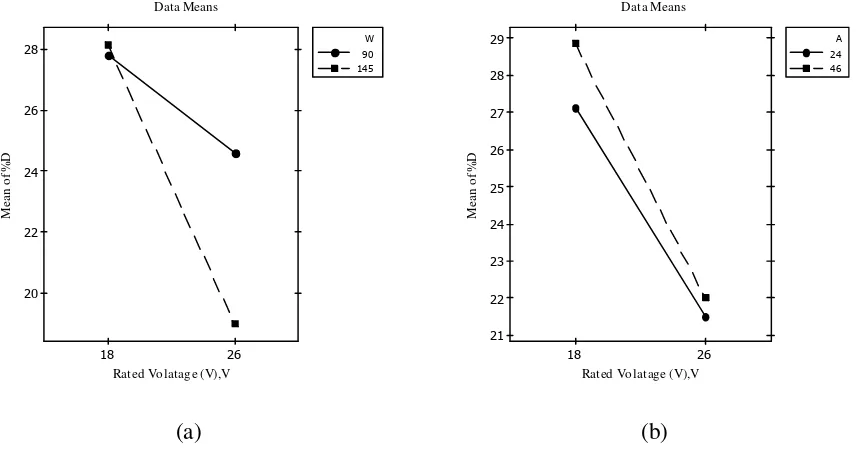
interesting to note that the surface plot has indicated that an increase in rated voltage at a low current level has a slightly negative effect. This phenomenon exists because of the fact that the high voltage generally spreads the arc further and when combined with low current, it will affect the melting rate as well as the convection heat flow, resulting in changes in metal flow within the weld puddle. While analyzing the interaction plot shown in Figure 7 and 5(b), the welding current and arc travel rate have significant positive interaction effect over weld dilution. On the other hand, the influence of welding current on dilution is prominent when the arc travel rate is at a low level, 24 cm/min. The possible reasons could be due to the fact that the slower the arc moves over the base metal, the better the melting rate of both the base metal and electrode and so is the dilution. However, a closer look at the surface plot shown in Figure 7 indicates that an increase in arc travel rate has an inverse effect on percentage dilution. As the arc moves faster over the base metal, the rate of heat flow over the surface area of the metal will be reduced, resulting in a lesser melting rate and dilution. The interaction effects of rated voltage with welding angle and the arc travel rate are shown in Figure 8(a) and (b).
26 18
28
26
24
22
20
Rated Volatage (V),V
M
ea
n
o
f %
D
90 145 W
Data Means
(a)
26 18
29
28
27
26
25
24
23
22
21
Rated Volatage (V),V
M
ea
n
o
f %
D
24 46 A
Data Means
(b)
Fig. 8: Interaction effects plot for process control parameters on dilution%D a)%D Vs Rated voltage (V) and Welding angle (W); b) %D Vs Rated voltage (V) and Arc travel rate (A)
CONCLUSION
Mathematical models were developed in order to predict weld dilution as a function of four process parameters that can be independently controlled and measured during a robotic CO2
arc welding process. The developed models were able to predict process control parameters required to achieve desired dilution with 95% confidence level. The models can also be used to calculate other weld responses that are related and dependent on dilution and could assist the development of automatic welding control systems as well as expert systems so as to establish guidelines and criteria for the most effective weld surfacing design. Since the shielding gas plays an important role in determining the dilution in arc welding in general, there was only one combination of shielding gas mixture (Ar 80% and CO2 20%) which was investigated in this
study due to the practical and financial limitations. Future works should, therefore, focus on a more intense study in order in analyzing the influence of variable pure gasses as well as the gas mixture on dilution percentage in robotic arc welding.
ACKNOWLEDGEMENT
This research work was conducted under the Short Term Research Grant PJP/2010/FKM (32A) S746. The authors wish to thank Universiti Teknikal Malaysia Melaka (UTeM) for providing them the financial and infrastructure support.
REFERENCES
1. Arulmani, R and Sunil Pandey, 2004. Weld surfacing of alloys. Australian welding journal, 49 (2): 43-46.
2. Baldridge, T., G. Poling, E. Foroozmehrc, R. Kovacevic, T. Metz, V. Kadekar and M.C. Gupta, 2013. Laser cladding of Inconel 690 on Inconel 600 superalloy for corrosion protection in nuclear applications, Optics and Lasers in Engineering, 51: 180-184.
3. Ill-Soo, K. S. Joon-Sik and J. Young-Jae, 2001. Control and optimization of bead width for multi-pass welding in robotic arc welding processes. Australian welding journal, 46(3): 43-46.
4. Kim, I.S., K.J. Son, Y.S. Yang and P.K.D.V. Yaragada, 2003. Sensitivity analysis for process parameters in GMA welding process using factorial design method. International Journal of Machine Tools Manufacturing, 43: 763-769.
5. Kim, I.S., J.S. Son, I.G. Kim, J.Y. Kim and O.S. Kim, 2003. A study on relationship between process variables and bead penetration for robotic CO2 arc welding. Journal of Materials
Processing Technology, 136: 139-145.
6. Chandel, R.S, 1988. Mathematical modeling of gas metal arc weld features. Proceedings of the Fourth International Conference on Modeling of Casting and Welding Processes. Palm Coast FL, pp: 109-120.
7. Raveendra, J., and R.S. Parmar, 1987. Mathematical models to predict weld bead geometry for flux cored arc welding. Metal Construction, 19(2): 31R-35R.
8. Kannan, T., and N. Murugan, 2006. Effect of flux cored arc welding process parameters on duplex stainless steel clad quality. Journal of Materials Processing Technology, 176: 230-239.
10.McGlone, J.C., 1978. The submerged arc butt welding of mild steel. Part 1. The influence of procedure parameters on weld bead geometry. Welding Institute Report 79/1978/PE.
11.McGlone J.C., and D.B. Chadwick, 1978. The submerged arc butt welding of mild steel. Part II: The prediction of weld bead geometry from the procedure parameters. The Welding Institute Report 80/1978/PE.