An Investigation on Relationship between Process Control Parameters and
Weld Penetration for Robotic CO
2Arc Welding using Factorial Design
Approach
S. Thiru chitrambalam1, Chew Lai Huat2, Phang Boo Onn3, S.Hemavathi4, Imran Syakir
Mohammad5 Shafizal bin Mat6
1,2,3,5,6
Universiti Teknikal Malaysia Melaka (UTeM), Melaka, Malaysia
4
Linton University College, Mantin, Negeri Sembilan, Malaysia. E-mail1): [email protected]
ABSTRACT
Weld penetration is an important physical characteristic of a weldment that affects the stress carrying capacity of the weld joint. Several welding parameters seem to influence weld penetration. This paper presents the relationship between weld penetration and four direct welding process parameters of robotic CO2 arc welding process on structural carbon steel. Two level, full factorial
design was applied to investigate and quantify the direct and interactive effects of four process parameters on weld penetration. The upper and lower limits of the process control variables were identified through trial and error methodology, and the experiments were conducted using ‘bead on plate’ mode. The performance of the model was then tested by using analysis of variance technique and the significance of the coefficients was tested by applying student’s‘t’ test. Commercial computer programs were used for statistical analysis. The main and interactive effects of different welding parameters are studied by presenting it in graphical form.
KEYWORDS: Robotic CO2 ArcWelding; Process control parameters; Weld Penetration,
Mathematical modelling; Factorial design
1.0 INTRODUCTION
In general, it is mandatory to determine the weld input parameters for every new welded product to obtain a welded joint with in the required specifications. To do so, requires a time-consuming “trial and error” effort, with weld input parameters chosen by the competency and skill of the engineer/welder so that the welds will meet the required specifications. Nevertheless, it’s a common practice that a pre-specified weld bead can often be produced with various parameters combinations (A.C. Underwood, 1980). Therefore it’s imperative for a welding engineer/manufacturer to identify and test this ideal welding parameters combination for a particular welding application.
This paper presents an investigation on the effects of such parameter combination viz., the welding current, rated voltage, welding speed and welding feed angle made on robotic GMAW process with structural mild steel as the base metal to analyse one of the most important characteristic factors of bead geometry of robotic CO2 arc welds, the weld penetration.
2.0 LITERATURE REVIEW
The CO2 arc welding, a version of gas metal arc welding (GMAW) is a versatile, easily automated
and hence easy to be integrated into robotized production centres is increasingly employed for fabrication in many manufacturing industries. GMAW is an arc welding process that uses an arc between a continuously-fed solid filler metal electrode and the base metal. The process is applied with an externally supplied shielding gas (inert or active) and without the application of a pressure. If inert gas shielding is involved, in industrial terminology, it is known as MIG (Metal Inert Gas)
welding or if an active gas such as CO2 and oxygen (O2) is being used it is called as MAG (Metal
Active Gas) welding. Most of the engineering materials that include metals and its alloys such as high strength carbon steels, alloy steels, stainless steel, copper, aluminium, titanium and nickel alloys can be welded in all position by GMAW process by selecting appropriate shielding gas, electrode and welding input parameter variables.
2.1 Process control parameters, bead Geometry and weld penetration
that can eliminate much of the “estimation”, often engaged only by the welding engineers/welders to specify welding parameter for a given task.
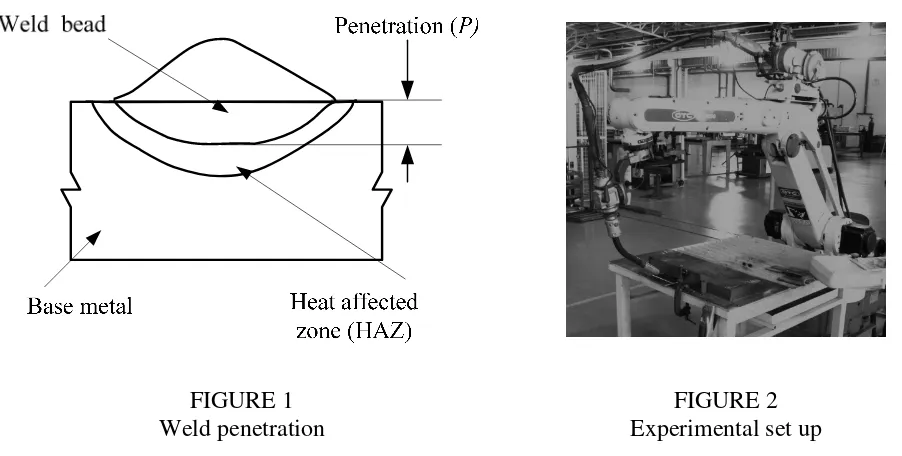
Weld bead penetration, schematically shown in Figure 1 is an important feature of weld geometry in arc welding, playing a decisive role in determining the joint strength and dilution of the base metal. For different applications the optimum depth of penetration requirement varies. For instance, applications like pipe welding, a much deeper penetration is an imperative requirement while for surfacing related processes a shallow penetration is more preferred.
FIGURE 1 Weld penetration
FIGURE 2 Experimental set up
The influence of welding parameters on bead penetration has been studied extensively by many researchers (I.S. Kim et al., 2003, J. I. Lee et al., 2000, Theodore T. Allen et al., 2001). It is generally accepted that welding current, arc voltage, arc travel rate and shielding gases are those process parameters play an important role in determining the characteristic of weld penetration. Among these, the welding current has a very strong influence on weld bead penetration, affects the melting rate, the geometry and the depth of penetration. Increase in current will increase the heat flux through arc force (Sunil Pandey, 2004) stimulates more convective heat flow with a larger molten bath resulting high penetration depths. Arc voltage on the other hand, generally interacts with weld current and arc travel rate greatly affects weld penetration. However when the rest of the parameters are kept constant an increase in arc voltage expands the area the weld pool reducing weld penetration slightly. Also for arc travel rate, an optimum level is absolutely necessary for deeper penetration as both high and low speeds causes shallow penetration. Faster travel rates cause lower heat transfer to the base metal and lesser speed causes accumulation of weld metal accompanied with larger weld pool and low penetration.
For shielding gases Argon (Ar) when mix with CO2 at 15-25% weight improves penetration greatly.
It was reported (Jawad Haidar et al., 1997) that arcs in CO2 and Ar+CO2 mixtures are much more
constricted than arcs in pure Ar. This results in an increase in the radial current density and
pressure increase which can be several times larger than for argon in a gas containing Ar-CO2
mixtures.
2.2 Design of Experiments and Development of Design matrix
During mid 1900s, many attempts were made by researchers to scientifically analyse the effect of process control variables on weld bead geometry. Efforts were initiated for the development of various algorithms in the modelling of arc welding processes. These include the theoretical studies based on heat flow (D. Rosenthal, 1941, N. Christensen et al., 1965) and the experimental based investigations made on actual welding processes (J.C. McGlone, 1978). Mathematical analysis of the relationship between the process variables and weld bead geometry on submerged arc welding was reported by McGlone and Chadwick (J.C. McGlone et al. 1978) and similar mathematical relationship between welding variables and fillet weld geometry for gas metal arc welding (GMAW) using flux cored wires (R.S. Chandel et al., 1988) have also been reported. Chandel et al., first applied mathematical modelling technique to the GMAW process and investigated the relationship between process variables and bead geometry (R.S. Chandel et al., 1988). The results showed that arc current has the greatest influence on bead geometry, and that the mathematical models derived from empirical results can be used to predict bead geometry accurately.
Experimental data based statistical regression methodology was later employed extensively to the welding process control research and attempts have been made by many researchers (Raveendra et al., 1987, Zacharia et al., 1988, J. I. Lee et al., 2000, Pandey 2004,) for predicting and analyzing the effect of welding parameters on the bead shape geometry and shape relationships by developing mathematical models. Those models were developed for analyzing and predicting the effects of the most important welding process control variables viz., welding current, arc voltage, arc travel rate (welding speed), electrode feed rate, shielding gas flow rate, and the electrode angle on the bead geometry and shape relationship viz., weld penetration (P), bead width (W), and height of reinforcement (h), weld penetrations shape factor (WPSF) and weld reinforcement form factor (WRFF) and were used for estimating the individual and interaction effects within the designed limit of the parameters in these models.
3.0 DEVELOPMENT OF MATHEMATICAL MODELLING
As discussed earlier, the main disadvantages of the conventional “trial and error” experimental approach of varying one control parameter at a time while keep the rest constant, needs more trial runs and does not provide any information about the interaction between the selected parameters. This handicap has been eliminated by using mathematical based regression equations. Although there have been many models (linear and non linear) available and has been successfully employed by the researchers (J. I. Lee et al., 2000, Theodore T. Allen et al., 2001, Nagesh D.S. et al., 2002, I.S. Kim et al., 2003) the linear models have been proven to be simple and more useful for arc
welding processes (Sunil Pandey, 2004). Moreover for robotic CO2 arc welding, it was reported that
the linear model found to be producing better prediction of the bead penetration than the curvilinear model and that theoretical results made from the mathematical models may predict the experiment values with any consistent accuracy (I.S. Kim et al., 2003).
most important part is the selection of the independent direct parameters which could affect the response and later the range of the parameters (Sunil Pandey, 2004). For the present study therefore, two level, full factorial design of (24 = 16) sixteen runs with three replications are required to for completing one set of design of experiments. With three replications there were 48 runs (16x3) required to fit the regression equation for determining the effect of four independent direct welding process parameters on weld penetration.
The four parameters that were selected based on the published literature such that they have been proven to be affecting the weld penetration largely. The low and high levels of the parameters were selected on “Trial and Error” basis so that they can keep equilibrium between the wire feed rate and the burn off rate as well as keeping the welds free from all the visible welding defects such as undercut non uniform width, extreme spattering, porosity, overlap, extreme convexity and macro cracking.
For DOE based mathematical modelling the control variables, as part of the general procedure are coded as (+) and minus (-) for high and low level respectively for manual data processing and for rechecking the software based results. These limits that include highest level ((+1) or simply (+)) and the lowest level ((-1) or simply (-)) of each factor are coded respectively as per the equation (1).
-parameters other than the selected were kept constant. For the current investigation therefore the selected welding parameters are coded for their upper and lower limits accordingly in such a way as shown in Table 1.
TABLE 1
Process control parameters and their limits
Sl.No Control Parameter Unit Notation
Limits
For the objective of this investigation which is the prediction of the weld penetration as a function of direct welding parameters such as arc current, rated voltage, arc travel rate and welding angle can be mathematically written in a linear form such as:
This linear equation can be written in the form of a polynomial by taking into account all the
estimated which depend on the four process control parameters I,V,A and W. Employing the least
square method based regression analysis, the measured values from the experiments were employed to measure the response, the weld penetration. The selected process control variables and their respective limits are given in Table 1.
4.0 EXPERIMENTAL SETUP
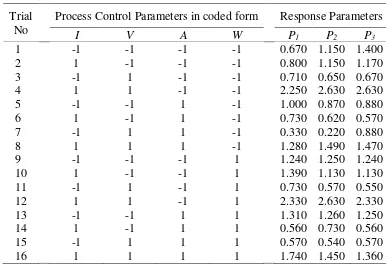
For the experiments, flat position “Bead on plate” technique was employed on SS41 carbon structural steel plate with a specification of 180mm (width) x 100mm (length) x 20mm (thickness). The top surfaces of the test plates were cleaned mechanically and chemically to remove any oxide layer and any source of hydrogen. AWS ER70S-6 (0.8mm) mild steel flux cored wire was used as consumable and the experiments were carried out using OTC DR-4000, robotic arm GMAW welding machine under the shield of 80% Ar and 20% CO2 gas mixture supplied at the rate of
16 litre/min. The chemical composition of the wire is shown in Table 2 and the experimental set up is shown in Figure 2. Three sets of experiments were conducted as per design matrix at random to avoid systematic error creeping into the system. The data was collected once the equilibrium between the wire feed rate and the burn off rate is established and about 300 mm weldment was deposited. The finished welded plates are cross-sectioned at their mid-points using a band saw to obtain its bead geometry. The weld surfaces were polished by standard metallurgical procedure and were etched with 5% Nital (Nitric acid + Ethanol) solution. The plates were dipped into the solution for 7 seconds and then washed with running water before blow drying. The weld bead geometry was traced using an optical profile projector and the bead dimensions, i.e. depth of penetration, height of bead and bead width were measured. With the help of digital planimeter, the areas of the parent metal melted and the fused material from the electrode formed reinforcement were also measured. All the measured values of weld penetration from the three sets of experiments and are presented in Table 3.
For conducting the DOE approach and regression analysis, a statistical software program (MINITAB 16) was used to develop different mathematical models to establish the relationships between welding input parameters and the response parameter. The coefficients obtained were used to construct the model for weld bead geometry outputs, the weld penetration. From the analysis, a
value for this model is lower than 0.05 (α = 0.05 or 95%) confidence level was considered. The
values of the regression coefficients will give an idea as to what extent the factors have relationship with the response. Insignificant coefficients were eliminated to plot the main and interaction effects between the direct process parameters.
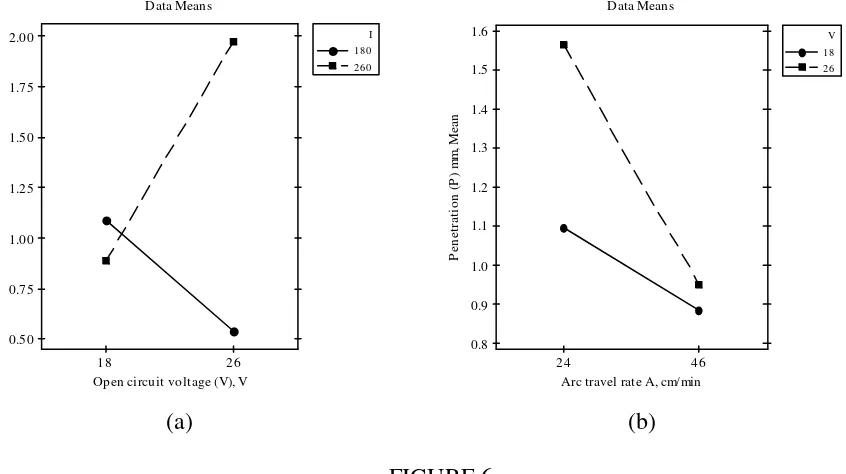
TABLE 3
Design Matrix and Responses
Trial No
Process Control Parameters in coded form Response Parameters
I V A W P1 P2 P3
5.0 ANALYSIS OF THE RESULTS AND DISCUSSION
The experimental data based mathematical models developed from the study can be used to predict the process parameters that control weld penetration by substituting the coded values of the
respective parameters in the equations. The weld penetration (P) was calculated from the model for
each set of welding parameters I, V, A and W individually in their coded form are represented in equation (2). Subsequently, it is possible to obtain the required values of each of the process control parameters by simply substituting the values of the desired weld penetration in the model. Under prescribed welding conditions, the proposed mathematical model for the prediction of weld penetration (P) after neglecting the statistically insignificant coefficients in the coded form is given by:
significance of a particular parameter is assessed by the magnitude of the “p” value associated with it.
A closer look at the regression equation (4) clearly indicated that all the four parameters considered for the study which are statistically significant, have direct effects on weld penetration. The welding current (I) and open circuit voltage (V) and the welding angle (W) have direct proportional relationship with the penetration while the arc travel rate A (welding speed) has an inverse relationship. Increasing any of these process control parameters (I, V, W) will cause an increase in (P) and an increase in welding speed will decrease the penetration level. These observations are in full agreement with most of the published results (I.S. Kim et al., 2003, Erdal Karadeniz et al., 2007)
However, these process parameters when interacted each other are interestingly showed different relationships to the response. The welding current when interact with the open circuit voltage has direct relationship with penetration which means an increase in both of these parameters collectively will increase weld penetration. But when I interact with A the interaction of these two will reduce the weld penetration according to the regression model. Similarly open circuit voltage too has positive relationship with the penetration, but has an inverse effect when combined with arc travel rate. The results clearly demonstrated that the welding speed has the major influence in reducing the weld penetration in robotic CO2 welding process. The accuracy of the model in
predicting the response is tested by plotting the observed and predicted penetration in a scatter diagram shown in Figure 3.
FIGURE 3
Scatter diagram for the prediction of weld penetration (P)
It can be seen from Figures 4 and 5 that unlike the welding angle W (although has significant direct effect on P) the rest of the control variables such as V, I and A have much more significant influence over weld penetration. The slope of the line that represents W however indicates that the effect is comparatively lesser prominence than the rest. The graphs also show both the open circuit voltage and the welding current has positive effect on weld penetration which confirms the results inferred from the equation.
Direct effects of process control parameters on weld penetration (P)
(a) Welding current (I); (b) Open circuit voltage (V)
46
Direct effects of process control parameters on weld penetration (P)
On the other hand, the welding speed has inverse relationship with penetration comparatively at a lower degree. All the graphs clearly indicate that with an assumed linear relationship exists between the weld penetration and the variables, P has strong relationship with V, I,A and W individually and some of them, when combined together controls it in a different manner. The results are also in agreement with most of the published results on consumable arc welding (Erdal Karadeniz et al., 2007).
It is well known that the welding current is the most significant factor for weld penetration as welding current has linear relationship with the electron flow resulting in high heat generation which increase in more melting of the base metal and hence high penetration. Also, the higher the current density, the larger the volume of base material to be melted, and deeper the weld penetration will become. In other words, as current density increases, the heat content of the molten droplets increases as well as the temperature of the drops and hence, more heat is transferred to the base metal. Increase in current also increases arc force which furthers the momentum of the molten droplets, which on striking the weld pool causes a much deeper penetration.
26
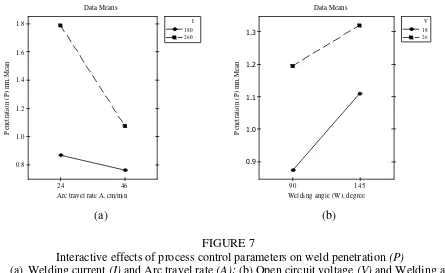
Interactive effects of process control parameters on weld penetration (P)
(a) Welding current (I) and Open circuit voltage (V); (b) Open circuit voltage (V) and Arc travel rate (A);
Figure 4 (b) indicates the existence of a positive relationship between open circuit voltage and penetration at both low and higher levels however, when compared with the interaction effects plots in Figure 6 (a) the trend is little different since the voltage has a slightly inverse effect (although statistically the effect is not prominent enough) at low current levels.
could be the automated electrode wire feed rate which maintains the arc voltage constant by adjusting the arc gap constant.
46
Interactive effects of process control parameters on weld penetration (P)
(a) Welding current (I) and Arc travel rate (A); (b) Open circuit voltage (V) and Welding angle
(W)
The arc voltage is also proven to be an influential process control parameter in arc welding which controls the depth of fusion and hence the geometry of the weldment. An increase in the arc voltage under low current levels will expand the arc reduces the arc intensity and thereby reducing the weld penetration.
However at higher current levels, an increase in the voltage will increase the intensity of convective fluid flow as higher voltage will enhance heat flux and the driving forces for fluid flow, which in turn will improve the penetration profile.
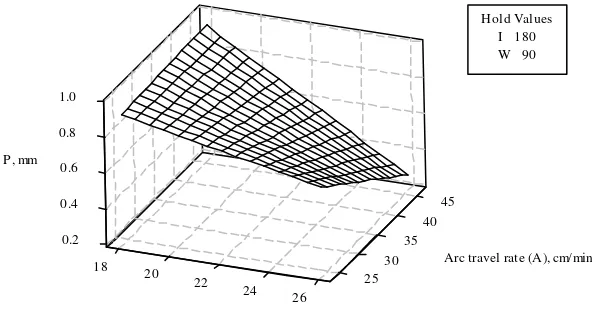
2
Surface plot for interaction effects plot for Arc travel rate (A) and Welding current (I) on weld penetration (P)
The arc travel rate has a clear negative effect with weld penetration (Figure 5 (a)), and when interact with welding current Figure 7 (a) as well as open circuit voltage Figure 6 (b). However the inversion effect when interacted with voltage is very prominent at both levels (Figure 6 (b)), than with welding current (Figure 7 (a)) at both levels. The surface plots that shows the interaction effects of arc travel rate with welding current (Figure 9) and with voltage (Figure 10) also confirms these observations. This trend also is in total agreement with most of the published results (J. I. Lee et al., 2000), Erdal Karadeniz et al., 2007).
4
Increase in arc travel rate (welding speed) reduces the melting rate of the base metal as the arc passes the area under influence faster and hence heat penetration and hence the depth of fusion is also becoming lesser. The penetration decreases due to the pressure of the large amount of weld pool beneath the electrode, which will cushion the arc penetrating force. This could obviously be attributed to the reduced line power per unit length of weld bead as welding speed increases. Also, at higher welding speeds, the electrode travels faster and covers more distance per unit time. The combined effects of lesser line power and faster electrode travel speed results in decreased metal deposition rate per unit length of weld bead. Hence, penetration and reinforcement decrease as welding speed increases.
Welding angle has a mild influence on weld penetration although the statistical results showed there exists a positive direct relationship (Figure 5 (b) and 7 (b)). The possible reasons for this relationship is well documented since the angle determines the point of application and direction of the arc force and hence the weld pool motion with the relative angular position between electrode and base plate alters the weld pool shape and the penetration. Changing of electrodes from perpendicular (90°) to forehand position (for example, in this case is 145°) makes the weld bead shallower which resulted in wider weld beads with less penetration. Besides, narrow bead and deep penetration are a result of the application of backhand technique as well.
6.0 CONCLUSIONS
The following are the conclusions drawn from this analysis:
a) A Mathematical model has been developed to predict weld penetration as a function of
parameters that can be measured and controlled independently in robotic CO2 arc welding
process
b) The model can be used to calculate other weld responses which depend on weld penetration.
c) The two level, full factorial design is found to be very effective tool for quantifying the main and interaction effects of direct independent welding process parameters on weld penetration. d) It was observed that welding current was the most significant parameter affecting the weld
penetration and that the open circuit voltage and welding speed’s interactions on weld penetration were found to be statistically significant and the interactions are well represented by the surface plots developed.
e) Welding angle was also found to be statistically significant, influencing on welding penetration
in a lower scale as compared to the welding current.
f) The open circuit voltage was found to have inverse relationship with penetration when
interacted with the welding current at low level and when interacted with arc travel rate it has inverse relationship at both levels.
g) The arc travel rate was found to be influenced in an inverse relationship with weld penetration
while the welding angle although has direct linear relationship with penetration in both levels.
7.0 ACKNOWLEDGEMENT
8.0 REFERENCES
M.P. Jain. 2002. Welding & NDT of oil & gas pipelines-productivity & quality issues. National seminar on cost effective welding & productivity. Indian welding society (IWS). New Delhi India. pp. 115.
A.C. Underwood. 1980. Automated welding will meet the desperate need for more pipelines in the United States. Welding Design & Fabrication. pp. 134-135.
I.S. Kim, J.S. Son, I.G. Kim, J.Y. Kim, O.S. Kim. 2003. A study on relationship between process variables and bead penetration for robotic CO2 arc welding, Journal of Materials Processing
Technology 136. 1-3. 139-145.
Widgery, D.J. 1999. Line pipe welding beyond 2000. Svetsaren, Esab welding and cutting Journal. No .3. pp. 8-11.
R. L. Klien. 1984. Pipelines Design, construction and operation.2. Construction press, New York. pp. 31-40.
J. I. Lee, K. W. Um. 2000. A prediction of welding process parameters by prediction of back-bead geometry. Journal of Materials Processing Technology 108. pp. 106-113.
Theodore T. Allen, Waraporn Ittiwattana, Richard W. Richardson, Gary P. Maul. 2001. A Method for Robust Process Design Based on Direct Minimization of Expected Loss Applied to Arc Welding, Journal of Manufacturing Systems. Vol.20/No.5. pp. 329-348.
Sunil Pandey. 2004. welding current and melting rate in submerged arc welding-A new approach. Australasian welding journal. Volume 49. Second Quarter. pp. 33-42.
Jawad Haidar , John J. Lowke. 1997. Effect of CO2 Shielding Gas on Metal Droplet Formation in
Arc Welding. IEEE Transactions on Plasma Science. Vol. 25. No. 5. pp. 931-936.
D. Rosenthal. 1941. Mathematical theory of heat distribution during weld and cutting, Welding Journal. 20 (5). pp. 220-s–234-s.
N. Christensen, V. de L. Davies, K. Gjermundsen. 1965. Distribution of temperatures in arc welding. British Welding Journal. 12. pp. 54–75.
J.C. McGlone. 1978. The submerged arc butt welding of mild steel. Part 1. The influence of procedure parameters on weld bead geometry. Welding Institute Report 79/1978/PE.
J.C. McGlone, D.B. Chadwick. 1978. The submerged arc butt welding of mild steel. Part II: The prediction of weld bead geometry from the procedure parameters. The Welding Institute Report 80/1978/PE.
J. Raveendra, R.S. Parmar. 1987. Mathematical models to predict weld bead geometry for flux cored arc welding. Metal Construction 19 (2). pp. 31R-35R.
T. Zacharia, A.H. Eraslan, D.K. Aidun. 1988. Modeling of non-autogenous welding, Welding Journal 67 (1). pp. 18-s–27-s.
I.S. Kim, J.S. Son, C.E. Park, C.W. Lee, Yarlagadda K.D.V. Prasad. 2002. A study on prediction of bead height in robotic arc welding using a neural network. Journal of Materials Processing Technology. Volumes 130-131- 20. pp. 229-234.
D. S. Nagesh, G. L. Datta. 2002. Prediction of weld bead geometry and penetration in shielded metal-arc welding using artificial neural networks. Journal of Materials Processing Technology. 123- 2. pp. 303-312.
I.S. Kim, K.J. Son, Y.S. Yang, P.K.D.V. Yaragada. 2003. Sensitivity analysis for process parameters in GMA welding processes using a factorial design method. International Journal of Machine Tools & Manufacture 43. pp. 763–769.
D.C. Montgomery. 2005. Design and Analysis of Experiments, 6th edition, John Wiley and Sons, New York. pp. 375-431.