THE INFLUENCE OF CULTIVATION SYSTEM ON DISTRIBUTION PROFILE OF 137Cs AND EROSION / DEPOSITION RATE
Nita Suhartini
Pusat Aplikasi Tehnologi Isotop dan Radiasi - BATAN
Jl. Cinere Pasar Jumat Kotak Pos 7002 JKSKL, Jakarta 12070, Indonesia Email : [email protected]
ABSTRACT
137Cs radiogenic content in the soil can be used to estimate the rate of erosion and deposition in an area occurring
since 1950’s, by comparing the content of the 137Cs in observed site with those in a stable reference site. This experiment
aimed to investigate the influence of cultivation type on distribution profile of 137Cs and distribution of erosion and
deposition rate in cultivated area. A study site was small cultivated area with slope steepness <10o and length 2 km
located in Bojong – Ciawi. For this purpose, the top of a slope was chosen for reference site and three plot sites were selected namely Land Use I that using simple cultivation, Land Use II that using simple cultivation with ridge and furrow, and Land Use III using machine cultivation. The results showed that cultivation could make a movement of
137Cs to the deeper layer and ridges and furrows cultivation system could minimized an erosion process. The net erosion
and deposition for land Use I, II and III were -25 t/ha/yr , 24 t/ha/yr and -58 t/ha/yr, respectively.
Keywords : Erosion and deposition, environmental radioisotope, 137Cs
INTRODUCTION
Indonesia is an agrarian country which agrarian sector is a dominant sup-porting of livelihood. Becauce of dishar-monised deforestation and agriculture sys-tem, the eosion occurred and caused the degradation of soil fertility. Today, erosion is become a major land degradation prob-lems in Indonesia, because it could decrease the agriculture production and also landuse management. Erosion in the steep slope can bring sediment materials in the footslopes. To minimized erosion, it need control to the cultivation land and because of the the many limitations associated with traditional techniques, the use of environ-mental radionuclides as alternative ap-proach could be used to documenting rates
of erosion and sedimentation distribution. Some environmental radioisotopes that have been used in erosion study are 210Pb, 137
Cs and 7Be to estimate a long-term (~ 100 yrs), mid-term (~ 40 yrs) and short-term (<30 days) average soil distribution rates and pattern, respectively [11].
Australia [8]. 137Cs in soil could be used as tracer because it is easy to identified so that its dynamics could be monitored.
137
Cs is a fallout product of nuclear weapons testing carried out in the late 1950’s and early 1960’s. During this time significant levels of 137Cs were produced via the following decay chain [7] :
137
I -â137Xe -â137Cs -â137mBa -ã137Ba (stable) (1)
137
Cs is produced at a relatively late stage after a nuclear explosion and can re-main in the atmosphere for approximately ten years. It is washed out of the atmosphere by rain and n deposited on the earth’s sur-face. On reaching the earth’s surface, 137Cs becomes rapidly and firmly adsorbed on the surface soil and can therefore used as a tracer of soil redistribution. The 137Cs tech-nique is based on a comparison between
the 137Cs inventories measured at eroded and deposited sites in the landscape and the local reference 137Cs inventory that is nor-mally established by sampling at a long-term undisturbed site. Negative (-) values are indicative of erosion and positive (+) values reflect deposition. The 137Cs tech-niques can be used in the identifying the spatial distribution of erosion and deposi-tion in the landscape, and affords a fast and economical way of estimating the results of soil redistribution occurring over the last 35 – 40 years. Both soil loss and depo-sition can be estimated their spatial units.
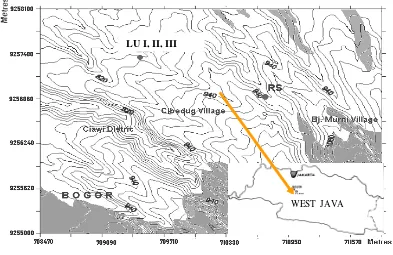
The objective of this experiment was to analys the influences of cultivation sys-tem to the vertical distribution of 137Cs in soil and distribution of erosion and depo-sition rate in small cultivated areas. A small communal cultivated area in Bojong – Ciawi was selected as study area (see Fig.1).
LU I, II, III
[image:2.595.97.490.464.719.2]WEST JAVA
It has a slope steepness of about 10o, and a slope length of about 2 km. The slope is divided into plots, and planted with dif-ferent crops. The top of this slope was cho-sen as the reference site. This site is flat, open and erosion is minimal, and it was used as a cultivated area since 1949 to 1976. For application of the 137Cs technique, three small sites were selected, namely Land use I (15 m x 25 m), Land use II (17,5 m x 20 m) and Land use III (40 m x 50 m). Land use I is about 1000 m distance from the reference site, with a slope steepness of 8.5o, and planted with corn, and rotation with cassava. Land use II is located about 1300 m from the reference site, and con-sists of 12 ridges and 14 furrows. The slope steepness of this plot is 3.25o parallel to furrows and 2.8o perpendicular to furrows, and planted with peanut, cassava and corn in rotation. Land use III is lpcated about 800 m from the reference site, with slope steepness of 14o. This site is cultivated by using machine and planted with chilli and corn in rotation. The location of land use I, II and III to the reference site can be seen in Fig.2.
METHOD
Material and Data analysis
Steel core tubes with internal diam-eter 10 cm and 6.9 cm were used to collect a penetration soil to depth of 100 cm with depth incremental of 10 cm, and bulk samples to depth of 40 cm, respectively. For distribution of erosion and deposition rate, 24 core soil samples were taken from land use I in a grid of 15 x 25 m, with a 5 m distance between the points. From Land use II, 54 core soil samples were taken from a grid of 17.5 x 20 m. Soil samples were taken every 3 ridges and 4 furrows normal to the slope, and at interval of 3.5 m parallel to the ridge and furrow. In land use III, 30 core soil samples were taken in a grid of 40 x 50 m, with a distance between each point of 10 m. The soil samples were brought to the laboratory in PATIR – BATAN, to be prepa-ration.
the fine soil from the > 1 mm fraction. A representative sub samples of the fines (ie 500 g) was put into the plastic marinelli beaker for determination of 137Cs. The 137Cs activity was measured by gamma spectrom-etry at 661 keV with a minimum counting time of 50000 s.
Based on the concentration obtained from gamma spectrometry, erosion and deposition rate of each point was calcu-lated by using formula [9] :
Mass Balance Model 2
(i)
where :
A(t) = cumulative 137Cs activity per unit area (Bq/m2)
R = erosion rate (kg/m2/yr)
d = cumulative mass depth represent-ing the average plough depth (kg/ m2)
= decay constant for 137Cs (yr-1) I(t) = annual 137Cs deposition flux (Bq/
m2/yr)
= percentage of the freshly deposited 137
Cs fallout removed by erosion before being mixed into the plough layer
If an exponential distribution for the initial distribution of 137Cs fallout at the surface of the soil profile can be assumed, Ã can be expressed as :
(ii)
Where ã is the proportion of the annual 137
Cs input susceptible to removal of 137Cs by erosion, and H (kg/m2) is the relaxation mass depth (limit of cultivation depth by
hand) of the initial distribution of fallout 137
Cs in the soil profile.
The rate of erosion and deposition in each plot was estimated using GRID modeling tools provided by Surfer software. The study plot has been divided into cells with an area of 3 m x 3 m. This model had been developed for a spatially distributed sediment delivery that has been applied to catchments ranging in size from several kilometers to several hundred square kilometers [6].
RESULT AND DISCUSSION
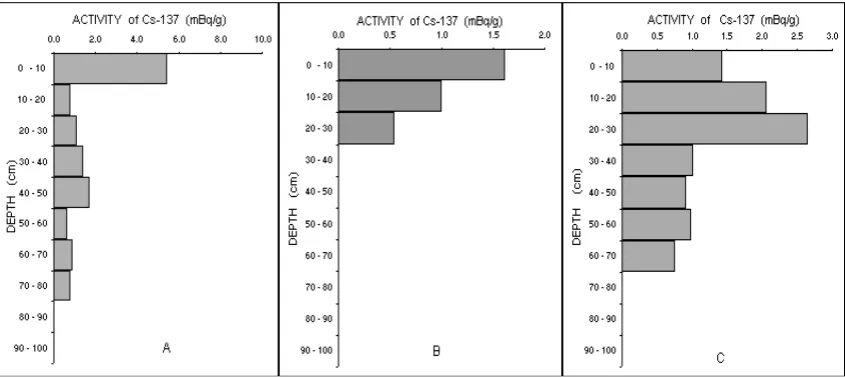
Vertical Distribution Profile of 137Cs Samples collection of 137Cs vertical distribution and distribution of erosion/ deposition were done during 2002 until 2003. Profile of 137Cs vertical distribution for reference site, land use I and land use II can be seen at Figure 3.
use I has shallow cultivation by hand and 137
Cs moves up and down only at the depth of 10 cm.. Land use I has shallow vertical distribution of 137Cs caused of simple cul-tivation by hand and sometimes it left bare without any plant. 137Cs vertical distribu-tion profil of land use I is similar with un-disturbed site’s distribution profile, wherein a maximum of 137Cs concentration at sur-face layer and the 137Cs concentration de-crease exponential on the inde-crease of a depth. Figure 3 C (land use II) showed that maximum value of 137Cs at layer of (20 – 30) cm, and flat distribution until a layer of (60 – 70) cm. This profile of 137Cs distri-bution has formed due to the ridges and furrows cultivation system which is the position of ridge and furrow always changes related to the season. Because of the culti-vation, 137Cs moves up and down into the depth of 30 cm (a maximum depth of fur-rows), and a runoff that collected in the furrows caused 137Cs at the bottom of fur-rows distributed to the deeper layer.
Distribution of erosion and deposition rate
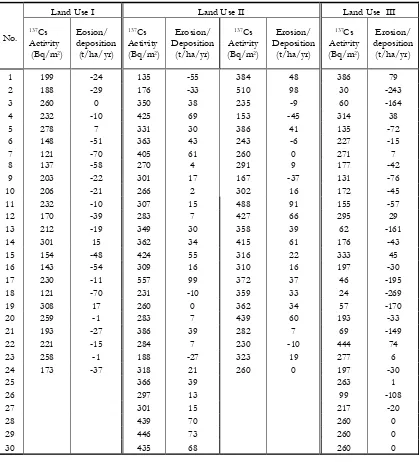
[image:5.595.87.510.84.273.2]The average value for the reference inventory obtained from this study site is (261 ± 37) Bq/m2 based on 16 cores and 1 scraper plate. In the plots field (land use I, II and III), erosion has been ongoing during 24 years (1978 – 2002) because cultivation started in 1978. To calculate the erosion and deposi-tion rate of individual sampling point using MBM2 with data set for a relaxation depth (H) value of 40 kg/m2 and proportion factor (ã) value of 0.85. The result of individual sampling point in Table 1 showed that most of points in Landuse I and III have (-) sign, and in Landuse II has (+) sign. It indicated that erosion had been occurred in plot of landuse I and III, and deposition had been occurred id landuse II. The results could be seen in Table 1. Based on the data from Table 1, erosion and deposition rates of each plots was estimated by using SURFER program and the result of erosion and deposition rate of each plots could be seen in Table 2.
Table 1. Erosion and deposition rate of individual sampling point estimates obtained From the sampling grid in land use I , Land use II and land use III
Land Use I Land Use II Land Use III
No.
137Cs
Activity (Bq/m2)
Eosion/ deposition
(t/ha/yr)
137Cs
Activity (Bq/m2)
Erosion/ Deposition
(t/ha/yr)
137Cs
Activity (Bq/m2)
Erosion/ Deposition
(t/ha/yr)
137Cs
Activity (Bq/m2)
Erosion/ deposition
(t/ha/yr)
1 199 -24 135 -55 384 48 386 79
2 188 -29 176 -33 510 98 30 -243
3 260 0 350 38 235 -9 60 -164
4 232 -10 425 69 153 -45 314 38
5 278 7 331 30 386 41 135 -72
6 148 -51 363 43 243 -6 227 -15
7 121 -70 405 61 260 0 271 7
8 137 -58 270 4 291 9 177 -42
9 203 -22 301 17 167 -37 131 -76
10 206 -21 266 2 302 16 172 -45
11 232 -10 307 15 488 91 155 -57
12 170 -39 283 7 427 66 295 29
13 212 -19 349 30 358 39 62 -161
14 301 15 362 34 415 61 176 -43
15 154 -48 424 55 316 22 333 45
16 143 -54 309 16 310 16 197 -30
17 230 -11 557 99 372 37 46 -195 18 121 -70 231 -10 359 33 24 -269
19 308 17 260 0 362 34 57 -170
20 259 -1 283 7 439 60 193 -33
21 193 -27 386 39 282 7 69 -149
22 221 -15 284 7 230 -10 444 74
23 258 -1 188 -27 323 19 277 6
24 173 -37 318 21 260 0 197 -30
25 366 39 263 1
26 297 13 99 -108
27 301 15 217 -20
28 439 70 260 0
29 446 73 260 0
30 435 68 260 0
Note: (-) : indicative of erosion process, and (+) : indicative of deposition process (sources : 4)
Erosion/depositin Rate (t/ha/yr)
Mean Erosion Mean deposition Net Erosion and deposition Land Use I -25 0 -25
Land Use II -3 27 24
[image:6.595.91.510.120.582.2]Land Use III -62 4 -58 Table 2. Result of Mean erosion and deposition
and net erosion for landuse-I, II and III
The calculation of mean and net ero-sion rate for land use I that showed in Table 2 was -25 t/ha/yr, and -25 t/ha/yr respec-tively. Figures 4 showed the erosion and deposition contour maps for land use I pro-duced using surfer software, and explained the erosion occurred over most of the plot. This site is cultivated by hoelike tool, and is kept flat after cultivation. The fine soil at this site is easy remove to the lower point by water erosion, because sometime this site was unplanted and kept in flat condition. This site has net erosion more than -10 t/ha/yr and according to Wischmeier and Smith (1978), the value of 10 t/ha/yr is the maximum soil erosion tolerance rate,
and it suggest that land use I has serious erosion over 24 years [10].
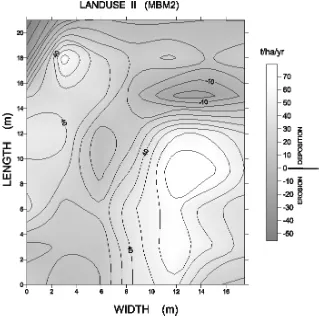
Landuse II is characterized by a ridges and furrows system, where the depth of the furrows is 30 cm. The conversion models can not be applied for traditional cultivation using ridges and furrows, since the calculation of erosion and deposition assumes a flat terrain. To convert the 137Cs inventory of ridges and furrows to equiva-lent values for a flat surface, the 137Cs con-centration value (Bq/kg) for each point was multiplied by bulk density (kg/m3) and ini-tial depth plough (m) prior to ridge forma-tion. From 54 sampling points, this site has
137
Cs inventory values ranging from 135 Bq/m2 to 557 Bq/m2 (see Table 1), and most of sampling points have 137Cs inven-tory more than the reference site value. The mean and net deposition based on indi-vidual sampling point calculated using MBM2 for this site was estimated to be 27 t/ha/yr and 24 t/ha/yr, respectively (see Table 2). The result showed that the site is accumulating 137Cs from the upper site, be-cause it located at the lowest point, and by changing the position of ridges and furrows, movement of soil beyond the site can be avoided. The results provided by MBM2 model conversion show that erosion at this site is minimized by using ridges and fur-rows Figures 5 provide erosion and
deposi-tion contour map of landuse II, and show that some erosion occurred at the top of site.
[image:8.595.139.458.85.405.2]Landuse III which is located above landuse I is cultivated using a machine with a plowing wheel diameter of 60 cm. The depth plough at this site is 30 cm, and the depth of sampling was 40 cm. From Table 1 showed that the 137Cs inventory values at this site were in the range 24 Bq/m2 to 444 Bq/m2 for 30 sampling points. Most of the sampling points have 137Cs inventory values less than the ref-erence site value. Based on the soil redistri-bution rates of individual sampling point pro-vided by MBM2 model conversion, the mean and net erosion rates for this site were -52 t/ ha/yr and -58 t/ha/yr, respectively.
This plot has high erosion rate because calculation using 137Cs method based on ac-tivity of 137Cs in soil, and machinery cultiva-tion in this plot caused some soil loss carried over to the wheels. Figures 6 provide the con-tour map of erosion and deposition rates for landuse III obtained using the MBM2 con-version model, and showed that the highest erosion occurred in the middle of the site.
From Fig. 4 to 6 and Table 2 showed that Land use I has high erosion, because this plot was kept flat, and sometime it was unplanted. Land use III has high erosion that could be the outcome of intensive annual cultivation processes and machin-ery cultivation. The high annual rainfall
rate, especially in a wet season, is a main cause for the high erosion in this area.
CONCLUSION
The investigation showed that culti-vation of the land had influenced the move-ment of 137Cs to a deeper layer in the soil profile, and vertical distribution of 137Cs in this cultivation site was more than 30 cm.
The estimate of mean and net erosion based on the soil redistribution rates of indi-vidual sampling point provided by MBM2 for landuse I are -25 t/ha/yr and -25 t/ha/yr re-spectively. The mean and net deposition pro-vided by MBM2 for landuse II are 27 t/ha/yr Fig. 6. Erosion and deposition contour map for land use III based
and 24 t/ha/yr, respectively. The mean and net erosion for landuse III are -62 t/ha/yr and -58 t/ha/yr, respectively. Net erosion rates in landuse I and III are very significant, and it suggest that those sites have serious erosion. In landuse II, movement of soil to the lower site is avoided by changing the position of the ridges and furrows. To obtain more valu-able information about ridge and furrow sys-tem, an investigation of spatial soil redistri-bution in some plots using this system should be done for the next case.
ACKNOWLEDGEMENTS
This study was supported by the
In-ternational Atomic Energy Agency (RAS-05/39) – Vienna, and National Atomic En-ergy Agency – Indonesia. The author wish to thanks these institutions for their support. Discussion with prof. Prof. R . Loughran as IAEA expert concerning the method and his comments have prove invaluable. The au-thor wish to thanks to Prof. D.E. Walling and Dr. Y.S. Zhang from the Geography Dept.- University of Exeter – United King-dom concerning to the discussion of con-version models. The author also wish to thanks to technicians in Sedimentology Laboratory – PATIR-BATAN, concerning the their helping in sampling and prepara-tion sample.
REFERENCES
Dibyosaputro, S. 2005. “Muatan Suspensi Total dan Laju Sedimentasi Sungai Kayan di Kabupaten Bulungan, Kalimantan Timur”. Forum Geografi, Vol. 19, No. 2, Desember 2005. Hlm 103-114.
Elliott,G.L., Loughran., R.J., and Campbell,B.L., 1992, Appl.Radiat.Isot. A41, p.1 – 1
He, Q., and Walling,D.E., 2003, Hydrol. Process, 17, p 901 – 916
Loughran, R.J., Elliott, G.L., and Campbell, B.L., 1993, Appl. Geogr.,13,p.109 – 188.
Porto,P., Walling,D.E., and Ferro,V., 2001, J of Hydr., 248, p.93 – 108.
Ritchie,J.C., and McHenry, J.R., 1990, J.Environ. Qual., 19, p.215 – 233
Suhartini,N., Country Report of RAS/5/039, Mid-Term Meeting of IAEA, Jakarta, 2003
Suhartini, N., Laporan Tehnis, BATAN, 2004.
Wahyu Santosa, Langgeng. 2005. “Identifikasi Kerusakan Lahan dan Cara Penanganannya di Zona Perbukitan Baturagung Kabupaten Gunung Kidul”. Forum Geografi, Vol. 19, No. 1, Juli 2005. Hlm 30-54.
Walling, D.E., 1998, IAEA – TECDOC, 1028, p.39 – 62
Walling,D.E., Collins,A.L., and Sichingabula,H.M., 2003, Geomorphology, 52,p.193 -213
Wischmeier, W.H., and Smith,D.D., 1978, Predicting rainfall losses: A guide to conservation planning, Agri.Handbook, vol.537, USDA, Washington, DC, p.58