Railway Dynamics Analysis Using Lego Mindstorms
Mohd Azman ABDULLAH
1,2, a, Faiz Redza RAMLI
2,band LIM Chin Sheng
2,c1Advanced Vehicle Technology Research Group, Universiti Teknikal Malaysia Melaka, Hang Tuah
Jaya, 76100 Durian Tunggal, Melaka, Malaysia
2Faculty of Mechanical Engineering, Universiti Teknikal Malaysia Melaka, Hang Tuah Jaya, 76100
Durian Tunggal, Melaka, Malaysia
a[email protected], b[email protected], c[email protected]
Keywords: Railway dynamics, vehicle dynamics, Lego Mindstorms, mechanical vibration, vehicle roll analysis.
Abstract. In recent years, the high speed railway vehicle dynamics performances have been studied and investigated in order to determine the ride comfort of the passengers. Most of the time, these researches were involving expensive and high end technology of data logging system to record and analyze the data. In this research, a low cost data logging system (Lego Mindstorms) is used to gather the data from accelerometer and gyro during experimentation. The study about the behaviour of railway vehicle in term of roll and vibrations at three perpendicular axes during running at the curve track is performed. Actual field run of railway vehicle data collection is performed on the available high speed railway vehicle operating from Kuala Lumpur International Airport (KLIA) to the Kuala Lumpur (KL) Sentral. The route selected consists of several curves which are important to study the dynamics performance of the vehicle. The results from experiment establishes the dynamics performances of the railway vehicle in term of passengers’ ride comfort. With the availability of the data logging system and sensors, the railway vehicle dynamics performance can be analyzed and monitored for future improvement of railway vehicle service and operation.
Introduction
In the previous researches, the performances of high speed railway vehicles were studied in terms of current collections [1-4]. The simulation results were never been validated with actual field performance. Some railway dynamics simulations were also studied [5-8]. The vibration is produced by virtual vertical high response actuator. Even though this method is highly favoured by researchers, the vibration is merely artificial, and the results do not reflect the actual dynamics performances of the railway vehicle. Several experiments were also performed during actual train operation [9]. However, generally, the train is designated for experiment and no passengers are allowed in the cabin. This empty train is good for experimental data gathering, nevertheless, without passengers, the results do not possess actual payload of the train during operational hours. Indeed, to do experiment during peak hour on actual train operation with passengers is costly and additionally affects the train schedule. In order to get actual experimental data on running train, the data logging system consists of several sensors such as gyros, 3 axes accelerometers, and data acquisition system [10]. These experimental setups are reliable and produce favourable railway vehicle dynamics performance data. On the other hand, due to high cost and time consumed, these setups are impractical for real-time data analysis experiment on peak hour full load (with passengers) operational train. Due to these constraints, a simple data logging system, Lego Mindstorms with gyro and accelerometer is used for the experiment to monitor the dynamics performance of the train. Previously, Lego Mindstorms is used for robotic and teaching purposes [11]. But, with the availability of data logging feature with MATLAB Simulink interface, the experimental setup for railway dynamics performance analysis is possible yet reliable.
Methodology
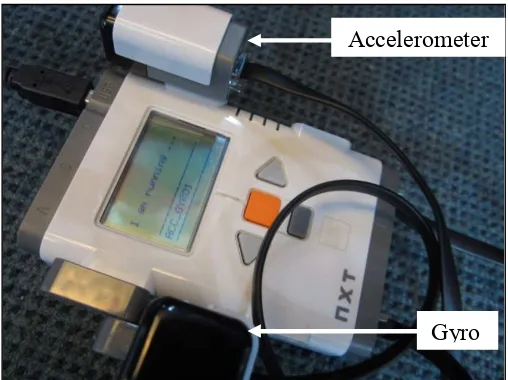
Lego MindstormsTM with NXT brick is used as data acquisition system. NXT brick as shown in
Figure 1 featured 32 bit ARM7 microprocessor, 256 kilo bytes Flash, 4 input ports, 3 output ports, sound speaker, USB 2.0 and Bluetooth compatible. It came along with a rechargeable lithium battery system with an AC plug. Minimum operating system requirement include 512 MB RAM, 300 MB available hard disk space, XGA display with resolution of 1024× 768, 1 USB port, Bluetooth adapter, Window XP Professional or Home Edition with Service Pack 2 and Intel
Pentium processor of 800 MHz [11]. HiTechnic gyro sensor (Figure 1) and accelerometer (Figure
1) are used to measure the roll and vibration of the railway vehicle. HiTechnic Gyro sensor has the
capability of 300 Hz in reading, allowing minimum of 3 × 10 second of sampling time to be
made literally. The orientation of gyro sensor is imperative as it involved only one single axis of measurement. The axis of measurement is in the vertical plane where black end cap of gyro sensor is directed upward [12]. Every gyro sensor has distinct offset value and may deviates when subjected to external factors such as temperature and voltage supply. This deviation phenomenon had been known as sensor drift. Temperature of sensor will rise and hotter than ambient temperature when in used. Sensor warm up is essential before determine the offset in order to obtain no bias
reading. Previous observation has shown that drop of 1 volt will result drop of offset for 5° in linear
relation but it varies with distinct gyro sensor. Thus, it is imperative to determine the offset of gyro sensor before it is applied in every single experiment. Moving average technique and low pass filtering technique can be used to minimize sensor drift to the minimum when the gyro sensor is stand still [12]. HiTechnic acceleration sensor has a measuring range of – 2 g to +2 g where g is
abbreviated from gravity acceleration constant of 9.81 m/s2 with sensitivity up to 200 counts per g
or 0.04905 m/s2. Standard NXT wire is connected to the brick’s input port and uses the digital I2C
communication protocol. Refreshment rate for each axis acceleration measurement is 100 Hz. The
three axes of measurement are labelled x as longitudinally headed, y as laterally headed and z as
vertically headed [12].
Figure 1: Lego Mindstorms NXT with accelerometer and gyro
Experiment
In the experiment, the railway selected is the KLIA Express. KLIA Express running track is approximated to 57 km, with maximum operating speed of 160 km/h that took 28 minutes for the
journey. The train type is ET-425M from Siemens, a 4-cars train set as shown in Figure 2 which
made of two motor cars and two trailer cars. The total length of the train set is 68.7 m, width of 2.84 m and height of 4.16 m [13].
Accelerometer
Figure 2: KLIA Express [13]
Results and Discussion
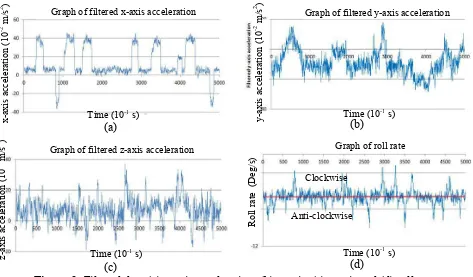
Figure 3(a)(b) and (c) show the results of filtered data from the experiment for the longitudinal,
vertical and lateral vibration. The x-axis acceleration as shown in Figure 3(a) has periodically
upshot graph trend behaviour, certain period with flatter graph climb and graph drop occurred twice within the 500 seconds. Upshot graph trend behaviour can be explained as acceleration of railway vehicle at straight rail track during 50 s, 125 s, 175 s, 280 s, 350 s, 400 s and 425 s. The maximum
acceleration measured is 0.6 m/s2 which imply that the railway vehicle did not come to full throttle
acceleration as 1 m/s2. The y-axis acceleration as shown in Figure 3(b) had significant deviation at
50 s, 280 s, 400 s and 450 s. The contributing factors can be that railway vehicle is taking curve without significant reduced of velocity. The measured range was narrower than x-axis acceleration,
between – 0.5 until 0.4 ⁄ . Time occurrence for significant deviation of y-axis acceleration at 50
s, 280 s and 400 s has been coincident with time occurrence for acceleration in longitudinal direction. Hunting occurred when railway vehicle approaches critical velocity and lateral motion started to be experienced. Parenthetically, the vibration trend is quite “noisy” rather than had significant differ between two adjacent vibration which can also explained for the hunting motion occurrence when the railway vehicle is moving forward. For z-axis acceleration case, the vibration
is more likely crowded at the range of – 0.2 to 0.2 ⁄ as shown in Figure 3(c) with no
significant deviation throughout the 500 seconds. Z-axis acceleration score the least vibration experienced compared to x-axis and y-axis acceleration. This happened as car body weight, the heaviest part in carriage is acting downward due to gravity attraction. Measured value of roll rate is negatively skewed instead of depicting both positive and negative value. Contributing factor might be the position of sensor placement during experiment. Gyro sensor is placed near to the right side from walkway for avoiding obstruction toward others passengers using the walkway. The roll data
of the railway vehicle is shown in Figure 3(d). Positive value depicted roll rate of clockwise while
negative value is meant for roll rate of anti-clockwise. The ride indexes for all motions are tabulated in Table 1. Table 1 depicted that greater value of standard deviation possessed greater range of
comfort zone. Roll rate has the least standard deviation which is 0.754°⁄ , followed by 13.74 ⁄
from y-axis acceleration, the third ranked is 15.97 ⁄ from z-axis acceleration and the most
standard deviation belonged to 17.14 ⁄ from x-axis acceleration. Modulus is a compulsory for
(a)
(c)
(b)
(d)
Figure 3: Filtered data (a) x-axis acceleration, (b) y-axis, (c) z-axis and (d) roll rate
Table 1: Statistical value of acceleration from each axis and roll rate
Mode of motion Mean Standard deviation Range
X-axis acceleration 12.68 ⁄ 17.14 ⁄ −4.460 < < 29.820 Express train using Lego Mindstorms with gyro and accelerometer. The dynamics performances are possible to be monitored during data gathering. This advantage is applicable of low cost railway dynamics monitoring system. The results obeyed the ride index formulation depicts comfort level at that instant. The measured roll rate possessed with the least standard deviation indicated the more importance of the effect of that respective mode of motion especially on cornering. The railway vehicle dynamics performance can be analyzed and monitored for future improvement of railway vehicle service and operation with the availability of the data logging system and sensors.
Acknowledgement
The authors gratefully acknowledged the financial support from Universiti Teknikal Malaysia Melaka and The Ministry of Education, Malaysia (MOE) under Fundamental Research Grant
2 ) Graph of filtered x-axis acceleration
Graph of filtered z-axis acceleration Time (10-1 s)
References
[1] M.A. Abdullah, Y. Michitsuji, M. Nagai and N. Miyajima, Analysis of Contact Force Variation between Contact Wire and Pantograph Based on Multibody Dynamics, Journal of Mechanical Systems for Transportation and Logistics, Vol. 3, No. 3, 552-567 (2010).
[2] M.A. Abdullah, Y. Michitsuji, M. Nagai and N. Miyajima, Integrated Simulation between Flexible Body of Wire and Active Control Pantograph for Contact Force Variation Control, Journal of Mechanical Systems for Transportation and Logistics, Vol. 3, No. 1, 166-177 (2010).
[3] M.A. Abdullah, Y. Michitsuji, M. Nagai and G. Venture, System Identification of Railway Trains Pantograph for Active Pantograph Simulation, Journal of System Design and Dynamics, Vol. 5, No. 5, 1141-1154 (2011).
[4] M.A. Abdullah, R. Jenal, Y. Michitsuji and M. Nagai, Analysis of Dynamic Interaction between Contact Force Variation between Flexible Body of Overhead Contact Wire and Active
Control Pantograph Considering Vertical Body Vibration, Proceeding for the 3rd International
Conference on Engineering & ICT (ICEI2012), Malacca, Malaysia, (April 4th to 5th, 2012), Vol. 1,
236-240 (2012).
[5] C. Funfschilling, G. Perrin and S. Kraft, Propagation of Variability in Railway Dynamic Simulations: Application to Virtual Homologation, International Journal of Vehicle Mechanics and Mobility, Vol. 50, 245-261 (2012).
[6] A. Alonso, N. Gil-Negrete, J. Nieto and J.G. Giménez, Development of A Rubber Component Model Suitable for Being Implemented in Railway Dynamic Simulation Programs, Journal of Sound and Vibration, Vol. 332, Issue 12, 3032–3048 (2013).
[7] J. Pombo and J. Ambrósio, An alternative Method to Include Track Irregularities in Railway Vehicle Dynamic Analyses, Springer: Nonlinear Dynamics, Vol. 68, Issue 1-2, 161-176 (2012). [8] K. Juseok, A Railway Vehicle Dynamic Simulation Based on Efficient Three-dimensional Wheel-Rail Contact Analysis, CORE 2012: Global Perspectives; Conference on Railway Engineering, 10-12 September 2012, Brisbane, Australia. Barton, A.C.T.: Engineers Australia, 2012: 485-492.
[9] R.W. Ngigi, C. Pislaru, A. Ball and F. Gu, Modern Techniques for Condition Monitoring of Railway Vehicle Dynamics, Journal of Physics: Conference Series Vol. 364, No. 1, p012016 (2012).
[10] H. Tsunashima, C.P. Ward and R.M. Goodall, Gu, Condition Monitoring of Railway Vehicle Dynamics, The International Symposium on Speed-up, Safety and Service Technology for Railway and Maglev Systems (STECH’12), 17th - 19th September 2012, Seoul, Korea (2012).
[11] Lego.com, Lego Mindstorms Education, Available at:
http://mindstorms.lego.com/en-us/default.aspx, Last accessed 29th August 2013.
[12] Hitechnic.com, Gyro and Accelerometer for Lego Mindstorms, Available at:
http://www.hitechnic.com, Last accessed 29th August 2013.
[13] Kliaekspress.com, KLIA Ekspress, Available at: http://www.kliaekspres.com, Last accessed
![Figure 2: KLIA Express [13]](https://thumb-ap.123doks.com/thumbv2/123dok/509252.57702/3.595.169.442.69.261/figure-klia-express.webp)