DOI 10.1109/TDEI.2014.004788
A New Technique to Measure Interfacial Tension
of Transformer Oil using UV-Vis Spectroscopy
Norazhar Abu Bakar
1,2, A. Abu-Siada
1, S. Islam
1andM. F. El-Naggar
31
Curtin University, Perth, WA6102, Australia 2
Universiti Teknikal Malaysia Melaka, 76100 Melaka, Malaysia 3
Electrical Engineering Department, Salman bin Abdulaziz University, Saudi Arabia
ABSTRACT
Interfacial tension (IFT) and acid numbers of insulating oil are correlated with the number of years that a transformer has been in service and are used as a signal for transformer oil reclamation. Oil sampling for IFT measurement calls for extra precautions due to its high sensitivity to various oil parameters and environmental conditions. The current used technique to measure IFT of transformer oil is relatively expensive, requires an expert to conduct the test and it takes long time since the extraction of oil sample, sending it to external laboratory and getting the results back. This paper introduces a new technique to estimate the IFT of transformer oil using ultraviolet-to-visible (UV-Vis) spectroscopy. UV-Vis spectral response of transformer oil can be measured instantly with relatively cheap equipment, does not need an expert person to conduct the test and has the potential to be implemented online. Results show that there is a good correlation between oil spectral response and its IFT value. Artificial neural network (ANN) approach is proposed to model this correlation.
Index Terms - Transformer insulation oil, Interfacial tension, UV-Vis spectroscopy, Artificial neural network.
1 INTRODUCTION
RELIABLE monitoring and diagnostic techniques to detect transformer incipient faults are required to avoid catastrophic failures and help in providing efficient predictive maintenance that improves the reliability of the equipment [1, 2]. The quality of insulation system in a transformer reflects the transformer overall health condition [3]. Therefore, samples of transformer insulating oil are essential sources to detect incipient and fast developing faults within the transformer. The combination of heat (pyrolysis), moisture (hydrolysis) and air (oxidation) in transformer contributes to the long term degradation of insulation system which affects the dielectric properties of the fluid [4, 5]. Furan, and dissolved gas analyses are adopted to diagnose power transformer health condition based on chemical formations in insulating oil [6-8]. On the other hand, interfacial tension (IFT) and acidity are performed to examine the sludge formation within the transformer and are considered as a flag for oil reclamation [9]. Furthermore, transformer oil IFT and acidity measurement aids in identifying the insulation aging activity within the transformer as there is a strong correlation between these two parameters and the number of years that the transformer has been in service [10].
ASTM D971 (Interfacial Tension of Oil against Water by the Ring Method) standard is widely used to measure the IFT
of insulating oil [11, 12]. IFT value reflects the soluble polar contaminations and products of degradation that affects the physical and electrical properties of the insulating oil [11, 12]. The IFT number is the amount of force required to pull a small wire ring upward a distance of one centimeter through distilled water and oil interface. New or healthy insulating oil is expected to have a high level of IFT in the range of 40 to 50 mN/m, while oil sample with IFT less than 25 mN/m is considered in critical condition [13]. The current IFT measurement technique is very sensitive and may result in wrong or inconsistent IFT reading if the precautions mentioned in the standard procedure are not carefully followed. Moreover, the current technique calls for an expert person to conduct the test that requires a relatively expensive piece of equipment and takes long time to get the results as oil samples have to be sent to external laboratory which incurs additional running cost. Spectroscopy technology has demonstrated a remarkable performance in various power transformer condition monitoring applications [6, 14-17]. This paper proposes an alternative method to estimate interfacial tension of transformer oil using ultraviolet-to-visible (UV-Vis) spectroscopy along with artificial neural network (ANN) approach. The UV-Vis spectral response of transformer oil can be measured instantly onsite with relatively cheap equipment, does not call for an expert person to conduct the test and can be implemented online. ANN model is developed based on the information gathered from the UV-Vis spectral response of various transformer oil samples and the Manuscript received on 1 July 2014, in final form 16 October 2014,
corresponding IFT value of each sample that is measured in accordance to ASTM D971 method. Accuracy of the developed ANN model is tested using another set of oil samples with wide range of IFT numbers.
2 IFT MEASUREMENT
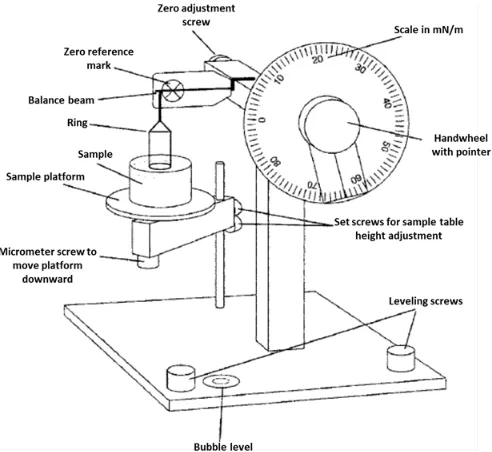
IFT number is determined by the amount of force required to detach a planar ring of platinum wire one centimeter through water/oil interface as stated in ASTM D971 and as shown in the IFT setup in Figure 1 [12]. In this technique, distilled water is used as a base layer inside a container in a depth of 10 to 15 mm. The container is placed on a tensiometer platform so that the ring is immersed to a depth not exceeds 6mm into the water. The platform is then slowly pulled down until the ring ruptures the water surface, while the torsion arm is maintained at zero level by increasing the torque on the reading dial. The oil sample is then carefully floated on the surface of the water until the ring is submerged to a depth of 10mm at least. The platform is then slowly pulled down until the ring ruptures the oil-water interface. Interfacial tension of the oil sample is calculated by:
F
P
IFT
(1)where IFT is the interfacial tension of oil sample in mN/m, P
is the scale reading of the tensiometer when the ring ruptures the oil/water interface in mN/m, and F is a correction factor depends on the ring dimension and water and oil densities. Since this method is very sensitive, it is essential to carefully following all the precautions and steps mentioned in the standards. Failure to do so may lead to incorrect and inconsistent results.
Figure 1. Interfacial tension measurement setup based on ASTM D971[12]
3
UV-VIS SPECTROSCOPY SETUP
Spectroscopy is a powerful non-destructive test that utilizes electromagnetic radiation interaction effect to determine the energy level and structure of atomic or molecular substance
[18]. Instead of measuring molecular rotations and vibrations, UV-Vis spectroscopic methods are used to measure an electronic transition corresponding to the excitation of the outer electrons and is used to quantify the transition of metal ions and highly conjugated electronic compounds [19, 20]. In this paper, UV-Vis spectroscopy test is conducted on various transformer oil samples in accordance to ASTM E275 (Standard Practice for Describing and Measuring Performance of Ultraviolet, Visible, and Near-Infrared Spectrometers) [21]. The UV-Vis spectroscopy experimental set up for measuring the spectral response of transformer oil is as shown in Figure 2. A light source fires a beam of a wavelength in the range of 200 to 1100 nm via input fiber to penetrate transformer oil sample that is placed in a cuvette. The light passing through the sample interacts with the oil, and the passing light is carried by output fiber to the spectrometer, which is connected with a computer to display and analyze the spectral response of the oil sample. Light transmitted through the oil sample containing various contaminations is decreased by that fraction being absorbed and is detected as a function of wavelength. According to Beer-Lambert Law [19], the amount of light absorbed by a solution can be calculated as
.c.l
ε
log
10
λ
D
R
D
S
A
(2)where, Aλ is the light absorbance, Sλ is the sample intensity, Rλ is the reference intensity, Dλ is the dark intensity, εis the
absorbance coefficient of the absorbing species at wavelength λ, c is the concentration of the absorbing species (gram/liter), and l is the path length traversed by the light.
Figure 2. Experimental setup for UV-Vis spectroscopy.
4 EXPERIMENTAL
RESULTS
IEEE Transactions on Dielectrics and Electrical Insulation Vol. 22, No. 2; April 2015 1277
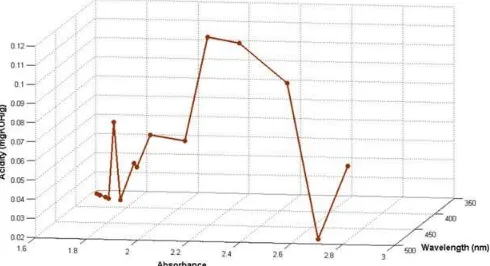
characteristic is stored as a reference spectral. Then, approximately 2.0 ml of each oil sample is placed into the cuvette and scanned by using the spectrometer. The difference between this spectral response and the reference spectral represents the oil spectral absorbance characteristic. To preserve oil originality, all samples were handled and stored in accordance to ASTM D923 (Standard Practices for Sampling Electrical Insulating Liquids) [24] and were measured within 1 to 2 days after being extracted from the transformer. The interfacial tension results obtained using ASTM D971 method are mapped with the spectral response attained for respective oil samples. Samples of oil spectral response measurements are shown in Fig.3 where the encircled number represents the IFT value of the corresponding oil sample in mN/m. Results show the good correlation between oil spectral response and its IFT value where new oil sample with IFT of 42 mN/m exhibits the lowest peak absorbance and the shortest bandwidth. Both parameters are increasing with the decrease in IFT value as can be seen in Fig.3. Fig. 4 shows a 3D plot for the IFT value of various oil samples and the corresponding spectral response parameters (band width and peak absorbance) where the strong correlation between IFT number of a transformer oil sample and the oil spectral response is noticeable.
Figure 3. UV-Vis spectral response for various IFT number (mN/m).
Figure 4. Correlation between IFT (mN/m), peak absorbance and maximum wavelength of oil spectral response.
Figure 5. Correlation between breakdown voltage (kV), peak absorbance and maximum wavelength of oil spectral response.
Figure 6. Correlation between water content (mg/kg), peak absorbance and maximum wavelength of oil spectral response.
Figure 7. Correlation between acidity (mgKOH/g), peak absorbance and maximum wavelength of oil spectral response.
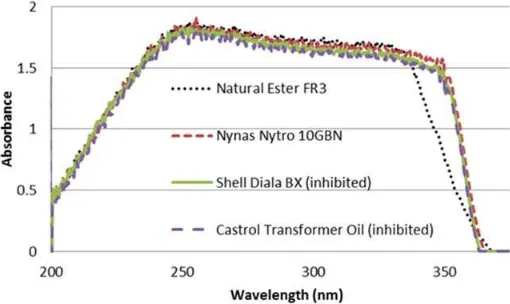
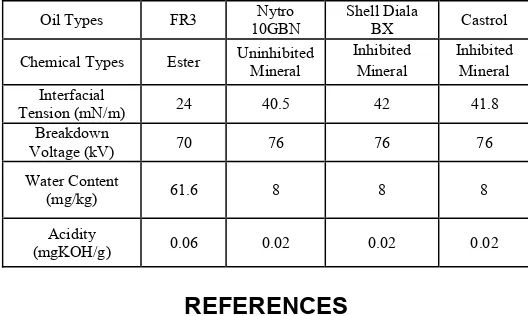
and ester oil may vary due to different oil properties. While a new mineral oil exhibits an IFT value in the range of 40 to 50 mN/m, a new natural ester oil (FR3) has an IFT value around 24-26 mN/m, and new silicone oil has an IFT value of about 25mN/m [28, 29]. Fig. 8 shows a comparison of the spectral response of various new oil types such as Natural Ester (FR3), Nynas Nytro 10GBN, Shell Diala BX, and Castrol Inhibited Transformer Oil. The properties of these investigated oil types are given in the Appendix. Fig. 8 shows that except for FR3 oil, new uninhibited and inhibited mineral oil almost exhibit similar spectral response. This is attributed to the fact that uninhibited and inhibited mineral oil are originated from hydrocarbon types, which have the same characteristics. The anti-oxidation additive in the inhibited oil has negligible impact on the oil spectral response. FR3 is ester-based oil which has different chemical chain structure and group [30].
Figure 8. Spectral response of new transformer oil samples of different types.
5 ARTIFICIAL NEURAL NETWORK
Artificial neural network (ANN) is one of the machine learning techniques that is inspired from the concept of biological neurons. ANN principally consists of inputs, which are multiplied by weights, and then computed by a mathematical function which determines the activation of the neuron [31]. Finally, the output of the neuron is determined by another function, depends on certain threshold limits. With the ability of self-learning and complexity solving, ANN has been implemented in various applications such as pattern recognition, trend prediction, and data compression [32-34].
ANN model is developed to estimate the correlation between IFT of transformer oil and its spectral response parameters; namely bandwidth and peak absorbance. ANN model is determined by its architecture, learning method, and activation. Basic ANN architecture comprises input layer, hidden layer, and output layer. In this paper, multi-layer perceptron feed-forward network (MLPFFN) architecture with 1 hidden layer consists of 20 neurons, 2 input variables, and 1 output as shown in Figure 9 is proposed to estimate the correlation of interfacial tension and spectral response parameters of transformer oil [35].
Figure 9. MLPFFN Neural network architecture.
Input variables to the model are the bandwidth (BW) and peak absorbance (Abs) level of the transformer oil spectral response, and the output of the model is the estimated IFT number of the oil sample. The model is trained with Levenberg-Marquardt back propagation algorithm. This algorithm applies supervised learning concept, which requires historical information of inputs and outputs. The model is trained with random weights that are cautiously adjusted using back propagation technique until the error between actual and estimated results (interfacial tension) is minimized. The activation function of the hidden layer, Aj, is the sum of the inputs Xi multiplied by their respective weights Wji, and can be calculated by:
i i jij
x
w
x
w
A
20
,
(3)where i is the number of input nodes, and j is the number of hidden nodes.
Sigmoid function is applied as a threshold limit in the hidden layer. The output function, O, of this layer can be determined by:
Axwj j
e
w
x
O
,1
1
,
(4)The output of the hidden layer represents an input variable for the output layer; therefore the activation function of the output layer, Ak, can be calculated as:
j j kjk
o
w
o
w
A
200
,
(5)where k is the number of output nodes.
The output of this layer displays the estimated value of the oil sample interfacial tension number. Saturating linear transfer function is implemented in this layer, therefore the output is calculated as:
o
w
A
o
w
Y
k,
k,
(6)The yield of output layer Yk is then compared with an actual target Zk, and the square error between the target and estimated values Ek, is calculated as:
2,
,
,
k kk
o
w
z
Y
o
w
Z
IEEE Transactions on Dielectrics and Electrical Insulation Vol. 22, No. 2; April 2015 1279
This error is minimized by adjusting the weights values using Levenberg-Marquardt back propagation algorithm as below:
J
J
I
J
e
w
w
k1
k
T
1 T (8)where Wk+1 is an updated weight, Wk is the current weight, J is a Jacobian matrix of the first derivative of the network errors with respect to the weights, µ is the combination coefficient which is always positive, I is the identity matrix, and e is the vector of network errors.
The gradient descent step size depends on the combination coefficient value µ. Large combination coefficient generates smaller gradient descent step size, and vice versa. The training process is terminated upon a minimum error is achieved. The proposed ANN model is built using the graphical user interface tool box provided by MATLAB. The performance of the model is assessed by calculating the mean square error (MSE) and regression value (R) which represents the correlation coefficient between the model output and actual target.
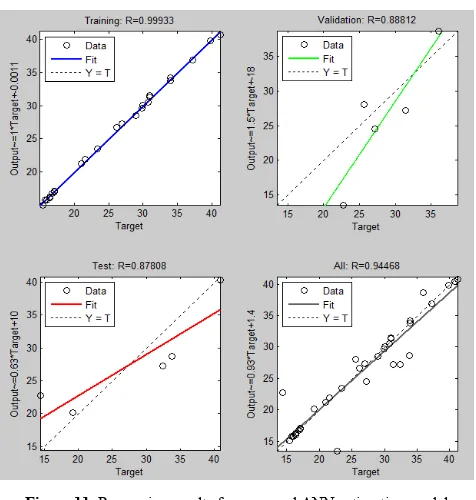
Due to the limited number of training samples, cross validation (CV) method is chosen in developing the ANN model because of its ability to minimize data biasing degree and enhance the correlation coefficient [36]. Oil samples results are randomly distributed into three sets; 70% for training purpose, 15% for validation, and 15% for testing. Figs.10 and 11 show the results obtained for the proposed estimation model for 27 epochs.
The lowest MSE achieved is at epoch 21 with an overall correlation coefficient of 0.94468, which demonstrates an adequate performance of the model. The proposed ANN model is mapped into MATLAB/Simulink interface as shown in Fig. 12, where spectral response parameters (bandwidth and peak absorbance) represent the input variables and the estimated IFT number of the oil sample is the output of the model.
Figure 10. Mean squared error results for proposed ANN estimation model.
Figure 11. Regression results for proposed ANN estimation model.
Figure 12. Interfacial tension ANN estimation model.
6 ACCURACY ANALYSIS
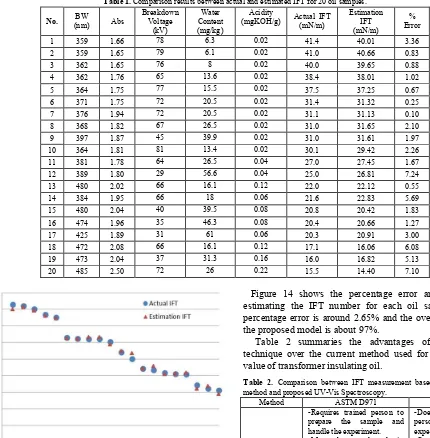
20 oil samples that were collected from various transformers of different operating conditions are used to examine the accuracy of the proposed model. Each oil sample is assessed using ASTM D971 for IFT measurement and UV-Vis spectroscopy for spectral response. The bandwidth and peak absorbance of oil spectral response are extracted and provided to the proposed ANN estimation model. The estimated IFT value is then compared with the actual value obtained using the ASTM D971 method as shown in Table 1 and Figure 13 that reveal estimated IFT values are very close to the actual values with a maximum percentage error of 7.24%. Table 1 also shows the BDV, water content and acidity of each oil sample.
The overall percentage accuracy A of the proposed ANN model can be calculated as:
100
1
act est act
IFT
IFT
IFT
A
(9)Table 1. Comparison results between actual and estimated IFT for 20 oil samples.
No. BW
(nm) Abs
Breakdown Voltage
(kV)
Water Content (mg/kg)
Acidity
(mgKOH/g) Actual IFT (mN/m)
Estimation IFT (mN/m)
% Error
1 359 1.66 78 6.3 0.02 41.4 40.01 3.36
2 359 1.65 79 6.1 0.02 41.0 40.66 0.83
3 362 1.65 76 8 0.02 40.0 39.65 0.88
4 362 1.76 65 13.6 0.02 38.4 38.01 1.02
5 364 1.75 77 15.5 0.02 37.5 37.25 0.67
6 371 1.75 72 20.5 0.02 31.4 31.32 0.25
7 376 1.94 72 20.5 0.02 31.1 31.13 0.10
8 368 1.82 67 26.5 0.02 31.0 31.65 2.10
9 397 1.87 45 39.9 0.02 31.0 31.61 1.97
10 364 1.81 81 13.4 0.02 30.1 29.42 2.26
11 381 1.78 64 26.5 0.04 27.0 27.45 1.67
12 389 1.80 29 56.6 0.04 25.0 26.81 7.24
13 480 2.02 66 16.1 0.12 22.0 22.12 0.55
14 384 1.95 66 18 0.06 21.6 22.83 5.69
15 480 2.04 40 39.5 0.08 20.8 20.42 1.83
16 474 1.96 35 46.3 0.08 20.4 20.66 1.27
17 425 1.89 31 61 0.06 20.3 20.91 3.00
18 472 2.08 66 16.1 0.12 17.1 16.06 6.08
19 473 2.04 37 31.3 0.16 16.0 16.82 5.13
20 485 2.50 72 26 0.22 15.5 14.40 7.10
Figure 13. Comparison between actual and estimation results of IFT.
Figure 14. Accuracy of the proposed ANN model for each samples.
Figure 14 shows the percentage error and accuracy in estimating the IFT number for each oil sample. Average percentage error is around 2.65% and the overall accuracy of the proposed model is about 97%.
Table 2 summaries the advantages of the proposed technique over the current method used for measuring IFT value of transformer insulating oil.
Table 2. Comparison between IFT measurement based on ASTM D971 method and proposed UV-Vis Spectroscopy.
Method ASTM D971 UV-Vis
Test method
-Requires trained person to prepare the sample and handle the experiment. -Must be conducted in laboratory environment. -No possibility to implement for on-line monitoring.
-Doesn’t require trained person to conduct the experiment.
-Can be conducted instantly onsite.
-Has the potential to be implemented online
Price of equipment
-Up to $10000 (depends on the model).
-From $3,500 (depends on spectrophotometer features).
Running Cost -$120-$150/sample -Not applicable.
Accuracy
-Influenced by the equipment sensitivity and the person who conducts the test.
-High accuracy that depends on the ANN model used.
7 CONCLUSION
IEEE Transactions on Dielectrics and Electrical Insulation Vol. 22, No. 2; April 2015 1281
measurement technique as it can be conducted instantly onsite, does not call for an expert person to conduct the test, does not incur any running cost and has the potential to be implemented online for continuous monitoring of transformer insulation oil.
APPENDIX
Table A.1. Properties of various oil types used for the results of Figure 8.
Oil Types FR3 Nytro 10GBN
Shell Diala
BX Castrol
Chemical Types Ester Uninhibited Mineral Inhibited Mineral Inhibited Mineral Interfacial
Tension (mN/m) 24 40.5 42 41.8
Breakdown
Voltage (kV) 70 76 76 76
Water Content
(mg/kg) 61.6 8 8 8
Acidity
(mgKOH/g) 0.06 0.02 0.02 0.02
REFERENCES
[1] A. E. B. Abu-Elanien and M. M. A. Salama, "Survey on the Transformer Condition Monitoring," Power Engineering, Large Engineering Systems Conf., 2007, pp. 187-191, 2007.
[2] A. Abu-Siada and S. Islam, "A Novel Online Technique to Detect Power Transformer Winding Faults," IEEE Trans. Power Delivery,Vol. 27, pp. 849-857, 2012.
[3] D. J. Woodcock and J. C. Wright, "Power transformer design enhancements made to increase operational life," 66thAnnual Int'l. Conf. Doble Clients, 1999. [4] M. Arshad and S. M. Islam, "Significance of cellulose power transformer
condition assessment," IEEE Trans. Dielectr. Electr. Insulation,Vol. 18, pp. 1591-1598, 2011.
[5] A. Schaut, S. Autru, and S. Eeckhoudt, "Applicability of methanol as new marker for paper degradation in power transformers," IEEE Trans. Dielectr. Electr. Insul.,Vol. 18, pp. 533-540, 2011.
[6] N. A. Bakar, A. Abu-Siada, and S. Islam, "A review of dissolved gas analysis measurement and interpretation techniques," IEEE Electr. Insul. Mag.,Vol. 30, No. 3, pp. 39-49, 2014.
[7] N. A. Bakar, A. Abu-Siada, and S. Islam, "A Review on Chemical Diagnosis Techniques for Transformer Paper Insulation Degradation," Australasian Universities Power Engineering Conference, (AUPEC), pp. 778-783, 2013. [8] A. Abu-Siada, S. Hmood, and S. Islam, "A New Fuzzy Logic Approach for
Consistent Interpretation of Dissolved Gas-in-Oil Analysis," IEEE Trans. Dielectr. Electr. Insulation,Vol. 20, pp. 2343-2349, Dec 2013.
[9] H. Gumilang, "Unique relationship between interfacial tension test (IFT) and neutral number test (Acidity) of transformer insulation oil in PLN P3B JB - Jakarta and Banten Regional," IEEE 9th Int'l. Conf. Properties and Applications
of Dielectric Materials (ICPADM), pp. 29-32, 2009.
[10] D. Hydroelectric Research and Technical Services Group, Colorado, "Facilities, Illustrations, Standards and Techniques; Transformer Maintenance," US Department of Interior Bureau of Reclamation,Vol. 3-30, pp. 1-81, 2000. [11] B. Pahlavanpour, M. Eklund, and K. Sundkvist, "Revised IEC standard for
maintenance of in-service insulating oil," Weidmann 3rd Annual Technical Conf., Sacramento, USA, pp. 1-14, 2004.
[12] ASTM, "Standard Test Method for Interfacial Tension of Oil Against Water by the Ring Method," D971 – 12,2012.
[13] T. O. Rouse, "Mineral insulating oil in transformers," IEEE Electr. Insul. Mag., Vol. 14, No. 3, pp. 6-16, 1998.
[14] A. Abu-Siada, S. P. Lai, and S. M. Islam, "A Novel Fuzzy-Logic Approach for Furan Estimation in Transformer Oil," IEEE Trans. Power Delivery, Vol. 27, pp. 469-474, 2012.
[15] D. Skelly, "Photo-acoustic spectroscopy for dissolved gas analysis: Benefits and Experience," IEEE Intl'. Conf. Condition Monitoring and Diagnosis (CMD),pp. 29-43, 2012.
[16] H. Malik, A. K. Yadav, Tarkeshwar, and R. K. Jarial, "Make use of UV/VIS spectrophotometer to determination of dissolved decay products in mineral insulating oils for transformer remnant life estimation with ANN," IEEE Annual Conf. India (INDICON),2011, pp. 1-6, 2011.
[17] H. H. Patrick J. Baird, Gary C. Stevens, "On-Site Analysis of Transformer Paper Insulation Using Portable Spectroscopy for Chemometric Prediction of Aged Condition," IEEE Trans. Dielectr. Electr. Insulation,Vol. 15, p. 1089, 2008. [18] N. A. Bakar, A. Abu-Siada, N. Das, and S. Islam, "Effect of Conducting
Materials on UV-Vis Spectral Response Characteristics," Universal J. Electr. Electronic Eng.,pp. 81-86, 2013.
[19] H. Kaur, Spectroscopy. Meerut, IND: Global Media, 2009.
[20] L. D. Field, S. Sternhell, and J. R. Kalman, Organic Structures from Spectra, 4th ed., Wiley, 2011.
[21] ASTM, "Standard Practice for Describing and Measuring Performance of Ultraviolet and Visible Spectrophotometers," ASTM E275, 2013.
[22] J. Wada, G. Ueta, S. Okabe, and T. Amimoto, "Inhibition technique of transformer insulating oil degradation-evaluation of the effectiveness of oxidation degradation inhibitors," IEEE Trans. Dielectr. Electr. Insul.,Vol. 20, pp. 1641-1648, 2013.
[23] ASTM, "Standard Practice for Describing and Measuring Performance of Ultraviolet, Visible, and Near-Infrared Spectrophotometers,," ASTM E275-01, Vol. 03.06, pp. 72-81, 2001.
[24] ASTM, "Standard Practices for Sampling Electrical Insulating Liquids," ASTM D923-07,2007.
[25] IEC, "Insulating liquids - Determination of the breakdown voltage at power frequency - Test method," IEC 60156 Standard,1995.
[26] IEC, "Insulating Liquids- Oil-impregnated paper and pressboard- Determination of water by automatic coulometric Karl Fischer titration," IEC 60814 Standard,
1997.
[27] IEC, "Insulating liquids - Determination of acidity - Part 2: Colourimetric titration," IEC 62021-2 Standard,2007.
[28] T. V. Oommen, "Vegetable oils for liquid-filled transformers," IEEE Electr. Insul. Mag., Vol. 18, No. 1,pp. 6-11, 2002.
[29] M. A. G. Martins, "Vegetable oils, an alternative to mineral oil for power transformers- experimental study of paper aging in vegetable oil versus mineral oil," IEEE Electr. Insul. Mag., Vol. 26, No. 6, pp. 7-13, 2010.
[30] B. Matharage, M. Fernando, M. Bandara, G. Jayantha, and C. Kalpage, "Performance of coconut oil as an alternative transformer liquid insulation," IEEE Trans. Dielectr. Electr. Insul.,Vol. 20, pp. 887-898, 2013.
[31] C. Gershenson, "Artificial neural networks for beginners," arXiv preprint cs/0308031,2003.
[32] R. A. Ghunem, K. Assaleh, and A. H. El-Hag, "Artificial neural networks with stepwise regression for predicting transformer oil furan content," IEEE Trans. Dielectr. Electr. Insul.,Vol. 19, pp. 414-420, 2012.
[33] V. Miranda and A. R. G. Castro, "Improving the IEC table for transformer failure diagnosis with knowledge extraction from neural networks," IEEE Trans. Power Delivery,Vol. 20, pp. 2509-2516, 2005.
[34] K. F. Thang, R. K. Aggarwal, D. G. Esp, and A. J. McGrail, "Statistical and neural network analysis of dissolved gases in power transformers," 8th Int'l. Conf.
Dielectric Materials, Measurements and Applications, (IEE Conf. Publ. No. 473), pp. 324-329, 2000.
[35] R. A. Ghunem, K. Assaleh, and A. H. El-Hag, "Artificial neural networks with stepwise regression for predicting transformer oil furan content," IEEE Trans. Dielectr. Electr. Insul.,Vol. 19, pp. 414-420, 2012.
[36] A. Krogh and J. Vedelsby, Neural Network Ensembles, Cross Validation, and Active Learning, Advances in neural information processing systems, Cambridge MA: MIT Press, pp. 231-238, 1995.
Norazhar Abu Bakar received the B.Eng.(Hons) degree in electronics and electrical engineering from Leeds University, UK and the MSc.(Eng.) in control systems from Sheffield University, UK. He served as a lecturer at at the Universiti Teknikal Malaysia Melaka, Malaysia. Currently, he is a Ph.D. degree student at Curtin University. His research interests are in condition monitoring and advanced control systems.
S. Islam (M’83-SM’93) received the B.Sc. degree from Bangladesh University of Engineering and Technology, Bangladesh, and the M.Sc. and Ph.D. degrees from King Fahd University of Petroleum and Minerals, Saudi Arabia, all in electrical power engineering, in 1979, 1983, and 1988, respectively. He is currently the Chair Professor in Electrical Power Engineering at Curtin University, Australia. He received the IEEE T Burke Haye Faculty Recognition award in 2000. His research interests are in condition monitoring of transformers, wind energy conversion and power systems. He is a regular reviewer for the IEEE Transactions on Energy Conversion, Power Systems and Power Delivery. Prof. Islam is an Editor of the IEEE Transaction on Sustainable Energy.