WINDI AL ZAHRA
GRADUATE SCHOOL
BOGOR AGRICULTURAL UNIVERSITY
BOGOR
I, Windi Al Zahra, herby stated that this thesis entitled:
Simulation Model of Sustainable Forage Supply for Dairy Farming in
Lembang Sub District West Java
Is a result on my own work under the supervisor advisory board during the
period October 2011- April 2012 and that it has not been published before. The
content of the thesis has been examined by the advising advisory board and
external examiner.
Bogor, May 2012
Windi Al Zahra
P052100161
Dairy Farming in Lembang Sub District West Java. Under the supervision of
ASEP SAEFUDDIN and LUKI ABDULLAH
Forage supply is the core issue in dairy farming productivity in Indonesia. The restricted forage supply is mainly due to the limited farming land owened by the farmers. This research was carried out to formulate the simulation model of forage supply sustainability for daory farming in Lembang Sub district, West Java. Method of this research was collecting data from (1) desk study, (2) survey,(3) interview with the stakeholder, (4) FGD (Focuse Group Discussion). The model was built by using the system approach; need assessment, problem formulation, system identification (causal loop and input-output diagram) and model formulation. The model simulation software program used in this study was Powersim Studio 2005. There were four submodels built; population submodel, dairy cattle population submodel, economic submodel, and forage availability submodel. Based on the dynamic simulation, it was obtained the amount of population as 207.025 ppl in the end of year simulation (20 years), 15.392 AU for dairy cattle population, 48.722.025 litter for milk production, Rp. 157.372.140.750,00 for the revenue from milk yield, 40.484,52 ton for forage production and 165.492,73 ton for forage requirement. Policy analysis was exceeding from the model built. Sensitivity’s test was the real form of intervention from model structures. It showed how sensitive the model as the changes of output and it showed what the effect resulted. Model validation was done by statistical method; MAPE (Mean Percentage Error). The spatial analysis was done to determine the ecological suitability for forage management.
(HMT) yang Berkelanjutan bagi Usaha Ternak Sapi Perah di Lembang, Jawa Barat. Dibimbing oleh ASEP SAEFUDDIN dan LUKI ABDULLAH
Ketersediaan bahan pakan merupakan isu penting dalam usaha peternakan sapi perah. Sapi perah mempunyai ketergantungan yang tinggi terhadap ketersediaan Hijauan Makanan Ternak (HMT) , hal ini terkait dengan produksi susu yang akan dihasilkan nantinya. Permasalahan menjadi semakin kompleks ketika keterbatasan lahan dalam penyediaan HMT. Penelitian ini dilakukan untuk memformulasikan model penyediaan HMT secara berkelanjutan bagi usaha ternak sapi perah di Lembang, Jawa Barat. Metode yang digunakan dalam penelitian ini diantaranya adalah (1) desk study, (2) survey,(3) wawancara dengan stakeholder, (4) FGD (Focuse Group Discussion). Model yang dibangun dengan menggunakan pendekatan sistem (system approach) yang dimulai dengan melakukan analisis kebutuhan, formulasi masalah, identifikasi sistem (causal loop dan diagram input-output) dan formulasi model. Simulasi model dengan menggunakan analisis sistem dengan menggunakan Powersim Studio 2005. Empat submodel dibangun dalam penelitian ini yaitu (1) submodel populasi, (2)submodel populasi sapi perah, (3) submodel ekonomi, (4) dan submodel ketersediaan HMT. Berdasarkan hasil analisis sistem dinamis didapatkan jumlah populasi sebesar 207.025 jiwa di akhir tahun simulasi (20 tahun), populasi ternak perah sebesar 15.392 AU produksi susu mencapai 48.722.025 litter, pendapatan dari hasil produksi susu Rp. 157.372.140.75.00, produksi HMT sebesar 40.484,52 ton dan kebutuhan HMT bagi sapi perah sebesar 165.492,73 ton. Skenario analisis sistem dinamis dilakukan dengan melakukan intervensi untuk mengetahui sensitivitas dari variable dalam model. Validasi model dilakukan dengan menggunakan analisis statistic; MAPE (Mean Percentage Error). Analisis spasial dilakukan untuk menentukan kesesuian ekologis bagi manajemen HMT.
Dairy Farming in Lembang Sub District West Java. Under the supervision of
ASEP SAEFUDDIN and LUKI ABDULLAH
Dairy cattle have a highly dependence on forage for its daily diet that will influence the milk production. It is assumed that an adequate amount of forage will lead automatically to the higher milk production. Thus, it is very important in securing forage supply in order for sustainability of dairy farming. Forage sustainability should be observed by ecology, economy and social aspects. A model is needed on how the system works in providing forage in Lembang. It built by using a dynamic model that showed the time function due to the input changes for every variable observed. The broad objective of this research was building a simulation model of forage sustainability for dairy farming in Lembang. The specific aims of this research were (1) to identify forage and dairy farming condition in Lembang and seek for related factors of forage availability considering the ecology, economy and social aspect (2) to simulate the model that be built to estimate the availability of forage (3) to formulate the policy of decision making from the model simulation built to support management systems of dairy farms. This research was done in Lembang Sub-district, west java province. The research spent for 4 months, since November 2011- February 2012. The method used to collect information as follows: 1) Desk study from the previous information and research, 2) survey to collect the quantitative and qualitative data, 3) interview, 4) Focus Group Discussion (FGD) with the stakeholder. The respondents (the dairy farmers) were divided into four groups, they are the owned land for forage farmers (FOL), the renting land forage farmers (FRA), the sharing land area farmers with Perhutani (FSL) and the non land-forage farmers (FNL). The model was built by using the system approach; need assessment, problem formulation, system identification and model formulation. The model simulation was used Powersim Studio 2005. Validation was done by quantitative behavior pattern comparison. The model of forage sustainability for dairy farm was validated by using MAPE test (mean absolute percentage error). MAPE refers to diminished number between the actual and the simulate data. The policy analysis was considering the carrying capacity in Lembang. The method for counting carrying capacity is using ICPRC (Increasing Capacity Population of Ruminant Cattle). The spatial analysis of ecology suitability for forage in Lembang was done by considering suitability of forage management to determine the pathway of policy analysis. The ecological suitability was made from the criteria of land suitability that have been appointed.
2025. The revenue was Rp. 122.321.957.250 in the early simulation and it is going to increase rapidly for Rp. 157.372.140.750 in the end of simulation year. Forage production was 45.097.11 ton and it will be calculated increasing smoothly for 40.484,52 ton in 2025. Forage requirement was predicted
132.698,75 ton and it will change for 165.492,73 ton in 2025. Policy analysis accessed from the model built. Sensitivity’s test was the real form of intervention from model structures. It will show how sensitive the model is as the changes of output and it will also show how the effect resulted. There were three scenario used; Scenario 1 was focused on the increment of population (3%) and dairy cattle population (5%). Scenario 2 was focused on the increment of population (5%) and dairy cattle population (7%), the extension of plantation area for forage and while milk price was constant. Scenario 3 was focused on the increment of population (10%), and dairy cattle population (10%), the improving of management and the increment of milk price. The ecological suitability was the primary requirements for forage management in Lembang. The ecological suitability was done by classified some criteria in order to get optimum forage production. The ecological suitability carried out for the land evaluation. The result of overlapping has been resulted the potential ecology suitability for forage management. Land suitability was physically divided into 4 classes; highly suitable (S1) for 1.150,71 Ha, moderate suitable (S2) for 4.390,07 Ha, marginally suitable (S3) for 881,06 Ha, not suitable (N) for 1.115,17 Ha and it was found constrain (C) for 2.211,22 Ha that became the restriction point for forage management. The GIS analysis deals with the actual suitability for forage management. It was done by combined The Governor Direction Map into a single layer. Land suitability was physically divided into 4 classes; highly suitable (S1) for 1.055,31Ha, moderate suitable (S2) for 4.377,98 Ha, marginally suitable (S3) for 1.108,97 Ha, not suitable (N) for 1.105,1 Ha and it was found constrain (C) for 2.100,26 Ha
Copyright @2012, Bogor Agricultural University Copyright are protected by law
1. It is prohibited to cite all part of this thesis without referencing to and
mention the source :
a. Citation only permitted for the sake education, research, scientific writing, report writing, critical writing or reviewing scientific problems
b. Citation does not inflict the name and honor of Bogor Agricultural University
2. It is prohibited to republish and reproduce all part of this thesis without
WINDI AL ZAHRA
P052100161
A thesis submitted for the Degree Programs of Master of Science in Natural Resources and Environmental Management
GRADUATE SCHOOL
Student ID : P052100161
Study Program : Natural Resources and Environmental Management
Date of Examination : May 16th2012 Date of graduation :
Approved by, Advisory Board
Dr. Ir. Asep Saefuddin, M.Sc
Dr. Ir. Luki Abdullah M.Sc
Supervisior Co Supervisor
Endorsed by, Program Coordinator
Prof. Dr. Ir. Cecep Kusmana, M.Sc
Dean of Graduate School
Mighty for the mercy, favor, bless me to carry out this task entitled “Simulation Modelling to Analyze Forage Sustainability for Dairy Farming in Lembang Sub-District, West Java” with sound health and mind. This thesis submitted for the Degree Programs of Master of Science in Natural Resources and Environmental Management
I wish to express my earnest thanks and sincere appreciation to Dr. Ir. Asep Saefuddin, M.Sc and Dr. Ir. Luki Abdullah who acted respectively as my respected Chairman and Member of Advisory Committee. I deeply appreciate them for their constant guidance and support during the work. Without their guidance, the result of my work would have been less than desirable. I am also especially grateful to all staff of Study Program in Natural Resources and Environmental Management for helped me during I studied.
I am very grateful to those who have helped me throughout this research The North Cooperative Dairy Cattle (KPSBU), The Animal Livestock and Services West Bandung District, BPN, Central Bureau of Statistic (BPS) for providing me data on this research. The special appreciation is given to Mr. Hermawan Prasetya, S.T.M.T, the doctoral student, who helped me during the discussion about the dynamic system analysis. Mr. Syaidina Ali and his wife for the time during discussed about SIG. My profound gratitude goes to my friends in PSL 2010. I relay grateful to appreciate for the advice, assistance and camaraderie and best wishes to you all.
Finally, I would like to thank to my parents Mr. Nana Mahdi and Mrs. Wiwi Mulyawati, my sister, Sindi Fathonah Halimah and my fiancée, Mustahgfirin for making all of this possible through their continued support, pray and love. They have always been here to set me on the right path and for that I am eternally grateful. They are the reason that I have been able to succeed.
Windi Al Zahra was born in Bogor, West Java on 14th February 1989. She is the first daughter of Mr. Nana Mahdi and Mrs. Wiwi Mulyawati. She finished her elementary school in SD Al-Ghazali Bogor, the Junior high school finished in SMP 9 Bogor, and finished her Senior high school in SMU 9 Bogor. She accepted in Bogor Agricultural University in Faculty of Animal Science, Department of Animal Science and Technology Production in 2006 and officially she received her bachelor degree in 2010. In 2010 she pursued her master degree at Natural Resources and Environmental Management Program. During study, she often joined international seminar and workshop. She joined International Basic Science International Conference (BASIC) in Malang, East
List of Figure ... xvi
I. INTRODUCTION ... 1
1.1 Background ... 1
1.2 Objectives ... 3
1.3 The Significance of Study ... 3
1.4 Conceptual Framework ... 4
II. LITERATURE RIVEW ... 6
2.1 Feed Resources for Dairy Cattle ... 7
2.2 Conceptual Framework for Forage Aviability ... 8
2.2.1 The Definition of Forage for Dairy Farming ... 8
2.2.2 Forage Productivity ... 9
2.2.3 The Importance of Forage Supply ... 10
2.3 Dairy Cattle Enterprises in Indonesia ... 12
2.4 The Dynamic System Approach ... 13
2.4.1 The Understanding of Dynamic System ... 13
2.4.2 Model Formulation ... 15
2.4.3 Model Simulation by Using Dynamic System ... 17
2.4.4 Verification and Validation on Dynamic System ... 18
2.5 Geographic Information Systems (GIS)... 20
III. METHODOLOGY ... 23
3.1 Location and Time ... 23
3.2 Materials ... 23
3.3 Methods ... 24
3.4 Technique for Collecting Data and Data Used ... 24
3.5 Data Analysis ... 25
3.5.1 How the Model is built for Forage Sustainability ... 25
3.5.1.1 Need Assessment ... 26
3.5.1.2 Problems Formulation ... 26
3.5.1.3 System Identification ... 27
3.8 The spatial Analysis of Ecology Suitability for Forage
Management ... 34
IV. RESULT AND DISCUSSION ... 37
4.1 General Condition of the Study Area ... 37
4.1.1 Demography ... 37
4.1.2 Climate ... 38
4.1.3 Topography ... 38
4.2 The Model of Forage Sustainability in Lembang Sub district .... 39
4.2.1 Stakeholder Identification ... 39
4.2.1.1 Dairy Farmers ... 39
4.2.1.2 The North Dairy Coop ... 40
4.2.1.3 Animal Livestock Services of West Bandung District ... 42
4.2.1.4 Perum Perhutani ... 42
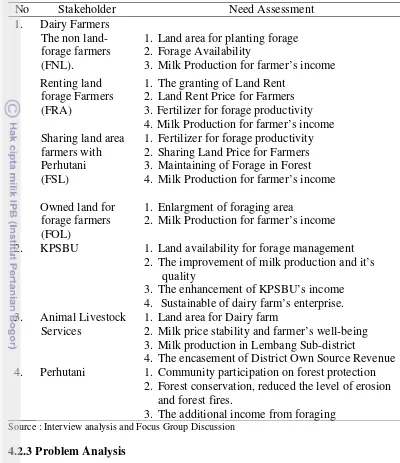
4.2.2 Need Assessment ... 43
4.2.3 Problem Analysis ... 45
4.2.4 System Identification ... 46
4.2.5 Model Formulation ... 47
4.2.5.1 Population Submodel ... 48
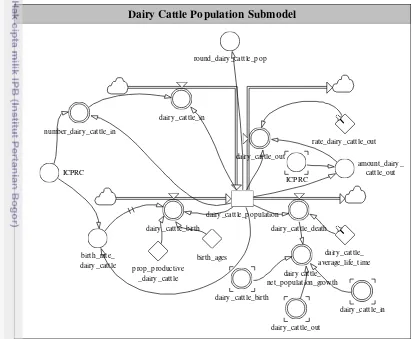
4.2.5.2 Dairy Cattle Population Submodel ... 49
4.2.5.3 The Economic Submodel ... 50
4.2.5.4 The Forgae Availability Submodel ... 51
4.3 The Analysis of Model Behavior ... 54
4.4 Verification and Validation Model ... 63
4.5 The Policy Analysis due to The Model of Forage Sustainability ... 65
4.6. The Spatial Analysis of Ecology Suitability for Forage Management ... 74
CONCLUSION AND RECOMENDATION ... 81
REFERENCES ... 83
2. General criteria of ecological suitability for forage
(Pennisetum Purpureum SCHUM) ... 34
3. Demography data of Lembang Sub-district ... 37
4. The climate information in Lembang Sub-district ... 38
5. Elevation level in Lembang Sub-district ... 39
6. The amount of respondents based on land availability for foraging ... 39
7. The amount of respondent area for foraging ... 40
8. Dairy cattle population, milk production, and members of KPSBU Since 2000-2010 ... 41
9. Population of dairy cattle in West Bandung District area ... 42
10.Need assessment analysis ... 45
11.The amount of population based on simulation period ... 54
12.The amount of dairy cattle population based on simulation period ... 55
13.The amount of milk production based on simulation period ... 57
14.The amount of revenue based on simulation period ... 58
15.The amount of forage production based on simulation period ... 60
16.The amount of forage requirement based on simulation period ... 61
17.The population, dairy cattle population, milk production, revenue, forage production and forage requirement based on simulation period ... 63
18.The amount of population, dairy cattle population, milk production, revenue, forage production and forage requirement based on simulation period (scenario 1) ... 67
19.The amount of population, dairy cattle population, milk production, revenue, forage production and forage requirement based on simulation period (scenario 2) ... 69
20.The amount of population, dairy cattle population, milk production, revenue, forage production and forage requirement based on simulation period (scenario 3) ... 72
21.The land use classification in Lembang on 2009 ... 76
22.The calculation of potential ecology area for forage suitability ... 76
2. Location of study area ... 23
3. The step on how the model is built by using system approach ... 26
4. Input-output diagram ... 27
5. Flow diagram by using Powersim Studio 2005 ... 29
6. Symbol of level ... 30
7. Symbol of rate ... 31
8. Symbol of auxiliary ... 31
9. Symbol of constanta ... 31
10.Symbol of source and sink ... 31
11.Symbol of link ... 32
12.Chart of GIS applications on ecology land suitability for forage management ... 35
13.Input-output diagram ... 46
14.Flow diagram of population in Lembang ... 48
15.Flow diagram of the dairy cattle population ... 49
16.Flow diagram of economic submodel in Lembang ... 50
17.Flow diagram of forage availability ... 52
18.The model of forage sustainability for dairy farming in Lembang ... 53
19.The graph of population based on simulation period ... 54
20.The graph of dairy cattle population based on simulation period ... 56
21.The graph of milk production based on simulation period ... 58
22.The graph of revenue based on simulation period ... 59
23.The graph of forage production based on simulation period ... 60
24.The graph of forage requirement based on simulation period ... 61
25.The graph of simulation result by using scenario 1 ... 66
26.The graph of simulation result by using scenario 2 ... 68
27.The graph of simulation result by using scenario 3 ... 71
1. Equation model forage sustainability for dairy farming in lembang
Sub District,West Java ... 91
2. The calculation of ICPRC ... 94
3. Validation data of forage production ... 95
4. The Amount of Dairy Cattle Population ... 95
5. Validation data of using MAPE ... 95
6. The elevation, rainfall and the effectiveness depth soil map and land use map of lembang 2005 ... 96
7. Respondent profile (dairy farmers) ... 98
8. The structure of dairy farming ... 100
9. The authorization of foraging area (renting land forage Farmers) ... 104
10. The authorization of foraging area (Sharing land area farmers with Perhutani) ... 104
11. The authorization of foraging area(Owned land for forage farmers) ... 105
I. INTRODUCTION
1.1 Background
The main purpose of livestock productions is to provide humanity with products such as meat, eggs and milk. Milk consumption increases every year due to increasing awareness of the public health. According to data from Directorate General of Livestock Services (Ditjenak) the consumption of milk in Indonesia in 2011 was about 1.76 million ton. It perhaps increases continuesely in coming years.
Increase of milk consumption does not match to national milk production. The current population of dairy cattle in 2010 was about 597 thousand heads, which still very low to produce sufficient milk for fulfilling market demand. The increase rate of national milk production from 2010 to 2011 was just 9,94%. This unfavorable circumstance causes dependency on milk import, which reaches 30-60% of total required milk (Ditjenak 2010).
The amount of milk to be imported is influenced by various factors. The first factor is related to the low productivity of dairy cattle. Sudono (2000) stated that the milk production from dairy cattle in Indonesia was only 10-11 liters/day, while in industrial countries such as America and Europe this reaches 20-40 liters/day. Most of the dairy farms in Indonesia are conventional. The dairy farms are classified based on the size of the dairy population, consisting of industrial scale (>100 heads), middle scale (30-100 heads), small scale (10-30 heads) and traditional scale (1-9 heads). In Indonesia the highest amount of milk is contributed by the traditional scale which reaches about 90% of the total milk
productions (Yusdja 2005).
Dairy cattle are highly dependent on forage, which influences the milk production and quality. It is important to secure the forage supply in order to sustain the production of dairy cattle. Feed is consumed by dairy cattle to provide in the requirements concerning maintenance and productivity. Feed can be divided into concentrate and forage. Feed is the highest cost in dairy farming, reaching 70% of total cost production. Based on this calculation the sustainability of forage availability is the main issue in this sector.
Forage sustainability should be observed by ecology, economy and social aspects. It is avowed by Devandra (1994) that sustainability of animal production is the result of applying or introducing strategies which do not strain natural resources. The main problems of providing forage in Indonesia are as follow (1) unpredictable production due to the weather, (2) the low quality of forage itself, (3) higher land conversion, (4) limitation of land area for planting forage. Good management systems will result in increasing forage consumption which will eventually lead to increasing farmer’s income. This is due to the fact that the cost per kg dry matter (DM) spent by farmers is lower compared to that of concentrate (Johnson et al. 2008).
The sustainability of forage supply is needed in dairy farming. It is assumed if a dairy cow requires 25 kg of fresh forage (moisture 87%) which equals to 4 kg DM and the size of the population reaches 445.000 heads. Based on this calculation then the amount of forage needed per day will be 11.125 ton which adds up to 4.060.625 ton needed per year (Lestari 2006). This large demand for forage forms a huge challenge for dairy farmers.
Java Island is the center of dairy cattle in Indonesia, due to the suitable environmental conditions. West Java is one of the central provinces of dairy cattle. Almost 50% of the total milk production in West Java is derived from dairy farms situated in the sub-district Lembang (West Java). The problem in forage supply is limitation of forage production area. It is noticed that West Java is the most densely populated area which has 3.710.061,32 ha with a population of 42,19 billion.
able to provide forage by considering ecological, economic, and social aspects. The model is built using the dynamic model that showed the time function due to the input changes for every variable observed. As Hartisari (2007) stated, a dynamic model has the strength to predict the probability of a situation which might occur in the future. System dynamics is a problem evaluation approach based on the premise that the structure of a system, that is, the way essential system components are connected, generates its behavior (Richardson and Pugh 1989). System dynamic also provides an alternative view point in order to clarify the structure of the system, reveal the links with external environment, and determine the way the organization on operates to reach the defined goal. This analysis is essential for practical purposes. It supports the everyday work of managers to determine (1) the cause-effect relationships between the types of actives in the system , (2) ensuring its contacts with the external and internal environments, (3) the application of certain approaches, methods and techniques for management (Harizanova et al. 2009).
1.2 Objectives
The common objective of this research is to build a simulation model of sustainable forage supply for dairy farming in Lembang. The specific objectives of this research are:
1. To identify forage and dairy farming condition in Lembang and seek for related factors of forage supply considering the ecology, economy and social aspect. 2. To simulate the model to estimate the supply of forage.
3. To formulate the policy of decision making from the model simulation built to support management systems of dairy farms.
1.3 The Significance of Study
1. Developing the science and knowledge of modeling in sustainability of dairy farming.
2. Gathering information on how the system provides forage sustainability. 3. Recommendation of policy and management systems for refinement of forage
sustainability.
1.4 Conceptual Framework
Figure 1. Research framework
II. LITERATURE RIVIEW
2.1 Feed Resources for Dairy Cattle
Feed defined as the foodstuff that is consumed by dairy cattle to fulfill the metabolic requirement and its production. Feed contains the nutrients that can be used for dairy cattle. Generally, feed can be eaten but not all components can be digested (Tilman et al. 1993). Feed is also classified into the following categories (1) Forages, (2) Concentrates (energy and protein feeds), (3) Minerals and vitamins. In general, forage is the vegetative parts of grasses or legume plants containing a high proportion of fiber (more than 30%) neutral detergent fiber. They are required in the diet in a coarse physical form (particles with a length of more than 2.5cm) to help rumen function. Usually, forages are grown on the farm. They may be grazed directly or harvested and preserved as hay or silage, depending on the cow's stage of lactation. They contribute from almost 100% (for non lactating cows) or no less than 35% (for cows in early lactation) of the ration dry matter.
Concentrate may be described by their characteristics as feeds and their effect on rumen function. Usually, concentrates have the following characteristics: (a) they are low in fiber and high in energy, (b) they can be either low or high in protein, cereal grains contain <12% crude protein, but oilseed meals (soybean, cotton, peanut), referred to as protein feeds, can contain > 50% crude protein, (c) They have a high palatability and are usually eaten rapidly. As opposed to forage, concentrates are feed that usually have a low volume per unit of weight (high specific gravity) and they do not stimulate rumination, (d) they usually ferment faster than forages in the rumen and they increase the acidity (reduce the pH) of ruminal contents which may impede normal fiber fermentation, (e) when they comprise more than 60 to 70% of a ration, they may cause health problems.
selenium) are required to achieve optimal production and reproduction. The small amount of microminerals usually required in a dairy ration is often included as a premix in the concentrates or as fortified salt (Wattiaux 2006).
2.2 Conceptual Framework for Forage Aviability 2.2.1 The Definition of Forage for Dairy Farming
Forage is defined as the feed that come from the plant formed grass, legume, and others plant that come from forage groups. Forage can be given as fresh material or as fed. Dairy cattle have a highly dependent on forage. A good management feeding system to improve forage consumption will raise farmer income (Chapman et al. 2007).
The general characteristics of forage are: (1) Bulky ; Bulkiness puts limits on how much a dairy cattle can eat. The energy intake and the milk production of a cow may be limited by too much forage in a ration. However, bulky feeds are essential to stimulate rumination and maintain the health of the dairy cattle. (2) High Fiber and Low Energy: Forage may contain from 30 to 90% fiber (neutral detergent fiber). In general, the higher fiber in a forage, the lower energy content of the forage (3) Variable in Protein ; Depending on the stage of maturity, legumes may contain 15 to 23% crude protein; grasses typically contain 8 to 18% crude protein (depending on the level of nitrogen fertilization), and crop residues may have only 3 to 4% crude protein (straw). Throughout a nutritional standpoint, forages may range from very good feeds (lush young grass, legumes at a vegetative stage of maturity) to very poor feeds (straw, browse).
the rainfall and crude protein and negative correlation both rainfall and crude fiber on forage.
The dry matter material depends on the varieties of the forage, solar radiation intensity, the soil humidity and the management. The water availability related to the effectiveness of rainfall and also intensity of solar radiation (Williamson and Payne 1993). Naturally, dairy cattle can give only single feed for basal metabolism, but it will influence the milk resulted. This situation occurs because the imbalancing nutrient components from the feed given. Folley (1987) stated that the imbalance of nutrienst will reduce the milk production and the lactose, but the fat level will increase.
2.2.2 Forage Productivity
The quality of forage is highly dependent on the genetic and environment factors. Genetic factors give the forage its characteristics, for instance the gramineae family requires more nitrogen abundance from the soil by sucking soluble nitrate or ammonia in water in contrast leguminous family adds nitrogen. These characters are genetically conferred. Environmental factors also take important part in determining forage quality. Genetic changes can be influenced by environmental conditions such as soil condition, climate and management. As a result influencing forage characteristics and quality.
Forage production level is a dependant on the following variables photosynthetic process, decreasing assimilation by respiration and dry matter translocation to forage. The enhancement of forage production is directly proportional with photosynthesis process. In general, Panning de Vries and van laar (1982) dividing the growth and plant production based on dry matter production
availability. If there’s enough water then the growth will be just depend on climate. The main process on this stage is transpiration.
(b) Second stage, production stage, the growth will be depending on nitrogen factor in soil. The situation occurs on marginal land under lack fertilizer. The main process of this stage is nitrogen transformation.
(c) The last stage, the growth is depends on phosphor availability or microelement. The circumstance is happened on land that is less of mineral, so the main process is mineral transformation in organic or an organic form.
Forage production is also influenced by the season, land use and topography. In paddy field, it’s usually dominated by natural grass or introduction grass, while, on moor dominated by shrubs or trees. The impact of forage production occurs during rainy season. Plantation management-spacing, has big part to forage production. It’s related with the growth condition due to lighting. The reason of the sentence above explained by Simth and Whiteman (1983) who stated that the decreasing of intensity of lighting influenced by photosynthesis, transpiration, respiration, nitrate reduction, protein synthesis, hormonal production, translocation, aging, and mineral absorption.
Climate also influences forage’s quality. In humid tropics, erosion frequently related with mineral deficiencies in plants. On the other hand, less drainages causing mineral extraction- micro minerals ie : Mn and Co, and lead into high concentrate in plant tissues. High pH decreases Fe, Mn, Cu, Zn and Co that can be used by plant; otherwise we will know that Mo and Se highly increase. In light of this, we know that leguminous contains more mineral than germinea.
2.2.3 The Importance of Forage Supply
of ecological, economic and social. Devandra (1994) stated that the sustainability on animal livestock enterprises needed to be developed without harming the natural resources. The supply of forage highly dependent on (1) climate factors-temperate, humidity, and annual rainfall, (2) soil fertility, (3) forage varietas, (4) management, (5) environmental adaptation. The supply of tropical forage forced many problems. The problem occurs when the nutrient soil is lack however the production can not be optimized. The other is the changes of stages that will influence the growth and its productivity.
Forage supply is also dependence on the carrying capacity. Since the carrying capacity was known as a model to describe how to manage the animal based on the environmental source on existing animal unit (AU) (Soemarwoto 1997). The improving of carrying capacity can be done by (1) applied the appropriate technology (2) refinement the biological elements (3) arrangement on physical sectors (4) improvement the social and economic sectors (5) extensification (6) food diversification (7) best breed chosen animal or seeds for plant (8) fertilizer for forages (9) utilization the agricultural by products (10) prevention of pest.
The carrying capacity is calculated by the supply of forage productivity. On this model is used Animal Unit or AU. It is commonly used to calculate the amount of pasture space and animal feed. The model illustrated the weight of animal with the forage consumed. The conversion of Animal Unit for the dairy cattle ; Cow/bull ages >2 year equal to 1,00 AU, Heifers ages 1-2 year equal to 0.50 AU and Calf ages <1 year equal to 0.25 AU (Direktorat Perluasan Areal, Departemen Pertanian 2009)
population linked with the forage potency to assess carrying capacity. The area that has potency for forage is needed to be calculated, such as farming area, plantation area, grass land and forest (Natasasmita and Murdikdjo 1980).
2.3 Dairy Cattle Enterprises in Indonesia
2.4 The Dynamic System Approach
2.4.1 The Understanding of Dynamic System
System thinking in terms my furthermore be seen as the problems methodological approach. Dynamic system is a method to understand the complexity of the problems. This method is focused on the policy and how it can describe the problems behavior that can be modeled by the dynamic system. (Richardson and Pugh 1986). A system can be defined as any collection of identifiable elements – abstract or concrete – that are somehow related to one another in a way that is relevant to the dynamics described. Dynamic system is a computer- aided approach to policy analysis and design It applies to dynamic problems arising in complex social, managerial, economic, or ecological systems -- literally any dynamic systems characterized by interdependence, mutual interaction, information feedback, and circular causality.
The field developed initially from the work of Jay W. Forrester. His seminal book Industrial Dynamics (Forrester 1961) is still a significant statement of philosophy and methodology in the field. Within ten years of its publication, the span of applications grew from corporate and industrial problems to include the management of research and development, urban stagnation and decay, commodity cycles, and the dynamics of growth in a finite world. It is now applied in economics, public policy, environmental studies,defense, theory-building in social science, and other areas, as well as its home field, management. The name industrial dynamics no longer does justice to the breadth of the field, so it has become generalized to dynamics system. The modern name suggests links to other systems methodologies, but the links are weak and misleading. System dynamics emerges out of servomechanisms engineering, not general systems theory or cybernetics (Richardson 1991).
System is a connected element, on working together for the goal seeking. The benefit of using system approach was to refinement and improvement on decision making. System approach is giving the problem solver by using some tools/software that is able to identify, analyze, simulate and design a model with independence component for the intent of goal. System approach is the new conceptual frame work on how to solve the problem, it has some typical, seeking for the important factors used then as to find the some solution and making model for decision making. The characteristic of system approach is (1) complex, showing the interaction among elements, (2) dynamic, the changes factors changed by the time, (3) forecast, to predict what will happen in the future. (Eriyatno 2002).
Refers to system thinking, it is related to the physical and structure that is built by the closed loop. These independent elements resulted by the causal effect by the feedback given (Senge 1990). This loop is the building block from the primary model and this concept is sticking on system theoretical. System approach also can be used as the consideration of the problems. According to Manetch and Park (1977) who stated that the system approach will be able to work if the following conditions are met:
1. The goal seeking is clearly defined 2. The model boundary on the real system 3. In a long term is possible to do
The system dynamics approach involves:
• Defining problems dynamically, in terms of graphs over time.
• Striving for an endogenous, behaviorals view of the significant dynamics of a system, a focus inward on the characteristics of a system that themselves generate or exacerbate the perceived problem.
• Thinking of all concepts in the real system as continuous quantities interconnected in loops of information feedback and circular causality.
• Identifying independent stocks or accumulations (levels) in the system and their inflows and outflows (rates).
• The model is usually a computer simulation model expressed in non-linear equations, but it is occasionally left unquantified as a diagram capturing the stock-and-flow/causal feedback structure of the system.
• Deriving understanding and applicable policy insights from the resulting model.
• Implementing changes resulting from model-based on the understanding and insights.
There are some steps needs to be done on system approach:
1. Need Assessment is conducted to identify the need of stakeholders in system approach.
2. Problem formulation is the combination on the complexity problem in the system
3. System identification is done to determine the system variable for filling the need assessment from stakeholders.
4. The abstract model, regarding the interactive process in system analysis by making decisions to exploited the impact from alternative.
5. Implementation, the objective on this part is to give the physical form on the model
6. Operation, as the last step on system approach validation and often some modification is given in this part.
The dynamic system is the systems that will changes during the time caused by the input changes and interaction of each element. The output is dependent on the pervious value of the input (Djojomartono 2000).
2.4.2 Model Formulation
The system approach provides an alternative viewpoint in order to clarify the structure of the system, reveal the links with external environment, and determine the way the organization on operates to reach the defi ned goal. This analysis is essentialal for practical purposes. It supports the everyday work of managers to determine (1) the cause-eff ect relatonships between the types of activies in the system, (2) ensuring its contacts with the external and internal environments, (3) the applicton of certain approaches, methods and techniques for management (Harizanova et al. 2009).
A model is a simplified representation of a system at some particular point in time or space intended to promote understanding of the real system. Eriyatno (2003) stated that the model is classified into three groups, they are the iconic model (physically model), the analog model (diagrammatic model) and the symbolic model (mathematics model). Model in the understanding of the system approach divided into two gropus, the static and dynamic model. The dynamic model has the variable time and will changes by the additional variable. The opposing of dynamic model, the static model has no variable time. A good model will describe as same as the real time.
In term of model, it can defined widely as describing part of the real time, both model and real time is needed similarity in order model can be used. Ford (1999) stated model as the represented of the fact in order the works will be easier. Model is designed completely, if it will represent each aspect from the fact. The base form in building a model, is to find the sensitive parameters. It will influence the system and the relations on each parameter.
2.4.3 Model Simulation by Using Dynamic System
There are two types of systems: static and dynamic. In a static system, the outputs depend only on the present values of the inputs, whereas in a dynamic system the outputs depend on the present and past values of the inputs (Bahlil et al. 2006). A dynamic system is a mathematical representation of the dynamics between the inputs and outputs of a dynamic system. It generally represents dynamic system models with differential or difference equations. A dynamic system is a system that contains time as one of the variables. A dynamic system is a model that attempts to capture the important changes in, and changing interrelationships among, variables and parameters over time. We will use simple models of dynamic systems to study the interrelationships among markets, natural resources and the environment over time.
System dynamics is a problem evaluation approach based on the premise that the structure of a system, that is, the way essential system components are connected, generates its behavior (Richardson and Pugh 1989). If dynamic behavior arises from feedback within the system, finding effective policy interventions requires understanding system structure. System dynamics is well suited to analysis of problems whose behavior is governed by feedback relationships and that have a long-term time horizon (Vennix 1996).
It is not well suited to one-time decisions, such as facility siting decisions. The process of creating a simulation model helps clarify the resource management problem and makes modelers assumptions about the way the system works explicit. Once a model is built, it can be used to simulate the effect of proposed actions on the problem and the system as a whole.
There are the advantages and disadvantes when we formulate the model. The advantage of a simulation is the level of detail that you can get from a simulation. A simulation can give you results that are not experimentally measurable with our current level of technology. The disadvantage is simulation errors. Any incorrect key stroke has the potential to alter the results of the simulation and give you the wrong results. Also usually we are programming using theories of the way things work not laws and theories are not often 100% correct. Levin (2002) stated that the advanteges of using modeling and simulation (1) the only one method for unpredictable researchs, (2) the observation in the real system has a highly cost (3) the result can be obtained faster than in the conventional research.
2.4.4 Verification and Validation on Dynamic System
A system is understood to be an entity which maintains its existence through the interaction of its parts. A model is a simplified representation of the actual system intended to promote understanding. Whether a model is a good model or not depends on the extent to which it promotes understanding. Since all models are simplifications of reality there is always a trade-off as to what level of detail is included in the model.
substitute for the real system for the purposes of experimentation and analysis (Carson 2002).
Model verification and validation are essential parts of the model development process if models to be accepted and used to support decision making. Verification is done to ensure that (1) The model is programmed correctly, (2) The algorithms have been implemented properly, (3) The model does not contain errors, oversights, or bugs. Verification ensures that the specification is complete and that mistakes have not been made in implementing the model concerned with building the model right. It is utilized in the comparison of the conceptual model to the computer representation that implements that conception. It asks the questions: Is the model implemented correctly in the computer? Are the input parameters and logical structure of the model correctly represented?
Validation ensures that the model meets its intended requirements in terms of the methods employed and the results obtained. The ultimate goal of model validation is to make the model useful in the sense that the model addresses the right problem, provides accurate information about the system being modeled, and to makes the model actually used. Validation: concerned with building the right model. It is utilized to determine that a model is an accurate representation of the real system. Validation is usually achieved through the calibration of the model, an iterative process of comparing the model to actual system behavior and using the discrepancies between the two, and the insights gained, to improve the model. This process is repeated until model accuracy is judged to be acceptable (Macal 2005).
2.5 Geographic Information Systems (GIS)
Geographic Information Systems are used by anyone who needs to work with information. Geography plays an important part in much of what we do. Geographic Information System (GIS) can be used as tools for land-use, agricultural and rural development policies. By understanding geography and people's relationship to location, we can make informed decisions (ESRI 2009). Geographic Information Systems (GIS) are different from other information systems because they contain spatial data. These spatial data include the coordinates defining the location, shape, and extent of geographic objects (Bolstad 2002).
The GIS technology has come a long way in the past decade and continues to evolve. New application areas have been found, including agriculture, hydrology, resource management, and coastal resource management. Those areas benefit a lot from the development of GIS. In addition, new products have appeared in the marketplace. What more, dramatic improvements continue in the capability of hardware and software operating platforms; and large volumes of data sets have become available. GIS technology has grown rapidly to become a valuable tool in the analysis and management of spatial ecological problems (Andre et al. 2003).
Agricultural operation is closely connected with natural resources, that have an obvious spatial character, which is considered essential character of GIS, thus GIS has an important function to play in agriculture production, especially in field irrigation and fertilizer application. Spatial models, as an import tool to enhance spatial analysis ability, integrated with GIS to solve more sophisticated and special problems. There are many developed domain models and used widely in varied fields, including agriculture, and environment management (Brisaboa N
combine data; spatial data or attribute data to result the information that very usefull for management system associated with the location/spatial information.
III. METHODOLOGY
3.1 Location and Time
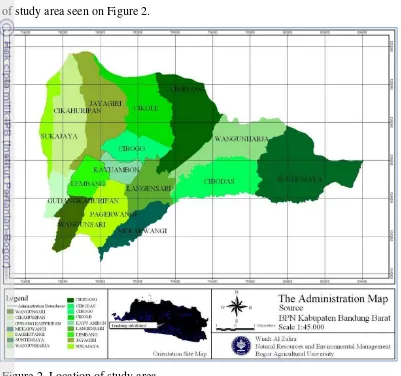
This research was done in Lembang Sub-district, West Java province. The research spent for 4 months, since November 2011- February 2012. The location of study area seen on Figure 2.
Figure 2. Location of study area
3.2 Materials
stakeholder-North Dairy Cooperative (KPSBU) : Central of Bureau (BPS), Perum Perhutani and Animal Livestock Services of West Bandung District
3.3 Methods
The method used to collect information was as follows: 1) Desk study
from the previous information and research, 2) survey to collect the quantitative and qualitative data, 3) interview, 4) Focus Group Discussion (FGD) with the stakeholder. The respondents (the dairy farmers) were divided into four groups, they were Owned Land For Forage Farmers (FOL), Renting Land Forage Farmers (FRA), Sharing Land Area Farmers With Perhutani (FSL), and The Non Land-Forage Farmers (FNL). The amounts of respondents were counted by the proportion estimation by using this equation:
n=
n = sample
= estimated value for p
= (1- estimated value for p)
e = error
= normal distribution
3.4 Technique for Collecting Data and Data Used
Table 1 Data type and sources
No Data Unit Source
Ecology/ Biophysics data 1. Rainfall map of Lembang
The effective depth soil map of Lembang The elevation map of Lembang
Land use map of Lembang Annual rainfall data Temperature data Dairy cattle population Milk Production
Death, birth, emigration and immigration data of dairy cattle
- Bandung District. Social Data
The amount of farmers Immigration
Emigration
Average of life time Fertility
3.5.1 How the Model is built for Forage Sustainability
There are three mainly reasons why the model is considering to be built.
Figure 3. The step on how the model is built by using system approach (Manetsch and Park 1977 in Hartisari 2007).
3.5.1.1 Need Assessment
The first step on how to build the model was doing the need assessment. It was the method to know what the primary needs from the stakeholder. It was conducted by using the depth interview and Focus Group Discussion (FGD) to specific stakeholder.
3.5.1.2Problems Formulation
The problems occur as the impact of contradictive basic need, conflict of interest and lack of resources among each stakeholder. Thus, the disclosed points on these problem statements were:
a. Reference pattern
On dynamic system, the problem formulation was done to identify historical pattern or hypothetic pattern from problems behavior. The aim of this step was to describe the independent of each object in the system, and subsequently the pattern will be formed.
b. Dynamic hypothetic
The initial hypothetic related to the behavior interaction of the stakeholder as the base form of reference pattern. Some iteration, formulation, and the
Need Assessment
Problem formulation
System identification
Modeling 1. Causal loop diagram 2. Input-output diagram Verification
and Validation Ok
Implementation Evaluation
model
Ok
comparison with the empirical proofed and reformation problem was considered as the goal of logic hypothetical.
c. Model Boundary
Model boundary of forage sustainability was desired to tell how extent to be wished on the model. It was separated process caused by the internal interactions in the reference pattern and the process influenced from the external interaction.
3.5.1.3 System Identification
The model for forage sustainability was divided into four submodels. The first submodel was population that shown the dynamic changes of population in Lembang. The second was dairy cattle population submodel that described the dynamic population on dairy farming. The third was economic submodel. The last was forage availability submodel that described demand and supply of forage for dairy cattle. System identification was done by using input-output diagram.
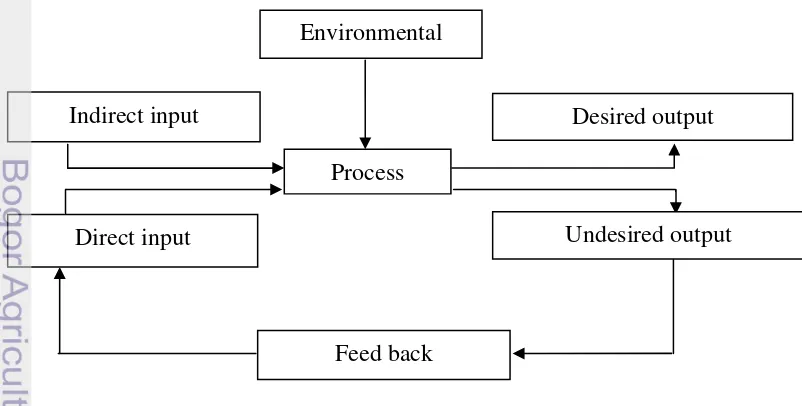
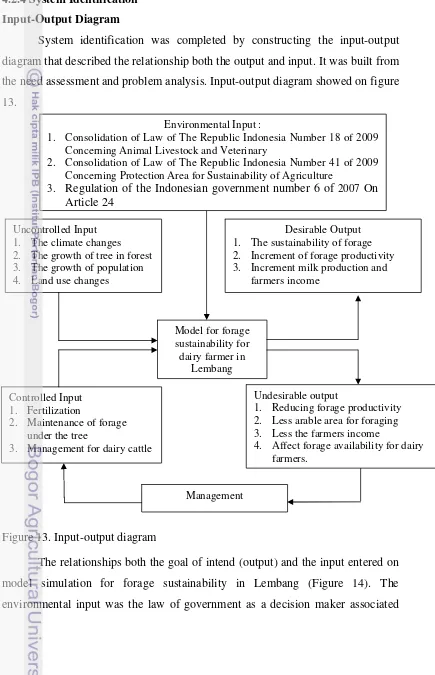
Input-Output Diagram
System identification also illustrated by using input-output diagram. It was seen as the relation both the output resulted and input based on the problem identification and formulation (Figure 4)
Figure 4. Input-output diagram
Feed back Process Indirect input
Environmental
Desired output
Output was the intend goal of the system. It was classified into desired output and undesired output. Undesired output could not be avoided and somehow identified as the negative impact in the system. Feedback was very important to push back the undesired output. Based on this problem, input was highly needed to be modified in order to result desirable output. Input was the factor that influenced how the system worked. Input be classified into direct input and indirect input. Direct input was the factor that affected the system directly working. There were two kinds of direct input; controlled input which directly affecting the system, while uncontrolled input was indirectly affecting the system. Indirect input contained some elements beyond the scope of system called environment input.
3.5.1.4 Model Formulation
Model formulation is defined as the process to change the conceptual system or the model’s structure into the form of equation on software/computer. This process changes a transformation from the conceptual informal to conceptual formal. Model formulation will able to simulate or to determine the dynamic. Model of forage sustainability on dairy farm divided into four sub model (1) population, (2) dairy cattle population, (3) economic, (4) forage supply. As generally, the form equations were used:
1. Population submodel
Y1 (t=T) = Y1 (t=0) + 1 population in.dt - population out.dt Y1 (t=T) = Amount of population in T
Y1 (t=0) = Initial amount of population (t=0) X1population in.dt = Addition amount of population
X1 population out.dt = Reduction amount of population 2. Dairy population submodel
Y2 (t=T) = Y1 (t=0) + 1 dairy population in.dt - dairy population out.dt Y2 (t=T) = Amount of dairy cattle population in T
Y2 (t=0) =Initial amount of dairy cattle population (t=0) X2 dairy population in.dt = Additional amount of dairy cattle population
Le ve l_ 1
Ra t e _ 1 Ra t e _ 2
Co n st a n t _ 1 Co n st a n t _ 2
Au xilia ry_ 1 3. Economic submodel
Y3 (t=T) = Y1 (t=0) + 1 milk production.dt - milk reduction.dt Y3 (t=T) = Amount milk in T
Y3 (t=0) = Initial amount of milk (t=0) X3 milk production.dt = Additional amount of milk
X3 population out.dt = Reduction amount of milk 4. Forage availability submodel
Y4 (t=T) = Y4 (t=0) + 4forage production.dt - forage consumption .dt Y4 (t=T) = Amount of forage in T
Y4 (t=0) = Initial amount of forage (t=0)
X4 forage production in.d t = Addition amount of forage production X4 forage consumption.dt = Reduction amount of forage consumption
Model formulation was built by using the dynamic model
software-Powersim Studio 2005. The submodels were integrated into flow diagram of forage sustainability for dairy farming in Lembang. The next step was entering these fourth submodels into software that able to running the model. Powersim was the tool that used to build, to analyze, and to simulate the dynamic system. There were some variables in dynamic system as follows ”level”, ”rate”, ”auxiliary”, and ”constant ” (Figure 5).
Le ve l
Le ve l_ 1
Ra t e _ 1 1. Level
Current state or condition in the system was level in the dynamics system terminology. Level expressing the accumulation, stock, or state variable from nouns such as people, money, inventory ect, due to the time. Level was the accumulated flow and showed the existing condition. Level deeply influencing by rate. The symbol of level was box and beyond the level denoted as the name of variable (Figure 6).
Figure 6. Symbol of level Powersim equation for level :
Init LEV = Initial condition Flow LEV = -dt*(RK) + dt*(RM) LEV = level (unit)
RM = rate (rate) input RK = rate (laju) output
dt = interval simulation (time) Init = initial value
Flow = Flow for variable
2. Rate
Rate defined as the activity, movement, or rate that contributed to the change of time in variable level. Rate was the only variable which influenced the level (Tasrif 2004). Rate also gave addition effect or reduction effect of level. There were two kinds of rate; input rate and output rate. Input rate gave the additional impact of level, while output rate reduced the accumulation in level. The symbol of rate was depicted as the combination of flow and auxiliary. This symbol must be connected to the level symbol (Figure 7).
Au xilia ry_ 1
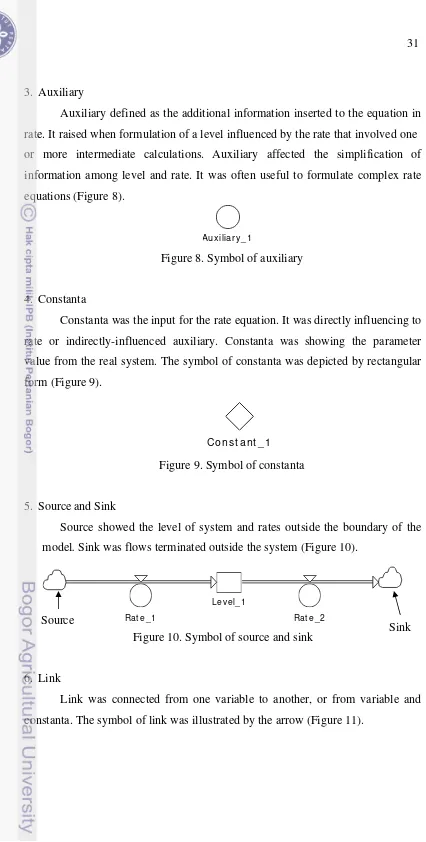
Co n st a n t _ 1 3. Auxiliary
Auxiliary defined as the additional information inserted to the equation in rate. It raised when formulation of a level influenced by the rate that involved one or more intermediate calculations. Auxiliary affected the simplification of information among level and rate. It was often useful to formulate complex rate equations (Figure 8).
Figure 8. Symbol of auxiliary
4. Constanta
Constanta was the input for the rate equation. It was directly influencing to rate or indirectly-influenced auxiliary. Constanta was showing the parameter value from the real system. The symbol of constanta was depicted by rectangular form (Figure 9).
Figure 9. Symbol of constanta
5. Source and Sink
Source showed the level of system and rates outside the boundary of the model. Sink was flows terminated outside the system (Figure 10).
Le ve l_ 1
Ra t e _ 1 Ra t e _ 2
Figure 10. Symbol of source and sink
6. Link
Link was connected from one variable to another, or from variable and constanta. The symbol of link was illustrated by the arrow (Figure 11).
Source
Figure 11. Symbol of link
3.6 Verification and Validation
The next step was simulation and validation due to the model. The aim of simulation is to understand the process in a system, to analyze and to forecast from the process in the future (Muhammadi 2001). Validation was done to understand how proper the model. Validation was very important to recognize the suitability among the simulation and the process in the real time. The implementation of the model is started from the validation of the model structures and the responses from the model Sushlil (1993). Validation of model structures divided into suitability test to answer general question “Does the model structure is proper enough with the fact?”. Another validation was dimension test, that very important to answer “How the dimension does used in every equations?”. Validation was done by quantitative behavior pattern comparison. The model of forage sustainability for dairy farm was validated by using MAPE test (Mean Absolute Percentage Error).
Information : At = Simulate data Ft = Actual data n = period (time)
The accuracy of MAPE :
The classification of accuracy from MAPE test : • MAPE < 5% : Highly correct • 5% < MAPE < 10% : Correct • MAPE > 10% : Incorrect
3.7. Policy Analysis due to the Forage Sustainability on Dairy Farming
considering the carrying capacity in Lembang. The method for counting carrying capacity was using ICPRC (Increasing Capacity Population of Ruminant Cattle).
The potential distribution and dairy farming area was the capacity of the territory in accommodating the additional population of dairy cattle. ICPRC was highly useful in observing how large the area due to its potency to increase population of ruminants based on the ability of forage in the specific region. The calculation of ICPRC was indicated the tendency of relevant areas that allowed additional dairy cattle population of existing number of animal unit (AU). Department of animal livestock services (1994) stated the model of ICPRC used the maximum the ability of land resources (LR) potency and the labor resources (RR) potency. The equation was used:
a. Maximum potency based on the ability of land resources (MPLR)
MPLR = aAl+bGL+ cSL
a = Carrying capacity coefficient of arable land;
a= 0.082 AU/Ha for plantation area; a=1.52 for rice field area. AL = Arable land area (Ha)
b = Carrying capacity coefficient of grass land (0.5 AU/Ha) GL = Grass land area (Ha)
c = Carrying capacity coefficient of field area (2.86 AU/Ha) SL = field area (Ha)
b. Maximum potency based on the ability of labor resources (MPRR)
MPRR = d x KK
a = The average coefficient of dairy farm can be kept on by farmer householders (3 AU/HH)
KK = Maximum potency (AU) based on householder c. ICPRC based on MPLR
ICPRC (LR) = MPLR- Real Population
ICPRC (LR)= Increasing Capacity Population of Ruminant Cattle (AU) Based on land resources
d. ICPRC based on MPRR
ICPRC (RR) = MPRR- Real Population
ICPRC (RR)= Increasing Capacity Population of Ruminant Cattle (AU) based on the ability of labor resources
MPRR = Maximum potency based on the ability of labor resources (AU) Real Population = Real population of dairy cattle
The effectiveness of ICRPC could be seen by using the most influence constrains:
The effectiveness of ICPRC (RR) if ICPRC (RR)< ICPRC (LR) and The effectiveness of ICPRC (LR) if ICPRC (LR)< ICPRC (RRR) and
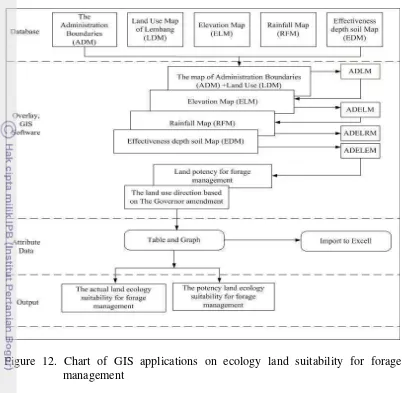
3.8 The spatial Analysis of Ecology Suitability for Forage Management
The spatial analysis of ecology suitability for forage in Lembang was done by considering suitability of forage management to determine the pathway of policy analysis. The ecological suitability was built by clasified the land suitability that has been appointed (Table 3). Land suitability was physically divided into 4 classes, namely: highly suitable (S1), moderately suitable (S2), marginally suitable (S3) and not suitable (N).
Table 2. General criteria of ecological suitability for forage (pennisetum purpureum SCHUM)
Quality/ land characteristic
Critical Limits For
S1 S2 S3 N
Annual Rainfall (mm) 1.700-2.000 2.000-3.000 3.000-5.000 >5.000
Effective depth soil (cm) >50 >50 30-50 <30
Slope elevation(%) < 8 8-16 16-30 >30
Source : Balai Penelitian Tanah (2003)
Figure 12. Chart of GIS applications on ecology land suitability for forage management
IV. RESULT AND DISCUSSION
4.1 General Condition of the Study Area
Lembang Sub-district is part of West Bandung District area, West Java Province. It is bounded between longitude 107º 33’36” to 107º 45’36” and latitude 6º 43’12” to 6º 52’48” with the total area 9.748,22 Ha. The administrative boundaries of Lembang Sub-district :
• North : Subang district • South : Bandung City
• East : Bandung District and Sumedang District • West : Parongpong Sub-district.
4.1.1 Demography
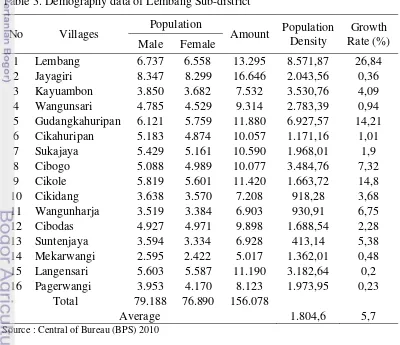
The demography condition of the area study was showed on Villages, Population, Population Density and Growth Rate (Table 3).
Table 3. Demography data of Lembang Sub-district
No Villages Population Amount Population Density
Growth Rate (%) Male Female
1 Lembang 6.737 6.558 13.295 8.571,87 26,84 2 Jayagiri 8.347 8.299 16.646 2.043,56 0,36 3 Kayuambon 3.850 3.682 7.532 3.530,76 4,09 4 Wangunsari 4.785 4.529 9.314 2.783,39 0,94 5 Gudangkahuripan 6.121 5.759 11.880 6.927,57 14,21 6 Cikahuripan 5.183 4.874 10.057 1.171,16 1,01 7 Sukajaya 5.429 5.161 10.590 1.968,01 1,9 8 Cibogo 5.088 4.989 10.077 3.484,76 7,32 9 Cikole 5.819 5.601 11.420 1.663,72 14,8 10 Cikidang 3.638 3.570 7.208 918,28 3,68 11 Wangunharja 3.519 3.384 6.903 930,91 6,75 12 Cibodas 4.927 4.971 9.898 1.688,54 2,28 13 Suntenjaya 3.594 3.334 6.928 413,14 5,38 14 Mekarwangi 2.595 2.422 5.017 1.362,01 0,48 15 Langensari 5.603 5.587 11.190 3.182,64 0,2 16 Pagerwangi 3.953 4.170 8.123 1.973,95 0,23
Total 79.188 76.890 156.078
Average 1.804,6 5,7
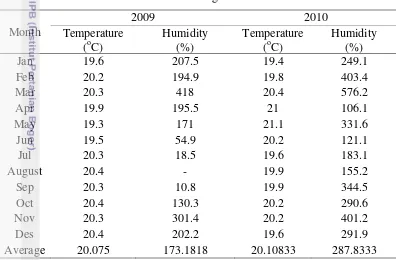
4.1.2. Climate
The major climatic factor which influences plant growth was rainfall. It accordances with the amount of water could be sullied for plant. Temperature was also very essential for forage management. It linked to the rate of photosynthesis from the land for the growth. Lembang has a tropical climate that affected by the mountain temperature. The annual rainfall in Lembang was 2000-3500 mm/year. The monthly rainfall was 150-280 mm/month. The highest rainfall was on March (576.2) and the lowest was on April (106.1 mm) in 2009-2010. The maximum temperature in Lembang was 21,1oC and the lowest temperature was 19,1 oC (Table 4).
Table 4. The climate information in Lembang Sub-district
Month
Average 20.075 173.1818 20.10833 287.8333
Source : Meteorological, Climatological and Geophysical Agency (BMKG) of West Java Province, data analysis
(-) no rainfall
4.1.3. Topography
elevation and slope in the range of 0-8% to >45% (Table 5) and the height ranging from 950-1750 meter above the sea level.
Table 5. Elevation level in Lembang Sub-district
Elevation level Total Area (Ha)
0-8% 1.530 15-25% 5.201
>45% 2.970 Source : West Bandung District in Figure (2007)
4.2 The Model for Forage Sustainability in Lembang Sub-district area 4.2.1 Stakeholder Identification
Stakeholder identification was conducted in identifying the related stakeholder who has the direct or indirect stake in an organization, because it affected or be affected by the organization's actions, objectives, and policies on forage sustainability in Lembang. There were four groups of stakeholder found; Dairy Farmers, North Dairy Farm Coop (KPSBU), Animal Services of West Bandung District and Perum Perhutani.
4.2.1.1. Dairy Farmers
It could be found many dairy farmers in Lembang, regarding the suitable of ecological characteristic for developing the dairy farming. The farmers were divided into four groups; The non land-forage farmers (FNL), Renting land forage Farmers (FRA), Sharing land area farmers with perhutani (FSL), Owned land for forage farmers (FOL). It was noted, all the farmers as the members of KPSBU. Proportion and segmentation of dairy farmers can be seen on Table 6. Table 6. The amount of respondents based on land availability for foraging
Farmers segmentation Respondents (Ppl)
The non land-forage farmers (FNL) 17
Renting land forage Farmers (FRA) 14
Sharing land area farmers with perhutani (FSL) Owned land for forage farmers (FOL)
28 19
Total 78 Source : The Proportion Analysis
their dairy cattle. Renting land forage Farmers (FRA) is defined as the farmers who have their own money to rent some area for planting forage. The rent area was gotten from tanah carik (land belongs to the village admission) or from the company who borrowed their land to the farmers. They spent every year as its compensation. Farmers, who have sharing land area with Perhutani (FSL) were the farmers who have the land for foraging provided by the land of Perhutani in forest. They were planting forage beneath the trees in the forest. The last segmentation was owned land for forage farmers (FOL). They have more land for foraging, either in their backyard, or some place in Lembang Sub-district. Forage availability was also depending on how many areas that the farmers have for foraging (Table 7).
Table 7. The amount of respondents area for foraging
Farmer Segmentation The average of land area (m2)
The non land-forage farmers (FNL) -
Renting land forage Farmers (FRA) ±2341.66 Sharing land area farmers with perhutani (FSL)
Owned land for forage farmers (FOL)
±5153.14 ±1983.68 Source : Interview analysis
Land availability was linked to the amount of dairy cattle population in Lembang. In 2010 it recorded the annual amount of dairy cattle population was 22.026 heads (KPSBU 2010). It was known that the average of respondents had the 1-5 dairy cattle (75.07%), 5-10 dairy cattle (19.10%) and >10 head (5.83%). Based on this analysis, it was concluded that the dairy farming in Lembang as the conventional enterprise. As Yusdja (2005) affirmed that the conventional dairy farming has only no more than 10 dairy cattle.
4.2.1.2. The North Dairy Coop (KPSBU)