COMPARISON ON ACCURACY OF LOGISTIC, GOMPERTZ AND
VON BERTALANFFY MODELS IN PREDICTING GROWTH OF NEW BORN CALF
UNTIL FIRST MATING OF HOLSTEIN FRIESIAN HEIFERS
L. Budimulyati S.1
, R.R. Noor2
, A. Saefuddin3
and C. Talib4 1
Faculty of Animal Husbandry, Padjadjaran University, Bandung Jl. Raya Bandung Sumedang KM 21 jatinangor, Sumedang 45363 - Indonesia
2
Department of Science and Technology of Animal Production, Faculty of Animal Husbandry, Bogor Agriculture University,
Jl. Agatis, Darmaga Campus, Bogor - Indonesia 3
Department of Statistic, Faculty of Mathematics and Science, Bogor Agriculture University, Jl. Meranti, Darmaga Campus, Bogor 16680 - Indonesia
4
Center for Livestock Research and Development, Jl. Raya Padjadjaran, Bogor 16151 - Indonesia.
Corresponding E-mail: [email protected]
Received July 12, 2012; Accepted August 29, 2012
ABSTRAK
Catatanbobot badan1221 sapi yang digunakan dalam penelitian ini dikumpulkan dari PT Taurus Dairy Farm Sukabumi dari tahun 2001 sampai 2011. Catatan yang dapat digunakan untuk analisis adalah 373 dari 1221 sapi, yang mempunyai data dari lahir sampai masa kawin pertama. Tiga model yang berbeda yaitu, Logistic, Gompertz, dan von Bertalanffy dilakukan untuk menganalisis laju pertumbuhan sapi. Hasil penelitian menunjukkan bahwa tiga model memiliki akurasi yang berbeda dan sangat tergantung pada umur, lingkungan dan lamanya pengamatan. Makin lama pengamatan ternyata bobot dewasa (A) makin besar, demikian juga dengan umur dan bobot pubertas. Model Gompertz merupakan model yang paling mudah dalam proses penghitungan, sedangkan model Logistic merupakan model yang lebih sulit. Semua modelmenunjukkan akurasi yang tinggi dengan koefisien determinasi (R2) lebih dari 90%. Model Gompertz dan Logistic dapat direkomendasikan untuk memprediksi kecepatan atau laju pertumbuhan saat pubertas
Kata kunci: kurva pertumbuhan, koefisien determinasi, dara, sapi perah, FH
ABSTRACT
The body weight records of 1221 heifers were used in this study collected from PT Taurus Dairy Farm Sukabumi from year 2001 until 2011. The records that could be used for analysis were 373 out of 1221 heifers, having completed data from birth to first mating period. Three different models i.e, Logistic, Gompertz, and von Bertalanffy were performed to analyze the growth rate of heifers. The results showed that the three models had different accuracy and heavily depend on age, environment and duration of recording. The body weights of sexual maturity and on certain ages were affected by the duration of recording. The Gompertz model was performed as the simpliest model in form of calculation. On the other hand, the Logistic was more difficult to calculate. All models indicated high accuracy with the determination coefficient (R2) more than 90%. Based on the comparison, the Gompertz and Logistic model are recommended for predicting the growth rate of heifers from birth to sexual maturity.
Keywords: growth curves, determination coefficient, Holstein, heifers
INTRODUCTION
The low national milk production is a major constraint in meeting the consumers demand
dairy cattle population in Indonesia. Unavailability of replacement cow is due to many farmers do not want to maintain the calf to be profit bred, because of less profit.
A good quality of replacement stock can be produced from the genetically proven sire and dam. A major constraint occured in dairy farmer is the delay in the first conception because the heifer fails to reach good body weight for the rating. The good body weight for the first conception is 300-325 kg for Holstein cows. The achievement of this first mating weight is determined by the growth of the calf and the growth from calf to heifer and it is influenced by the genetic merit, feed intake, and rearing management. Another consideration is that the record of the identification of all dairy cows born on each farm is generally incomplete. In addition, until now there is still no standard for optimum growth of the dairy calf in Indonesia making the farmer is so difficult to determine compliance breeder calf condition at or below the minimum threshold body weight at a certain age in order to achieve the expected weight of the first mating.
Analysis of the growth curve is often associated with body weight gain in a particular age range. Based on the basic theory, the growth is divided into two distinct phases. The phase is positive, namely phase with growth rate (slope) and the second is negative slope. The transition point from these two different stages will be obtained at the inflection point of a growth curve slope. Determination of the transition point requires the appropriate model, because the conventional models using only the linear regression calculations are not able to explain the phenomena (Brody, 1945).
Bertalanffy (Brown et al., 1976). The
consideration of the three models chosen among others is based on the evident from previous studies that the three growth models are excellent for use in longitudinal quantitative data from the
different types of livestock, animals, and plants and even the models are very good for analyzing the growth patterns of rumen bacteria/ microorganisms. However, the general weakness of the three models is the models need the circumstances for industrial-scale dairy farm. The farm used in the study is the PT Taurus Dairy Farm, Sukabumi from 2001 to 2011. The heifers that had the complete records from birth to the first conception were only 373 heads.
The analysis of growth curves used is non-linear growth curve with the model of von Bertalanffy, Logistic, and Gompertz. The form of mathematical equations and some of the rules is presented in Table 1.
Biological Interpretation of Growth Curve Parameters
Fitzhugh (1976) provided an explanation of the biological interpretation of parameters in the growth curve as follows:
A: The asymptote is a value for t à
∞
; in general it can be interpreted as the averagebody
weight when the animals reach their mature body weight regardless of the fluctuations due to the environmental factors.
Ut: Represents the proportion of body weight compared to the mature body weight at the age.
B: The scale parameter (constant of integration) is used to describe the relationship Y0
(initial weight) with t especially for the model of Brody, but for the other model it only serves as an integral constant.
k: A parameter which indicates the average rate of growth to mature weight. The animals with large k value tend to have the weight of early maturity (quickly reach mature weight).
t: Age of cattle in a unit time.
as a determinant of the shape of the curve to help determining the inflection point.
Determination ofInflectionPoint
Inflection point is a maximum point of growth in body weight. At that point there is a shift change showing the acceleration of the growth becomes slow down in growth. At that point the animals reach their puberty (Brody, 1945). The inflection point reached is the most economical moment of the cattle, because at the time the livestock mortality rate is the its lowest and has the most rapid growth. The determination of the inflection point is biologically difficult to determine. However, with the help of non-linear growth curve of these problems could be solved.
The value of parameter M in the growth curve is crucial in the determination of the inflection point. Brody model with a value of M = 1 has no inflection point, while the curve of von Bertalanffy and Gompertz models have a fixed inflection point. However, it was less acceptable to the Nedler (1961) which had a value of M (which also contained in the model of Richard) in
the form of number. The number was different for each individual or each population and was more acceptable than biological term. The inflection time and weight for the various models of the growth curve are presented in Table 2.
Computer Program
The basic principle of parameter estimation process iteration is to obtain the least squares residual from some combination of the beginning of the determined value and the value should be based on previous studies (Ismail et al., 2003). The process terminated when the means squares remaining on the next iteration of the process is converge. The computer program is needed to estimate the parameters in nonlinear models. SAS 9.2 (2004) provides a specific program to search for non-linear parameters in the model by using the procedure NLIN (Non Linear).
Partialderivative ofModelParameter
The Marquardt method is used in the iteration process requiring the partial reduction of the expected parameters. The partial derivatives of each non-linear growth curve models used are shown in Table 3.
IterationProcess
The iteration process performed in this study used a maximum of 100 times the initial value of the parameter (starting value) and the value has a range with the same accuracy for each model. Thus, the ratio of the number of iterations of each model can be performed without bias. The method used is iterative Marquardt method which requires a partial reduction of the growth curve parameters (Table 3) while the convergence criteria used do not do the resettings.
Table 1. Mathematical Model of Growth Curve
Model Equation M Ut References
Logistic Y= A (1+e-kt)-M - (1+e-kt)-M Brown et al. (1976)
Gompertz Y= A exp (-Be-kt)
∞
exp (-Be-kt) Blasco et al. (2002)Von Bertalanffy Y= A (1-Be-kt)3 3 (1-Be-kt)3 Brown et al. (1976)
A = body weight (asymptotic), namely the value of t approaches infinity; B = scale parameter (the value of integral constant); e = logarithm base (2.718282); k = the average rate of growth of the body until the animal reaches body maturity; M = value of the function in the search for the inflection point (curve shape); Ut = Ya = proportion of mature animals compared to mature weight: t = time in units of the month
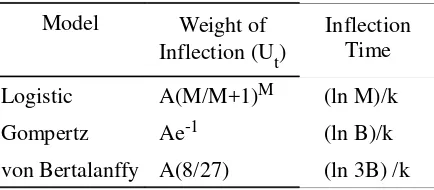
Table 2. Table 2. Inflection Point on the Non Linear Growth Curve Models
Model Weight of
Inflection(Ut)
Inflection Time
Logistic A(M/M+1)M (ln M)/k
Gompertz Ae-1 (ln B)/k
Comparison ofNon-Linear Methods
The comparison of non-linear growth model based on two criteria is namely the simply of calculation and accuracy in the depiction of the field data. The parameters used to evaluate the criteria are:
1. Number ofiteration
The more iterations performed means that the model is more difficult to achieve convergence.
2. Coefficientof determination
The coefficient of determination is coefficient that describes the variation of field data and the coefficient can be explained by a model. The formula of determination coefficient is derived from the processing of SAS 9.2 Proc NLIN program, as follows:
where R2 = coefficient of determination (%); RSS = Residual of Sum Squares; CTSS = Corrected Total Sum of Squares.
RESULTSANDDISCUSSION
The result of the analysis of the growth curve from birth until ready to be mated, age and weight at inflection point HF dairy cows using growth curve model of Logistic, Gompertz, and von Bertallanfy are presented in Table 4. The mature weight in the Logistic curve model equations is lower than in the Gompertz and von Bertallanfy. This result is consistent with research Suparyanto (1999) that the von Bertalanffy model had a value estimate for low birth weight lambs, but it would eventually be achieved the mature weight estimated larger. The other models have a birth weight prediction that is relatively higher, but estimation of mature weight tends to be smaller than the von Bertalanffy model.
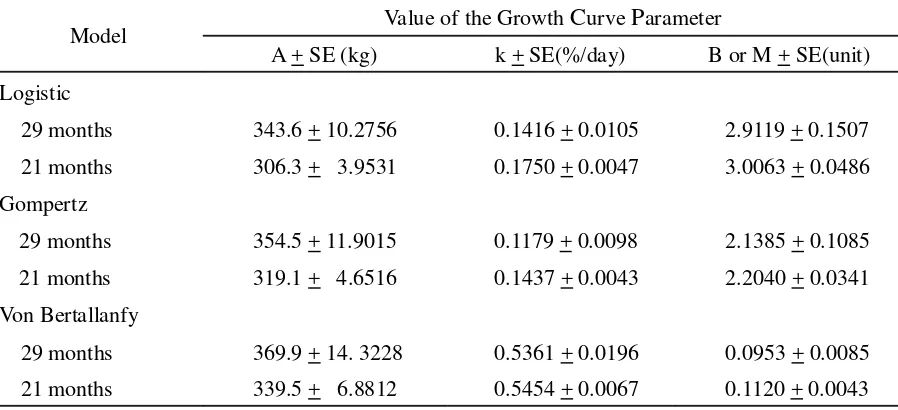
The larger value of the A parameter (mature weight) was at 29 and 21 months of recording estimated by using a model of von Bertalanffy (369.9 kg and 339.5 kg) followed by Gompertz models (354.5 kg and 319.1 kg) and Logistic (343.6 and 306.3 kg). The highest value for the B parameter (the coefficient of integration or the proportion of mature weight achieved after birth) is showed by the Logistic model and followed by Gompertz and von Bertalanffy. In addition the k values (the average rate of mature weight) are the largest and followed by the Logistic model of Gompertz and von Bertallanfy. If these models are equally considered then, the mature weight associated with the growth rate in dairy cows HF is higher (0.118 vs 0.144) and average mature weight is lower (356 kg vs 321.6 kg) when compared to the Jersey cows rised in the USA at 0.084 and the average mature weight is 421.8 kg (Brown et al., 1976). Maharani et al. (2001) reported that the growth of Brahman cross cattle is lower, which is 0.098 for the value of growth rate and 313.11 kg for mature weight. This shows that HF dairy cows have ability to achieve mature weight faster.
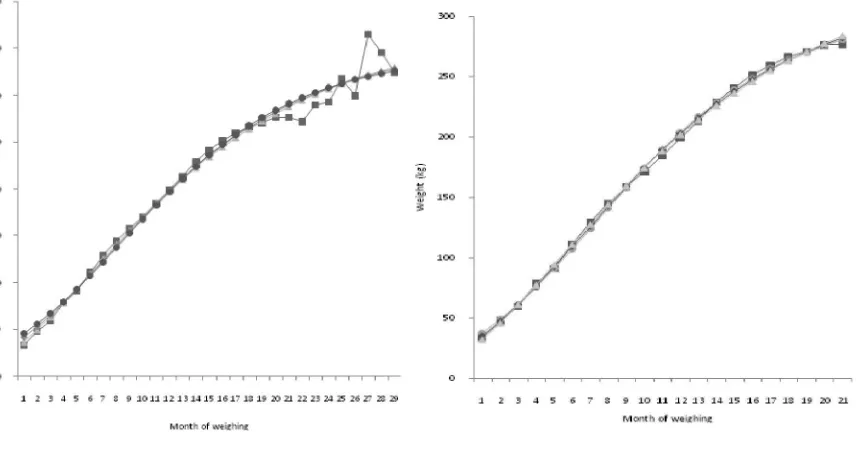
The growth curve generally show sigmoid pattern (Figure 1) which reflects the growth of livestock from the beginning of calving period, then the acceleration phase until reaches the point of inflection, and at last the animal reachs the mature weight. On last phase, the growth rate is slow down and after that the growth is relatively constant. In relation to that growth curve there is an important point, namely the turning point when the animal reached puberty, namely inflection point. The result of this study show that using the model of von Bertalanffy attained age of puberty Table 3. Partially Derivative Models of Logistic,
Gompertz, and von Bertalanffy
PartiallyofParameters
Logistic Y= A (1+e-kt)-M
dY/dA (1+e-kt)-M
dY/dk A M k(1+e-kt)-(M+1)(e-kt)
dY/dM (-A)(ln(1+e-kt)-(M+1))((1+e-kt)-M)
Gompertz Y= A exp (-Be-kt)
dY/dA exp(-Be-kt)
dY/dB -A exp(-Be-kt)(e-kt)
dY/dk A b t exp(-Be-kt)(e-kt)
von Bertalanffy Y= A (1-Be-kt)3
dY/dA (1-Be-kt)3
dY/dB -3 A e-kt
younger than the Gompertz and Logistic models. The age of puberty for 29 months and 21 months recording on the model of von Bertalanffy
achieved at the age of 4.98 months and 4.39 months with the body weight of 109.60 kg and 100.59 kg respectively. On the Gompertz model Table 4. Equation
M
odel of the Growth Curve of Dairy Cow from Birth to Matingof HF, Age and Weight at PubertyModel Equation t(i) (months) Y(i) (kg)
Logistic Y= A (1+e-kt)-M
29months Y= 343.6 (1+e-0.1416t)-2.9119 7.5481 145.4503
21 months Y= 306.3 (1+e-0.1750t)-3.0063 6.2898 129.1897
Gompertz Y= A exp (-Be-kt)
29 months Y= 354.5 exp (-2.1385e-0.1179t) 6.4470 130.4133
21 months Y= 319.1 exp (-2.2040e-0.1437t) 5.4995 117.3903
Von Bertallanfy Y= A (1-Be-kt)3
29 months Y= 369.9 (1-0.5361e-0.0953t)3 4.9861 109.6000
21 months Y= 339.5 (1-0.5454e-0.1120t)3 4.3962 100.5926
puberty age is achieved at the age of 6.45 months and 5.50 months with the body weight of 130.41 kg and 117.39 kg while the Logistic models achieved at the age of 7.54 months and 6.29 months with a body weight of 145.45 and 129.19 kg. Puberty of FH cows occurred at the age of 8-12 months (Folley etal., 1973).
The age and weight at puberty estimated by three models show difference. The Logistic model is closer to estimate the age and weight at puberty and followed by the model of Gompertz while von Bertalanffy model shows underestimate to estimate criteria the puberty age and weight.
The body weight at the time of the inflection point is affected by factor that also affects the mature weight (A), as the body weight at the inflection obtained by multiplying the percentage of adults at the inflection point (ti) with mature weight (A). Age at the time of the growth inflection point is the most economical point on the cattle management. The inflection point indicates several things (1) the presence of maximum growth of livestock. (2) age at puberty. (3) the lowest point in mortality. and (4) the point can be used in the determination of geometric compared to the same models on Sumatra sheep and its cross using population data, as well as studies conducted by Inounu et al. (2007). They reported that the model of von Bertallanfy is the most difficult to achieve convergence criteria and followed by the model of the Logistic and Gompertz
Another study conducted by DeTorre et al. (1992) compared the model of the von Bertalanffy to Richards as well as the Brody model based on the individual data of Retinta cattle indicated that the model of von Bertalanffy and Richards and correlation value among growth curve parameters in the calculations such as the correlation between the b and M values on Richard models. Such condition caused the model is the most difficult to achieve convergence in addition to the four parameters (Fitzhugh, 1976). The correlation value in the counting process is a meanly mathematical value compared to the biological value especially when using population data. The value of individual growth curve must be considered to give more biological meaning.
The cause of the longer iteration process on Logistic model is likely due to the negative correlation values relatively smaller compared to other models of mature weight (A) and growth rate to mature weight (k) as shown in Table 6. The difficulties occurred on the Logistic model could be due to incompatibility of the growth process of HF bovine to estimate the growth curve parameter (compared to the Gompertz and von Bertalanffy) with interpretation the Logistic model to determine the growth curve parameters, especially the mature weight (A) and growth rate to mature weight (k).The correlation value in this study are different from the result obtain by Suparyanto et al. (2001) and Subandriyo et al. (2000). This difference is possible because of difference in species that caused difference in the growth process (Carrijo and Duarte, 1999).
Comparison between the Model Parameter in the Estimation of the Growth Curve
The results show that the von Bertalanffy models tend to give higher estimation of the
Table 5.
The Number ofIterationsfor the Modelsmature weight value (A) followed by Gompertz and Logistic models (Table 7). Parameter estimation of the growth rate to mature weight (k) model estimates of the growth curve shows the opposite result. The von Bertalanffy model tends to be underestimated when compared to the Gompertz and Logistic models.
The patterns are probably difference that is due to the correlation in the calculation of the
parameter A by k. The difference in growth curve parameters do not reduce the biologically interpretation. A result with a similar pattern was also obtained Suparyanto et al. (2001). They reported that von Bertalanffy model tended to give a higher estimation of the parameters of mature weight (A) and a lower estimation of the parameter to the weighted average of growth rate of adult (k). A similar result was also reported by Table 6. Correlation Value between the Parameters of Models
Model Parameter
V
alueA*k A*B B*k A*M M*k
Logistic
29 months -0.8694 -0.3098 0.6521
21 months -0.9017 -0.2778 0.5921
Gompertz
29 months -0.8974 -0.3738 0.6792
21 months -0.9230 -0.3276 0.6110
Von Bertallanfy
29 months -0.9311 -0.3942 0.6415
21 months -0.9520 -0.3217 0.5469
Table 7. Value of the Growth Curve Parameter
Model Value ofthe Growth
C
urveP
arameterA + SE (kg) k + SE(%/day) B or M + SE(unit)
Logistic
29 months 343.6 + 10.2756 0.1416 + 0.0105 2.9119 + 0.1507
21 months 306.3 + 3.9531 0.1750 + 0.0047 3.0063 + 0.0486
Gompertz
29 months 354.5 + 11.9015 0.1179 + 0.0098 2.1385 + 0.1085
21 months 319.1 + 4.6516 0.1437 + 0.0043 2.2040 + 0.0341
Von Bertallanfy
29 months 369.9 + 14. 3228 0.5361 + 0.0196 0.0953 + 0.0085
21 months 339.5 + 6.8812 0.5454 + 0.0067 0.1120 + 0.0043
Brown etal. (1976).
The difference in estimation of real growth curve parameter was also reported by several researchers including Denise and Brinks (1985) using the Richards and Brody model in cattle and Brown etal. (1976) reported on five models of the growth curve. Most of this study gave a similar result. Differences in comparison to the models could be influenced by several physiological and metabolic assumptions used (Brody, 1945).
The estimation result of non linear models in this study shows a similar result (Table 5). The Logistic model that has higher degree of difficulty in achievement the convergence criteria tends to have a lower value than the other models in which parameter has the same interpretation (A and k). The other parameters in the integral constant value (B) can not be used as a reference because there is a difference in interpretation and parameter value.
The accuracy comparison of the models in the explaining that data field can be done by evaluating the overall differences between the data fields and data generated by the growth curve model parameters. This comparison can be done using the deviation parameter from the whole data as the coefficient of determination.
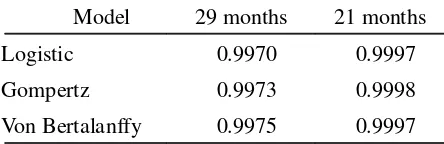
The comparison was performed using the age variable on last weighing because determination coefficient is highly influenced by recent records weighing. Based on the level of accuracy of the model parameters using the whole records, show that there is no difference in the coefficient of determination.Although the von Bertalanffy model tends to have a higher level of accuracy in the recording of 29 months, but the 21 months recording Gompertz model has a higher coefficient of determination value (Table 8). The result is in accordance with the result obtained by Suparyanto et al. (2001) who concluded that the model of von Bertalanffy had the largest coefficient of determination based on the data
from the Sumatra sheep population and its cross, as well as research results Susilawati (2010) that the model of Gompertz demonstrates more accurate for estimation the mature weight and the weight at puberty than logistic model. A similar result was also reported by Mazzini etal. (2003) that compared the models of Brody, Logistic, Gompertz, Richadrs and von Bertalanffy in Hereford bulls. They found that the von Bertalanffy model was the best model within the accuracy of the explanation of the actual data. Deviation between the simulated and field data from birth to 29 months of all models performs an underestimate value at the beginning of growth. Whereas for the 21 months recording data, the von Bertalanffy model is overestimate, but the Logistic and Gompertz models are underestimate. The Von Bertalanffy is the closest model to the data field on the record up to 29 months whereas for 21 months recording the Gompertz model estimation is close to the field data.
Deviation age of maturity is also experiencing a large deviation. The von Bertalanffy models tends to have the smallest deviation for the recording of 29 months and 21 months for the data recording and Logistic models are close to the data field. However for of the data of middle growth period, the Gompertz and Logistic growth models tend to be more accurate in the depiction of the field data.
Comparison of the accuracy of the model can also be done based on the deviation between the data field with the estimation of the model at different ages to see the trend deviation of each model in the depiction of the field data (Figure 2). Deviation between the simulated data and field data from birth to 29 months on all models shows an underestimate starting at the beginning of growth period, whereas the deviation of 21 months recording of von Bertalanffy model is overestimate and the Logistic and Gompertz model is underestimate. The von Bertalanffy model is the model that closest to the data field to record up to 29 months, whereas for 21 months recording the Gompertz model of approaching the data field. Deviation at the age of maturity is also experiencing estimation approach that is too large and von Bertalanffy models tend to have the smallest deviation for the recording of 29 months and 21 months for recording Logistic models are close to the data field. However, for the data of middle growth, the Gompertz and Logistic growth models tend to be more accurate in the depiction of the data field.
Table 8.
Value of Determination Coefficient (R2) on the ModelsModel 29 months 21 months
Logistic 0.9970 0.9997
Gompertz 0.9973 0.9998
The results obtained indicate that the growth curve models have the different levels of accuracy depending on the environment and the age or length of recording period. The longer the recording turned out to the larger mature weight (A) as well as age and weight of puberty.
CONCLUSION
The Gompertz model is the simpliest model in the estimation process, while the Logistic model is more difficult in the computing process. The three non-linear mathematical models used in this study have high degree of accuracy with the value of the coefficient of determination (R2) is more than 90%. The Gompertz and Logistic models can be recommended to predict the growth rate during puberty period.
REFERENCES
Blasco, A., M. Piles and L. Varona. 2003. A Bayesian analysis of the effect of selection for growth rate on growth curves in rabbits. Genet. Sel Evol. 35:21-41
Brody, S. 1945. Reprinted 1974. Bioenergetics and Growth : With Special Reference to the Efficiency Complex in Domestic Animals. Hafner Press. A Division or Macmillan Publishing Co, Inc. New York. p 489-493,
498, 502.
Brown, J.E., H.A. Fitzhugh Jr. and T.C. Cartwright. 1976. A Comparison of nonlinear models for desecribing weight-age relationship in cattle. J. Anim. Sci. 42:810-818.
Carrijo, S.M. and F.A.M. Duarte. 1999. Description and comparison of growth parameters in Chianina and Nellore cattle breeds. Gen. Mol. Biol. 22: 187-196.
DeNise, R.S.K. and J.S. Brinks. 1985. Genetic and environmental aspects of the growth curve parameters in beef cows. J. Anim. Sci. 61: 1431-1440.
DeTorre, L., G. Candotti, A. Reverter, M.M. Bellido, P. Vasco, L.J. Garcia and J.S. Brinks. 1992. Effects of growth curve parameters on cow efficiency. J. Anim. Sci. 70: 2668-2672.
Direktorat Jenderal Peternakan. 2001. Statistik Peternakan. Direktorat Jenderal Peternakan Departemen Pertanian.
Fitzhugh Jr, H.A. 1976. Analysis of growth curves and strategies for altering their shape. J. Anim. Sci 42(4): 1036-1051
Foley, R., D.L. Bath, F.N Dickinson and H.A.Tucker 1973. Dairy Cattle Principles, Practices, Problems Profits. Lea & Febriger. Philadelphia.
Subandriyo. 2007. Analisis kurva
pertumbuhan domba Garut dan
persilangannya. JITV. 12(4):286-299
Ismail, Z., A. Khamis, and M.Y. Jaafar. 2003. Fitting nonlinear Gompertz curve to tobacco growth data. Pak. J. Agron. 2(4):233-236. Maharani, H, M. Astuti and Sumadi. 2001.
Evaluasi Penerapan Model Matematik Non linier dalam Memprediksi Laju Pertumbuhan Sapi Brahman Cross di PT Buli. Agrosains, 14(3):339-346
Mazzini, A.R.A, J.A. Muniz, L.H.D. Aquino and F.F.E. Silva. 2003. Growth Curve Analysis For Hereford Cattle Males. Cienc. Agrotec. Lav. J. A. Ras. 27: 1105-1112.
Nedler, J.A. 1961. The fitting of generalization of logistic curve. Biometrics. 17:89.
Place, NT, A.J. Heinrichs and H.N. Erb. 1998. The effects of disease, management, and nutrition on average daily gain of dairy heifer from birth to four months. J. Dairy. Sci. 81:1004- 1009.
PSPK2011. 2011. Hasil Rilis Terakhir Sensus Peternakan di Indonesia. Biro Pusat Statistik. Jakarta.
SAS (Statistical Analysis System). 2004. SAS 9.1 SQL Procedure User’s Guide SAS Institute Inc. Technical Support Division, SAS
Campus Drive, Cary, NC 27513
Sejrsen, K and S. Purup. 1997. Influence of prepubertal feeding level on milk yield potential of dairy heifers: A Review. J. Dairy. Sci. 75: 828 – 835.
Subandriyo, B. Setiadi, E. Handiwirawan and A. Suparyanto. 2000. Performa domba Komposit hasil persilangan antara domba lokal Sumatera dengan domba Rambut pada kondisi dikandangkan. JITV. 5(2):73-8 Suparyanto, A. 1999. Analisis kurva pertumbuhan
von Bertalanffy, Logistic dan Gompertz pada domba St. Croix (H), Sumatera (S), St. Croix x Sumatera (HS), Barbados Blackbelly x Sumatera (BC) dan Komposit (K). Tesis. Sekolah Pascasarjana Institut Pertanian Bogor.
Suparyanto, A, Subandriyo, T.R. Wiradarya and H. Martojo. 2001. Analisis Pertumbuhan Non Linier Domba Lokal Sumatera dan Persilangannya. JITV. 6(4):259-264.