ISSN: 1693-6930
accredited by DGHE (DIKTI), Decree No: 51/Dikti/Kep/2010 199
Optimal Power Flow Solution of the Algerian Electrical
Network using Differential Evolution Algorithm
Linda Slimani, Tarek Bouktir*
Department of Electrical Engineering, Setif University, Algeria e-mail: [email protected], [email protected]*
Abstrak
Makalah ini menyajikan algoritma evolusi diferensial (DE) sebagai solusi untuk masalah aliran daya optimal (OPF) pada sistem daya. Tujuan dari sistem tenaga listrik adalah untuk memberikan daya nyata untuk jumlah terbesar pengguna setiap saat pada biaya serendah mungkin. Jadi tujuannya adalah untuk meminimalkan biaya bahan bakar total dari unit-unit pembangkit dan juga menjaga kinerja sistem diterima dalam sisi batasan keluaran daya reaktif pembangkit, tegangan bus, parameter kompensator stati VAR (SVC) dan beban lebih pada jalur transmisi. Waktu komputasi CPU dapat direduksi dengan menguraikan masalah ke dalam dua sub-masalah. Sub-masalah pertama, meminimalkan biaya bahan bakar pembangkitan dan sub-masalah kedua adalah penyelesaian daya reaktif sehingga tegangan bus optimal dapat ditentukan dan mereduksi kerugian dengan mengendalikan perubahan keran dari transformator dan kompensator statis VAR (SVC). Untuk memverifikasi pendekatan yang diusulkan dan untuk tujuan perbandingan, simulasi pada jaringan Aljazair dengan 114 bus, 175 cabang (jalur dan transformer) dan 15 pembangkit. Hasil yang diperoleh menunjukkan bahwa DE adalah mudah digunakan, cepat, kuat dan merupakan teknik optimasi yang handal dibandingkan dengan metode optimasi global lainnya seperti PSO dan GA.
Kata kunci: aliran daya optimal, evolusi diferensial, FACTS, jaringan listrik Aljazair, lisrik murah
Abstract
This paper presents solution of optimal power flow (OPF) problem of a power system via differential evolution (DE) algorithm. The purpose of an electric power system is to deliver real power to the greatest number of users at the lowest possible cost all the time. So the objective is to minimize the total fuel cost of the generating units and also maintaining an acceptable system performance in terms of limits on generator reactive power outputs, bus voltages, static VAR compensator (SVC) parameters and overload in transmission lines. CPU times can be reduced by decomposing the problem in two subproblems, the first subproblem minimize the fuel cost of generation and the second subproblem is a reactive power dispatch so optimum bus voltages can be determined and reduce the losses by controlling tap changes of the transformers and the static VAR compensators (SVC). To verify the proposed approach and for comparison purposes, we perform simulations on the Algerian network with 114 buses, 175 branches (lines and transformers) and 15 generators. The obtained results indicate that DE is an easy to use, fast, robust and powerful optimization technique compared to the other global optimization methods such as PSO and GA.
Keywords: economic power, optimal power flow, differential evolution, FACTS, Algerian network
1. Introduction
equipment. The optimal power flow has been frequently solved using classical optimization methods. Effective optimal power flow is limited by (i) the high dimensionality of power systems and (ii) the incomplete domain dependent knowledge of power system engineers [1-3].
In recent years, energy, environment, deregulation of power utilities have delayed the construction of both generation facilities and new transmission lines. Better utilization of existing power system capacities by installing flexible AC transmission systems FACTS devices has become imperative. The application of flexible alternative current transmission systems (FACTS) in electric power system, such as thyristor controlled series compensations (TCSC), thyristor controlled phase angle regulators (TCPR), unified power flow controllers (UPFC) and static VAR compensator (SVC), is intended for the control of power flow, improvement of stability, voltage profile management, power factor correction, loss minimization, and reduced cost of production. The OPF becomes even more complex when FACTS devices are taken into consideration as control variables.
It can be seen that the generalised OPF is a non-linear, no-convex, large-scale, static optimization problem with both continuous and discrete control variables. Applications of conventional optimisation techniques such as the gradient-based algorithms are not good enough to solve this problem. Because it depends on the existence of the first and the second derivatives of the objective function and on the well computing of these derivative in large search space.
A new floating point encoded evolutionary algorithm for global optimization and named it differential evolution (DE) was proposed by Storn and Price [4], and since then the DE algorithm has been used in many practical cases. The original DE was modified, and many new versions proposed. Generally DE is characterized as a simple heuristic of well-balanced mechanism with flexibility to enhance and adapt to both global and local exploration abilities. The effectiveness, efficiency and robustness of the DE algorithm are sensitive to the settings of the control parameters. The best settings for the control parameters depend on the function and requirements for consumption time and accuracy. It has gained a lot of attention in various power system applications. It is a population based method and an improved version of GA using similar operators: mutation, crossover and selection. The main difference in constructing better solutions is that GA relies on crossover while DE relies on mutation operation. The mutation operation is used as a search mechanism, which is based on the differences of randomly sampled pairs of solutions in the population. The algorithm uses selection operation to direct the search towards the prospective regions in the search space [5].
This paper proposes a simple approach based on DE algorithm implemented in C++ Builder to minimize the total fuel cost of the thermal generating units and also maintaining an acceptable system performance in terms of limits on generator reactive power outputs, bus voltages, static VAR compensator (SVC) parameters and overload in transmission lines. CPU times can be reduced by decomposing the problem in two subproblems, the first subproblem minimize the fuel cost of generation and the second subproblem is a reactive power dispatch so optimum bus voltages can be determined and reduce the losses by controlling tap ratio of the transformers and the static VAR compensators (SVC).
To verify the proposed approach and for comparison purposes, we perform simulations on the Algerian network with 114 buses, 175 branches (lines and transformers) and 15 generators. The obtained results indicate that ED is an easy to use, fast, robust and powerful optimization technique compared to other global optimization methods such as PSO, and GA.
2. Problem Formulation
In OPF, the generators are modelled as voltage controlled buses and loads as load buses. One generator serves as the slack bus. The standard OPF problem can be formulated as a constrained optimisation problem as follows:
min ( , )
. . ( , ) 0
( , ) 0 f x u s t g x u
h x u
= ≤
(1)
voltage and angle of load buses and u is the vector of the control variables such as generator real power Pg, generator voltages Vg, transformer tap setting T, and the reactance of dynamic shunt capacitors/reactors BS V C . Therefore, u can be expressed as
[
g, g, , SVC]
Tu = P V t B (2)
2.1. Objective Function
The Optimal power flow problem with consideration of FACTS devices can be decomposed in two sub-problems which are the Economic power Dispatch and the Reactive Power Flow combined with FACTS devices.
2.1.1. Economic Objective Function
The essence of the optimal power flow problem resides in reducing the objective function and simultaneously satisfying the load flow equations (equality constraints) without violating the inequality constraints
The most commonly used objective in the OPF problem formulation is the minimisation of the total operation cost of the fuel consumed for producing electric power within a schedule time interval (one hour). The individual costs of each generating unit are assumed to be function, only, of real power generation and are represented by quadratic curves of second order. The objective function for the entire power system can then be expressed as the sum of the quadratic cost model at each generator [6], [7].
( )
(
2)
1 ng
ec i i i i i
i
F x α βPg γ Pg
=
= ∑ + + $/h (3)
where αi, βi and γi are the cost coefficients of generator at bus i.
2.1.1.1. Active Power Transmission Losses and Voltage Deviation Objective Function The objective is to minimise the active power losses in the transmission network and/or the voltage deviations at the load buses involving reactive power controls, while fixing active power controls.
The tap changers of the transformers and SVC can control the reactive power flow so optimum bus voltages can be determined and reduce the losses. The shunt FACTS device should be placed on the most sensitive buses. The insertion of SVC enhances the voltages at various buses, and reduction power loss of the system. For SVC, it can provide reactive power and voltage support. As a result, the reactive power generation of SVC becomes one of the control variables. One of the important indices of power system security is the bus voltage magnitude. The voltage magnitude deviation from the desired value at each load bus must be as small as possible.
(i) The active power transmission losses (Ploss) is given by:
(
)
2 21
2 cos
l N
loss k k i j k i j ij
k
P g t V V t V V θ
=
= ∑ + − (4)
where Nl is number of branch on the network, t equal =1 if the branch is a transmission line and t equal the tap ratio value if the branch is a transformer, k is a branch with conductance g connecting the ith bus to the jth bus.
(ii) The deviation of voltage is given as follows:
1
PQ N
des
k k
k
V V V
=
∆ = ∑ − (5)
where NPQ is the number of load buses and des k
V is the desired or target value of the voltage magnitude at load bus k.
The equation of the total objective function using into account the Economic Power Dispatch (ED) objective function; active power transmission losses (Ploss); and the sum of the normalized violations of voltages (FVi) is as follow:
ED l loss V V
f =F +ωP +ω F (6)
where
(
lim) (
max min)
1
PQ N
V PQj PQj PQj PQj
j
F V V V V
=
= ∑ − −
l
ω and ωV constants are related to line loss and voltage deviation. These constants were found as a result of trials.
2.1.2. Types of Equality Constraints
While minimising the objective function, it is necessary to make sure that the generation still supplies the load demands plus losses in transmission lines. The equality constraints are the power flow equations describing bus injected active and reactive may be defined as follows:
(
)
1
cos sin
nb
i i i i j ij ij ij ij
j
P Pg Pd V V g q b q
=
= - =
å
+ (7)(
)
1
sin cos
nb
i i i i j ij ij ij ij
j
Q Qg Qd V V g q b q
=
= - =
å
- (8)where P gi ,Q gi are the active and reactive power generation at bus i; P di, Q di are the real
and reactive power demands at bus i; Vi, Vj, the voltage magnitude at bus i,j, respectively;qij is the admittance angle, bij and gij are the real and imaginary part of the admittance and nb is
the total number of buses. The equality constraints are satisfied by running Newton-Raphson algorithm.
2.1.3. Types of Inequality Constraints
The inequality constraints of the OPF reflect the limits on physical devices in the power system as well as the limits created to ensure system security. The most usual types of inequality constraints are upper bus voltage limits at generations and load buses, lower bus voltage limits at load buses, var. limits at generation buses, maximum active power limits corresponding to lower limits at some generators, maximum line loading limits and limits on transformer tap setting. The inequality constraints on the problem variables considered include: (1) upper and lower bounds on the active generations at generator buses Pgi
min≤
Pgi≤ Pgi max
, i= 1, ng, (2) upper and lower bounds on the reactive power generations at generator buses Qgimin≤Qgi≤Qgimax , i = 1, ng, (3)upper and lower bounds on reactive power injection at buses with VAR compensation Qci
min≤
Qci≤ Qci max
, i=1, nc, (4)Upper and lower bounds on the voltage magnitude at the all buses. Vimin≤ Vi ≤ Vimax , i=1, nb, (5) upper and lower bounds on the bus voltage phase angles θιµιν≤ θι ≤ θιµαξ , i = 1, nb; and (6) for secure operation, the transmission line loading Sl is restricted by its upper limit as:Sli≤ Sli
max
, i = 1, nl, where Sli, Sli max
are stand for the power of transmission line and limit of transfer capacity of transmission line and nl is the number of transmission lines.
The constraints on the state variables can be taken into consideration by adding penalty function to the objective function.
2.1.4. Application of FACTS in Electric Power System
was first introduced by N. G. Hingorani [8] from the Electric power research institute (EPRI) in the USA in 1988, although the power electronic controlled devices had been used in the transmission network for many years before that.
The application of FACTS in electric power system is intended for the control of power flow, improvement of stability, voltage profile management, power factor correction, and loss minimization [9-12]. Power flow through an ac line is a function of phase angle, line and voltages and line impedance. The consequences of lack control over any of these variables are problems with stability, undesirable power flows, undesirable Var flows, higher losses, high or less voltage and among the others; with FACTS devices we can control the phase angle, the magnitude at chosen bus and line impedance.
Thyristor Controlled Series Capacitors (TCSC) and Static VAR compensators (SVC) are the most popular devices of the FACTS [13]. The main functionality of the SVC is to regulate the voltage at a chosen bus by controlling the reactive power injection at the location. Maintaining the rated voltage levels is important for proper operation and utilization of loads. Under voltage causes deregulation in the performance of loads such as induction motors, light bulbs, etc. Whereas over voltage causes magnetic saturation and resultant harmonic generation, as well as equipment failures due to insulation breakdown. These devices are characterized by rapid response, wide operational range and high reliability.
2.1.5. Modeling of Static VAR Compensator
Thyristor controlled Static VAR compensators (SVCs) were developed in the 1970s to act as compensation for arc furnaces, these devices are one of the earliest types of Flexible AC Transmission System (FACTS) controllers. The typical shunt connected SVC consists of thyristor controlled reactors and thyristor switched capacitors. The full continuous range of the SVC can be accessed by coordinating the switching of the discrete capacitor block and the continuous reactor controls [14].
The SVC is usually operated in a voltage regulating mode, which adjusts its susceptance to maintain the local transmission network voltage to a voltage setpoint value. The SVC can also operate in a constant MVAr mode, which maintains a fixed value of susceptance under steady state conditions. The effect of the SVC controller on the economic operation and voltage stability of the network is the principle motivation behind incorporating the SVC into various formulations. In this study, when the SVC is installed in the transmission line, it can be treated as a PV bus with the generation of real power as 0. The algebraic equation (9) gives the reactive power injected at the SVC bus i. The reactance Bsvc is locked if one of its limits is
reached.
2
/ svc
Q = B V (9)
2.2. Application of DE Algorithm on OPF Problem
Initialisation of Vectors
Difference vector based mutation
Crossover/
Recombination Selection
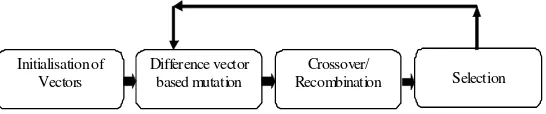
DE is a simple real parameter optimization algorithm. It works through a simple cycle of stages, presented in Figure 1.
Figure 1. Main stages of the DE algorithm
2.2.1 Differential Evolution optimization process
Differential Evolution uses a population P of size NP that evolves over G generations to reach the optimal solution. Each individual Xi is a vector that contains as many parameters as the problem decision variables D.
( ) ( ) ( )
1 , ...,
G G
G
Np
P = ëéX X ùû (10)
( ) ( ) ( )
1, , ..., , 1, ,
T
G G G
p
i i D i
X = éëX X ùû i = K N (11)
The population size NP is an algorithm control parameter selected by the user which remains constant throughout the optimization process. The optimization process in DE is carried out using the three basic operations: mutation, crossover and selection.
2.2.1.1. Initialization
At the early stage of DE search, i.e., t = 0, the algorithm starts by creating an initial population of NP vectors.
The problem independent variables are initialized somewhere in their feasible numerical range in every vector as follows.
(
)
(0) min max min
, j (0,1) j j
j i
X = X +rand ⋅ X −X
(12)
where i=1, ...,NP and
j
=
1,...,
D
;X
minj andX
maxj are the lower and upper bounds of the jthdecision parameter; and rand(0,1)is a uniformly distributed random number within [0, 1]
generated for each value of j. ,
(0)
j i
X
is the jth parameter of the ith individual of the initialpopulation.
2.2.1.2. Mutation
The mutation operator creates mutant vectors
( )
Xi' by perturbing a randomly selectedvector Xa with the difference of two other randomly selected vectors Xb and Xc
(
)
'( )G ( )G ( )G ( )G
a c
i b
X = X +F X −X i=1,...,NP (13)
where Xa Xb and Xc are randomly chosen vectors among the Np population, and
a
≠ ≠ ≠
b
c
i
. The scaling constant F is an algorithm control parameter used to adjust the perturbation size in the mutation operator and to improve algorithm convergence. Typical value of F is in the range of 0.4–1.0.2.2.1.3. Crossover
original work of Storn and Price [16], the binomial variant is much more used in recent applications.
In exponential type, the crossover operation generates trail vectors
( )
'' iX by mixing the
parameters of the mutant vectors
( )
Xi' with the target vector( )
Xi according to a selected probability distribution, ( )
≤
=
=
otherwise
X
q
j
or
C
if
X
X
G i j R j G i j G i j,
,
) ( , ' ) ( ' , " ,η
(14)where
i
=
1,...,
N
Pandj
=
1,...,
D
; q is a randomly chosen index∈
{
1,...,
N
P}
that guarantees that the trail vector gets at least one parameter from the mutant vector;η
'j is a uniformly distributed random number within [0, 1] generated for each value of j.The crossover constant CR is an algorithm parameter that controls the diversity of the population and aids the algorithm to escape from local minima. (,G),
'(,G)j i j i
X
X
andX
''(j i,G) are the jth parameter of the ith target vector, mutant vector and trail vector at generation G, respectively.2.2.1.4. Selection
To keep the population size constant over subsequent generations, the selection process is carried out to determine which one of the child and the parent will survive in the next generation.
The selection operation forms the population by choosing between the trail vectors and their predecessors (target vectors) those individuals that present a better fitness or are more optimal according to (18).
( ) ( )
P G i G i G i G i Gi i N
otherwise X X f X f if X
X , 1,...,
) ( ) ( ) "( ) "( ) ! ( = ≤ = + (15)
This process is repeated for several generations allowing individuals to improve their fitness as they explore the solution space in search of optimal values.
DE has three essential control parameters: the scaling factor (F), the crossover constant (CR) and the population size (NP). The scaling factor is a value in the range [0, 2] that controls the amount of perturbation in the mutation process. The crossover constant is a value in the range [0,1] that controls the diversity of the population. The population size determines the number of individuals in the population and provides the algorithm enough diversity to search the solution space.
Proper selection of control parameters is very important for algorithm success and performance. The optimal control parameters are problem specific. Therefore, the set of control parameters that best fit each problem have to be chosen carefully. The most common method used to select the control parameter is parameter tuning. Parameter tuning adjusts the control parameters through testing until the best settings are determined. Typically the following ranges are good initial estimates: [15]: F= [0.5, 0.6], CR= [0.75, 0.90] and NP= [3D, 8D].
In order to avoid premature convergence, F or NP should be increased, or CR should be decreased. Larger values of F result in larger perturbation and better probabilities to escape from local optima, while lower CR preserves more diversity in the population thus avoiding local optima.
2.2.2. DE Implementation for OPF
2.2.2.1. Problem Representation
Each vector in the DE population represents a candidate solution of the given problem. The elements of that solution consist of all the optimization variables of the problem. For the case of minimization of cost the generator active powers are the optimization variables. For the reactive power planning problem under consideration, generator terminal voltages
( )
Vgi the transformer tap positions (tk) and the Capacitor settings (QCi) are the optimization variables. Generator bus voltage is represented as floating point numbers, whereas the transformer tap position and reactive power generation of capacitor are represented as integers.2.2.2.2. Evaluation Function
Differential evolution searches for the optimal solution by maximizing a given fitness function, and therefore an evaluation function which provides a measure of the quality of the problem solution must be provided. The objective is to minimize the total cost while satisfying all constraints. The equality constraints are satisfied by running the Newton Raphson power flow algorithm. The inequality constraints on the control variables are taken into account in the problem representation itself, and the constraints on the state variables are taken into consideration by adding a quadratic penalty function to the objective function. With the inclusion of penalty function the new objective function becomes,
1
1 1 1
PQ
N N N
j j j
j j j
M in F f SP V P Q P L P
τ
= = =
= + +
∑
+∑
+∑
(16)Here, SP, VPj ,QPj and LPj are the penalty terms for the reference bus generator active
power limit violation, load bus voltage limit violation; reactive power generation limit violation and line flow limit violation respectively. These quantities are defined by the following equations:
SP =
(
)
(
)
2
max max
min 2 min
0
s s s s s
s s s s s
K
P
P
if P
P
K
P
P
if P
P
otherwise
−
>
−
<
(17)
VPj =
max 2 max
min 2 min
(
)
(
)
0
v j j j j
v j j j j
K V
V
if V
V
K V
V
if V
V
otherwise
−
>
−
<
(18)
QPj =
m ax 2 m ax
m in 2 m in
( )
( )
0
q j j j j
q j j j j
K Q Q if Q Q
K Q Q if Q Q
otherw ise
− >
− <
(19)
LPj =
max 2 max
(
)
0
l j j j j
K L
L
if L
L
otherwise
−
>
(20)where, Ks, Kv, Kq and Kl are the penalty factors. Since DE maximizes the fitness function, the
minimization objective function f is transformed to a fitness function to be maximized as,
Fitness =
k F
(21)3. Application Study
The OPF using DE method has been developed and implemented by the use of C++Builder2009 software, tested with Intel Pentium Dual CPU 2220, 2.4 GHz, 2GB RAM. Consistently acceptable results were observed. Initially, several runs are done with different values of DE key parameters such as differentiation (or mutation) constant F, crossover constant CR, size of population NP, and maximum number of generations GEN which is used here as a stopping criteria. In this paper, the following values are selected as: F=0.9: CR=0.9; NP=30; GEN=50. The proposed method is applied to two test systems.
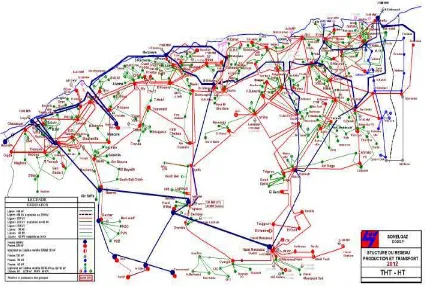
The DE-OPF has also been tested on the Algerian network. It consists of 114 buses, 15 generators, 159 transmission lines and 16 transformers (Figure 2).
Figure 2. The topologies of the Algerian network
The Table 1 shows the technical and economic parameters of 15 ten generators of the Algerian electrical network. Knowing that the generator of the bus of N°=04 is the slack bus. The voltage of generator buses and load buses in the system are between [1, 1.1] and [0.90, 1.1], respectively.
In this test, in order to reduce the CPU time because the Algerian network is relatively large, the OPF problem is decomposed in two subproblems, the first subproblem minimize the fuel cost of generation and environmental pollution and the second subproblem is a reactive power dispatch so optimum bus voltages can be determined and reduce the losses by controlling generator voltages, tap ratio of the transformers and the static VAR compensators (SVC). The comparisons of the results obtained by the proposed approach DE, with those found by GA and PSO algorithms are reported in the Table 2.
1 9 0 0 0 2 0 0 0 0 2 1 0 0 0 2 2 0 0 0 2 3 0 0 0 2 4 0 0 0 2 5 0 0 0 2 6 0 0 0
1
2
6
5
1
7
6
1
0
1
1
2
6
1
5
1
1
7
6
2
0
1
2
2
6
g e n e r a t i o n
F
u
e
l
C
o
s
t (
$
h
W o r s t S o l u t i o n A v e r a g e S o l u t i o n B e s t S o l u t i o n
0 .9 6 0 .9 8 1 1 .0 2 1 .0 4 1 .0 6 1 .0 8 1 .1 1 .1 2
4 5 1 1 1 5 1 7 1 9 2 2 5 2 8 0 8 3 9 8 1 0 0 1 0 1 1 0 9 1 1 1
V o lt a g e Table 1. Power generation limits and cost
coefficients for Algerian network
Bus Number
Pmin [MW]
Pmax [MW]
a [$/hr]
b [$/MWhr]
c [$/MW2hr]
4 135.0000 1350 0 1.5000 0.0085
5 135.0000 1350 0 1.5000 0.0085
11 10.0000 100 0 2.5000 0.0170
15 30.0000 300 0 2.5000 0.0170
17 135.0000 1350 0 1.5000 0.0085
19 34.5000 345 0 2.5000 0.0170
52 34.5000 345 0 2.5000 0.0170
22 34.5000 345 0 2.5000 0.0170
80 34.5000 345 0 2.5000 0.0170
83 30.0000 300 0 2.5000 0.0170
98 30.0000 300 0 2.5000 0.0170
100 60.0000 600 0 2.0000 0.0030
101 20.0000 200 0 2.0000 0.0030
109 10.0000 100 0 2.5000 0.0170
111 10.0000 100 0 2.5000 0.0170
Tabel 2. Comparison of the results obtained by global methods of 114 Algerian
electrical network
(MW)
Pmin [MW]
AG PSO DE Pmax [MW] Pg4) 135.0 515.11 515.8825 462.3908 1350
Pg5 135.0 241.9 441.4111 459.5589 1350
Pg11 10.0 99.9 100.0000 99.9431 100
Pg15 30.0 135.07 186.9059 192.5196 300
Pg17 135.0 674.04 449.1401 453.0142 1350
Pg19 34.5 163.76 206.6362 196.6569 345
Pg52 34.5 211.16 190.3105 189.0239 345
Pg22 34.5 277.06 177.8684 193.9372 345
Pg80 34.5 228.37 224.2734 192.1215 345
Pg83 30.0 182.49 188.7075 188.1283 300
Pg98 30.0 153.95 192.8819 189.0847 300
Pg100) 60.0 598.41 600.0000 599.9752 600
Pg101 20.0 197.54 200.0000 199.9703 200
Pg109 10.0 98.11 99.7997 99.9909 100
Pg111 10.0 39.46 100.0000 99.9415 100
Ploss 89.345 87.9052 89.2570
Cost[$/hr] 19203 19235 19203.34
time (sec) 290 70 75
Figure 3. Convergence of DE-based OPF solutions algorithm for the Algerian network
Table 3. Comparison of the results obtained by DE with & without regelation of tap change and SVC control
DE (w/o) Tap & SVC control DE with Tap &SVC control
Pg4(MW) 462.3908 434.68
Ploss(MW) 89.2570 61.550
Cost[$/hr] 19203.34 18950.514
The DE is very fast than GA since the GA execution time is about 290 sec. A better cost value can be found by DE with 300 iterations which is 19202.86 $/hr.
0.8 0.9 1 1.1 1.2 80-8 8 86-9 3 58-5 7 60-5 9 72-7 1 21-2 0 28-2 6 48-4 7 Optimal Tap change Value
Figure 5. The optimal tap change values of transformers of the
Algerian network 0.85 0 .9 0.95 1 1.05 1 .1 1 2 3 4
5 6 78 9 10
11 1 2 13 1
4 1 516 17 18 19 20 21 22 23 24 25 26 27 28 29 30 31 32 33 34 35 36 37 38 39 40 41 42 43 44 45 46 47 48 49 50 51 52 53 54 55 56 57 58 59 60 61 62 63 64 65 66 67 68 69 70 71 72 73 74 75 76 77 78 79 80 81 82 83 84 85 86 8788 8990 9192 9394 9596 9798 99100
101102 103104
105106107
108109110111112113114
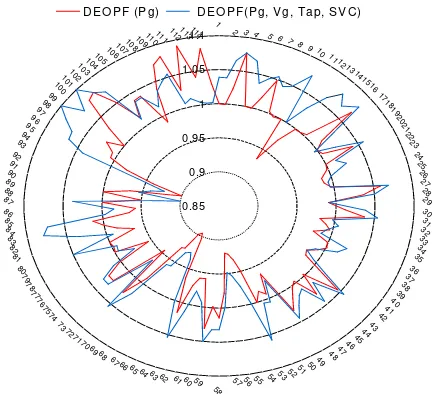
DEO PF (Pg) D EO PF(Pg, Vg, Tap, SV C)
Figure 6. Voltage profile of all buses for the Algerian network with & without FACTS device
0 . 8 8 0 .9 0 . 9 2 0 . 9 4 0 . 9 6 0 . 9 8 1
1 2 5 3 5 4 5 5 5 6 6 6 6 7 6 8 6 9 7 0 7 3 9 1 9 2 9 3 B us N °
V o lta g e M ag n it u d e (p .u .)
A B C O P F (P g ) A B C O P F ( P g , V g , T a p , S V C )
Figure 7. Voltage magnitude in the critical buses with and without the include of SVC in the bus 86
Figure 3 shows the typical convergence characteristics for the best solutions, worst solutions and the average solutions obtained for each generation. It can be seen that the convergence is fast for the proposed DE. The deviation is little between the worst and the best value of the optimum. In this test system according to results obtained from the continuation load flow to enhance the reactive power planning for the Algerian Network, the SVC Compensators can be installed at these critical buses 12, 53, 54, 55, 66, 67, 68, 69, 70, 73, 91, 92, 93. The DE algorithm based on the objective function which takes into account the power losses with only one SVC installed provides bus 68 as the optimum location.
Based on the Table 3, if we don’t use the regulation of the transformer tap change and the SVC device the cost was 19203.34 $/MWh and the losses value was 89.257 MW compared with the case of compensation the cost was reduced to 18950.514 $/MWh and the losses value was reduced to 61.550 MW. The active power generation for the slack bus was reduced from 462.3908 MW to 434.68 MW. The optimal values of the voltage generators by DE are shown in the Figure 4. The optimal tap changes of the 16 transformers of the Algerian network after optimisation by DE are shown in the Figure 5.
values (Figure 6). No load bus was at the lower limit of the voltage magnitudes (0.9 p.u). The Figure 7 shows the voltage profile magnitude improvement at critical buses.
4. Conclusion
In this paper, DE optimization has been presented and applied to economic power dispatch. The de algorithm for solving the OPF has the control over the global and local exploration capabilities. This improves the search efficiency, overcomes premature convergence and avoids getting trapped into the local optima. It does not depend on the nature of the function it minimizes. Thus approximations made in traditional methods can be avoided. And it is insensitive to the initial searching points, thereby ensuring quality solution for different trial runs. To verify the proposed approach and for comparison purposes, we perform simulations on the Algerian Network system. The obtained results indicate that DE is an easy to use, fast, robust and powerful optimization technique compared with Particle Swarm Optimization (PSO) and Genetic Algorithms. Simulation results show that the DE is able to minimize the total cost along with minimization of loss in the system with mixed control variables (discrete and continuous). Also, it is found that DE obtains a better solution in reduced time. The result show also that installing SVC in right location can significantly enhance the security of power system by minimizing the overloaded lines, the bus voltage limit violations and power losses.
References
[1] Momoh A., El-Hawary M. E. and Adapa R. A Review of Selected Optimal Power Flow Literature to 1993 Part i: Nonlinear and Quadratic Programming Approaches. IEEE Transaction on Power Systems. 1999; 14(1): 96-104.
[2] Momoh A., El-Hawary M. E., and Adapa R. A Review of Selected Optimal Power Flow Literature to 1993 Part ii: Newton, Linear Programming and Interior Points Methods. IEEE Transaction on Power Systems. 1999; 14(1): 105-111.
[3] Dommel H. W., Tinney W. F. Optimal Power Flow Solutions. IEEE Transactions on Power Apparatus
and Systems. 1968; 87(10): 1866-1876.
[4] Storn R., Price K. Differential Evolution —a Simple and Efficient Adaptive Scheme for Global Optimization over Continuous Spaces. Technical Report TR-95-012, ICSI, 1995.
[5] Storn R. Differential Evolution, A Simple and Efficient Heuristic Strategy for Global Optimization over Continuous Spaces. Journal of Global Optimization. 1997; 11: 341–359.
[6] Wood A. J. and B.F. Wollenberg. Power Generation, Operation and Control. 2nd Edition. John Wiley. 1996.
[7] Glenn W. Stagg, El Abiad A. H. Computer Methods in Power Systems Analysis. McGraw-Hill. 1981. [8] Hingorani N.G. High Power Electronics and Flexible AC Transmission System, Power Engineering
Review. IEEE. 1988.
[9] Shaoyun Ge., Chung T. S. Coupled active dispatch with FACTS Devices and Specified Power Flow
Control Constraints. Proceedings of the 4th International Conference on Advances in Power System
Control, APSCOM 97. HONG KONG. 1997; 2: 678-683.
[10] Lu Y., Abur A. Static Security Enhancement via Optimal Utilization of Thyristor-Controlled Series Capacitors. IEEE Trans. Power System. 2002; 17(2): 324-329.
[11] Abdel-Moumen M. A., Padhy N. P. Power Flow Control and Transmission Loss Minimization Model
with TCSC for Practical Power Networks.IEEE Proceeding. 2003: 880-884.
[12] Feurt-Esquivel C. R., Acha E., and Ambriz-Pérez H. A Thyristor Controlled Series Compensator Model for the Power Flow Solution of Practical Power Networks. IEEE Trans. Power Systems. 2000; 15(1): 58-64.
[13] Rosehart W. D., Canizares C. A., and Quintana V. H. Effect of Detailed Power System Models in Traditional and Voltage Stability Constrained Optimal Power Flow Problems. IEEE Trans. Power Systems. 2003; 18(1): 25-35.
[14] Moghavvemi M., Faruque M.O. Effects of FACTS Devices on Static Voltage Stability. IEEE Proceeding. 2000: 357-362.