Changes in peripapillary retinal nerve fiber layer thickness
in chronic glaucoma and non-glaucoma patients after
phacoemulsification cataract surgery
Keywords: cataract, chronic glaucoma, phacoemulsification, retinal nerve fiber layer, visual field pISSN: 0853-1773 • eISSN: 2252-8083 • http://dx.doi.org/10.13181/mji.v24i4.1181 • Med J Indones. 2015;24:221–7
• Received 07 Jan 2015 • Accepted 19 Agu 2015 Correspondence author: Andi A. Victor, [email protected]
Copyright @ 2015 Authors. This is an open access article distributed under the terms of the Creative Commons Attribution-NonCommercial 4.0 International License (http://creativecommons.org/licenses/by-nc/4.0/), which permits unrestricted non-commercial use, distribution, and reproduction in any medium, provided the original author and source are properly cited.
Olivia P. Perdana,1 Andi A. Victor,1 Virna D. Oktarina,1 Joedo Prihartono2
1 Department of Ophthalmology, Faculty of Medicine, Universitas Indonesia, Cipto Mangunkusumo Hospital, Jakarta, Indonesia
2 Department of Community Medicine, Faculty of Medicine, Universitas Indonesia, Jakarta, Indonesia Clinical Research
ABSTRAK
Latar belakang: Fakoemulsifikasi merupakan tindakan
yang saat ini sering dilakukan untuk mengatasi katarak. Fluktuasi tekanan intra okular selama fakoemulsifikasi dapat mempengaruhi ketebalan lapisan serabut saraf retinal nerve fiber layer (RNFL) peripapil. Penelitian ini bertujuan untuk mengetahui perubahan ketebalan RNFL peripapil dan rerata deviasi lapang pandang sesudah fakoemulsifikasi pada pasien glaukoma kronis dan non-glaukoma.
Metode: Studi ini menggunakan desain kohort prospektif
dan pengambilan subyek secara konsekutif didapatkan 26 mata (13 mata glaukoma kronik dan 13 mata non-glaukoma) yang menjalani fakoemulsifikasi. Ketebalan RNFL dan rerata deviasi lapang pandang diukur sebelum dan sesudah fakoemulsifikasi, dan dibandingkan menggunakan uji t berpasangan. Perbandingan kelompok glaukoma dan non-glaukoma dilakukan dengan uji t tidak berpasangan.
Hasil: Tidak terdapat perubahan yang bermakna secara
statistik antara ketebalan RNFL peripapil pasca fakoemulsifikasi pada rerata seluruh kuadran dan kuadran inferior di kedua kelompok, serta pada kuadran nasal di kelompok glaukoma. Pada kelompok glaukoma, rerata ketebalan RNFL seluruh kuadran adalah 94,9±20,0 dan 99,1±21,3 μm (p>0,05). Sedangkan pada kelompok non-glaukoma, ketebalan rerata seluruh kuadran 100,2±11,1 μm dan 101,7±6,8 μm (p>0,05). Pada kelompok glaukoma terjadi penurunan rerata deviasi lapangan pandang yang tidak bermakna secara statistik (p=0,071). Sedangkan pada kelompok non-glaukoma terjadi peningkatan yang bermakna (p=0,005).
Kesimpulan: Terdapat kecenderungan peningkatan ketebalan
serabut saraf retina peripapil pasca-fakoemulsifikasi pada glaukoma dan non-glaukoma. Pada kelompok glaukoma terjadi kecenderungan penurunan lapang pandangan, sedangkan pada kelompok non-glaukoma terjadi peningkatan yang bermakna secara statistik.
ABSTRACT
Background: Phacoemulsification is a common cataract operation nowadays. During phacoemulsification, variation in intraocular pressure (IOP) may occur, which might change the retinal nerve fiber layer (RNFL) thickness. This study was aimed to evaluate the change in peripapillary RNFL thickness and mean deviation (MD) of visual field after phacoemulsification in chronic primary glaucoma and non-glaucoma patients.
Methods: Cohort prospective study was done on 26 patients (13 chronic glaucoma eyes and 13 non-glaucoma eyes) who underwent phacoemulsification. The changes in peripapillary RNFL thickness and MD of visual field were measured as the primary outcome. Comparison between pre- and post-surgery was analyzed with paired t-test, while unpaired t-test was used for comparison between groups. Results: There were no significant changes in RNFL thickness on both groups. Average RNFL thickness in glaucoma group before and after phacoemulsification were 94.9±20.0 μm and 99.1±21.3 μm, respectively (p>0.05). Average RNFL thickness in non-glaucoma group were 100.2±11.1 μm and 101.7±6.8 μm, respectively (p>0.05). Glaucoma patients yielded decreasing mean deviation (MD) of visual field, but it was not statistically significant (p=0.071). In contrast, the MD of visual field after surgery was significantly increased in non-glaucoma group (p=0.005).
In the past years, the diagnosis of glaucoma is determined by the cupping of the optical disc, but this method of evaluation is not sensitive enough to detect minimal optic nerve damage. Evaluation of optic-cup disc is subjective and dependent on the clinical interpretation of the physician. Because of these limitations, the more accurate and objective method is needed to evaluate the change in the peripapillary retinal nerve fiber layer (RNFL) structure and to detect its progressivity. Optical coherence tomography (OCT) represents a method which can detect the retinal morphology qualitatively and quantitatively.1
Peripapillary RNFL lies under the internal limiting membrane and is the continuation of the ganglion cell. Peripapillary RNFL then fuses with the posterior aspect of the eye globe and forms the optical nerve and is called peripapillary RNFL.2,3 Damage on the ganglion cells and their axons will cause the thinning of peripapillary RNFL and is correlated with the decrease of the visual field. This can be a challenge for clinician because this condition can cause permanent damage.1-4
Increased intraocular pressure (IOP) will cause direct compression on the axon fibers and supporting structures of the anterior optical nerve. It will also damage the lamina cribrosa and disturb the axoplasmic flows that can lead to the necrosis of ganglion cells and consequently will cause the thinning of RNFL.5
Phacoemulsification is a common cataract operation nowadays. This technique allows the operator to use a maximal vacuum to finish the operation quickly, however, this method can compromise the stability of the anterior ocular chamber. During phacoemulsification, variation in IOP may occur, which can induce the transient increase of IOP, and consequently changes the RNFL thickness. In every stage of phacoemulsification procedure, the IOP fluctuates.6
Cataract and glaucoma are two of the most frequent diseases that cause blindness in the elderly. It is predicted that approximately, there will be 79.6 million blindness of glaucoma in 2020.7 In Cipto Mangunkusumo Hospital (CMH),
Jakarta, the number of glaucoma patients increases every year. Between 2001–2010, as much as 11.5% (371 cases) glaucoma suspected
patients were found in CMH.8 Primary glaucoma
with an open angle or closed angle, is more common than secondary glaucoma.7,9,10 Several
studies had been conducted on how the increasing IOP, either acutely or chronically, can damage the peripapillary nerve fibers on glaucoma and non-glaucoma patients.6,11,12The studies about the
influence of phacoemulsification on the macula and peripapillary RNFL thickness have been done in non-glaucoma patients, but not in the glaucoma patients.
Based on the above knowledges, this study aimed to evaluate how the IOP fluctuation during phacoemulsification may change the peripapillary RNFL thickness in glaucoma and non-glaucoma patients. Additionaly, this study will also address the changes of mean deviation (MD) of visual field in both groups.
METHODS
This was a prospective cohort study conducted at Cipto Mangunkusumo Hospital, Jakarta, between June to December 2013. The subjects of this study were devided into either glaucoma or non-glaucoma group depending on their condition. Thirteen subjects in each group have been included in this study. Protocol of this study has been approved by the Ethics Committee, Faculty of Medicine, Universitas Indonesia (No. 702/II2. F1/ETIK/2013).
The cataract surgery was done by single competence ophthalmologist (VDO) from Cipto Mangunkusumo Kirana Hospital using Alcon-Infiniti® phacoemulsification machine. Visual acuity and visual field were measured before and four weeks after phacoemulsification. The primary outcome of this study was the RNFL thickness in superior, inferior, temporal and nasal quadrants. Nerve fiber layer was measured by spectral-domain OCT (SD-OCT) using 3D-OCT 1000 (TOPCON, Paramus, New Jersey, USA) and the value was assessed by single ophthalmologist. Visual acuity was measured by using Snellen chart and visual field was measured by Humphrey field analyzer (HFA). An accurate HFA examination requires false positive response of 15%, false negative response >20-30%, and fixation loss >20%. We took the value of MD of visual field which is defined as the average difference between patient’s value with desirable values of the same group age.
The data collected were analyzed using computerized statistical program. Kolmogorov-Smirnov test was used to determine the homogeneity of data distribution. Unpaired
t-test was used to compare the difference in
peripapillary RNFL thickness pre- and post-surgery between both groups. Paired t-test
was used to compare the peripapillary RNFL
Characteristics Glaucoma (n) Non-glaucoma (n) Gender
Male 9 9
Female 4 4
Age
≤65 years old 7 7
>65 years old 6 6
Table 1. Demographic characteristics of subjects in each group
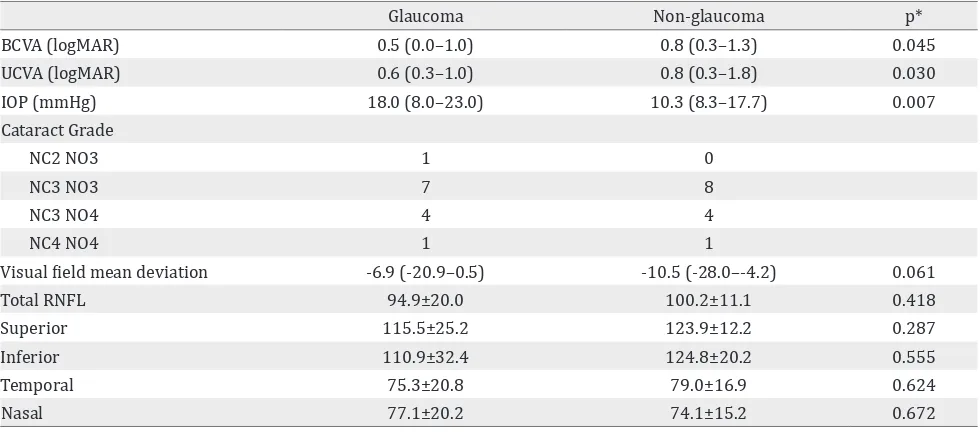
Table 2. Baseline clinical characteristic of each group
Glaucoma Non-glaucoma p*
BCVA (logMAR) 0.5 (0.0–1.0) 0.8 (0.3–1.3) 0.045
UCVA (logMAR) 0.6 (0.3–1.0) 0.8 (0.3–1.8) 0.030
IOP (mmHg) 18.0 (8.0–23.0) 10.3 (8.3–17.7) 0.007
Cataract Grade
NC2 NO3 1 0
NC3 NO3 7 8
NC3 NO4 4 4
NC4 NO4 1 1
Visual field mean deviation -6.9 (-20.9–0.5) -10.5 (-28.0–-4.2) 0.061
Total RNFL 94.9±20.0 100.2±11.1 0.418
Superior 115.5±25.2 123.9±12.2 0.287
Inferior 110.9±32.4 124.8±20.2 0.555
Temporal 75.3±20.8 79.0±16.9 0.624
Nasal 77.1±20.2 74.1±15.2 0.672
thickness pre- and post-surgery within each group. The difference in visual field was analyzed using Mann-Whitney rank test. The differences are considered significant if p<0.05.
RESULTS
Twenty six eyes from 26 patients were involved in this study. The demographic characteristics among the subjects are shown on table 1. The average patients age were 64 years old in glaucoma group and 60 in non-glaucoma group. There were more males in this study than females.
As shown on table 2, the pre-operative BCVA in non-glaucoma group was better than the glaucoma group (0.8 vs 0.5). The IOP in the non-glaucoma group (10.3 mmHg) was better than the
glaucoma group (18 mmHg) and the difference was statistically significant (p<0.05), although the IOP in both groups was still within normal range (≤21 mmHg). The pre-operative peripapillary RNFL thickness in both groups showed no statistically significant difference.
In table 3 we can see that within each group, there were no statistically significant difference between the value of peripapillary RNFL thickness before and after phacoemulsification (∆
peripapillary RNFL thickness). The comparisons
of ∆ peripapillary RNFL thickness between the groups were also not statistically significant.
Quadrant Pre Post ∆ p
Glaucom
Average* 94.92±20.0 99.08±21.3 4.15±8.3 0.677
Superior 115.46±25.2 121.61±26.4 6.15±14.3 0.687
Inferior* 110.92±32.4 116.54±33.3 5.61±6.1 0.351
Temporal 75.31±20.8 77.46±17.9 2.15±17.7 0.512
Nasal* 77.08±20.1 80.85±25.7 3.77±10.5 0.428
Non-glaucoma
Average* 100.15±11.1 101.69±6.8 1.54±6.7 0.423
Superior 123.92±12.2 124.85±11.1 0.92±7.0 0.642
Inferior* 124.77±20.2 126.23±15.4 1.46±15.9 0.746
Temporal 79.00±16.9 81.46±12.2 2.46±10.1 0.399
Nasal* 74.08±15.2 74.62±10.6 0.54±14.7 0.897
Table 3. Pre- and post-phacoemulsification values of peripapillary RNFL thickness in glaucoma and non-glaucoma patients
Table 4. Pre- and post-phacoemulsification values of visual acuity and IOP in glaucoma and non-glaucoma patients
Table 5. Mean deviation (MD) of visual field defects pre- and post-phacoemulsification (decibels=dB) Significant if p<0.05, *: paired t-test, †: wilcoxon test
Pre Post ∆ p
Glaucoma
UCVA (logMAR)* 1.05±0.49 0.23±0.17 0.82±0.48 <0.001
BCVA (logMAR)† 0.73±0.31 0.03±0.06 0.70±0.29 0.001
IOP* 11.62±2.63 11.27±2.79 0.35±0.48 0.022
Non-glaucoma
UCVA (logMAR)* 0.65±0.24 0.33±0.27 0.32±0.15 <0.001
BCVA (logMAR)† 0.45±0.34 0.09±0.16 0.36±0.33 0.005
IOP* 16.58±4.48 14.01±4.09 2.57±2.46 0.003
After phacoemulsification, visual acuity was significantly improved in all patients in both groups. A statistically significant improvement is also observed in the value of IOP in each group.
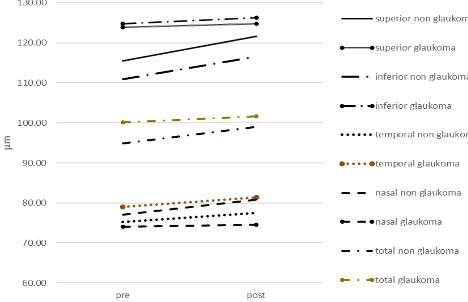
In figure 1 we can see that the thickening of peripapillary RNFL post-operative was less in the non-glaucoma group compared to the glaucoma group. In this group, the biggest change was found in the inferior quadrant (1.46±1.59 μm), while the least change was found in the nasal quadrant (0.54±1.47 μm). But, these changes were not statistically significant.
MD perimetry Pre-phacoemulsification Post-phacoemulsification p
Glaucoma -10.5 (-28.0–(-4.2)) -7.6 (-23.7–(-0.9)) 0.071
Non-glaucoma -6.9 (-20.9–0.5) -7.6 (-23.7–(-0.9)) 0.005
In the non-glaucoma group, the visual field was improved and statistically significant (p=0.005). However in the glaucoma group, the visual field was declined so we can say that the visual field was worsened. The worsening is not statistically significant (p=0.071).
There was a negative correlation between the changes in peripapillary RNFL thickness and visual field in the glaucoma group (r=-0.39, p=0.190). In the non-glaucoma group, in the contrary, the correlation was positive (r=0.89, p=0.571). Both of these correlations were not statistically significant.
DISCUSSION
This study found that the peripapillary thickness was clinically thinner in glaucoma group compared to the non-glaucoma group. The peripapillary thickness were measured using spectral domain optical coherence tomography (SD OCT), which according to Schuman13 this instrument was superior to time domain (TD)
Figure 1. The changes of peripapillary RNFL thickness pre-and post-phacoemulsification in glaucoma group (dot line) and in non-glaucoma group (continous line). No significant difference of both group in all quadrants (p>0.05)
OCT. SD-OCT produced the tomography if the eye with high resolution and the scanning process is faster. This device also gives better reproducibility in measuring peripapillary RNFL and macular thickness. SD-OCT is mainly used to measure the sectoral loss of retinal tissue rather than measuring the global loss as seen in the early phase of glaucoma in which the tissue loss occurred focally.
During phacoemulsification, a high vacuum was accompanied with high irrigation pressure. The
increase in those pressures might cause the
increase in IOP. Chen D et al6 found that the highest
IOP during phacoemulsification occurred during the emulsification of the nucleus and cortex (68.4 mmHg in 132±15.1 seconds), approximately 74.4% from the total time of perfusion.
of the disease. Studies that measured the changes in peripapillary RNFL thickness found that the changes occurred because of a sudden increase of IOP (>40 mmHg in less than 48 hours).11,12 Eyes with IOP increased of more than 40 mmHg, had thinner peripapillary RNFL and these thinning also occured continuously until six months follow-up. In patients who never ischemic process. In ischemic process, there was intraneural ischemia due to the decrease of perfusion to the optical nerve from the damaged vessels autoregulation. Thereby, depriving perfusion and damaging the optical nerve, resulted in the thinning of peripapillary retinal nerve fiber layer. IOP elevation caused RNFL thinning because IOP elevation directly compressed axonal fiber and the supporting structure in the anterior optic nerve. In addition, damages lamina cribrosa plater, interfered axoplasmic stream that ended with ganglionic cells death and peripapillary RNFL thinning.
Yoles et al14 described about secondary
degeneration mechanism. This mechanism explained why neuron damage continued to occur even with lowered IOP. In this event, a propagation of damage occurred at the normal neuron around the damaged one. Tsai et al12 reported that the thickening of retinal nerve fiber layer occurs in the first week after the acute attack, followed by the thinning of RNFL in the involved eye after the fourth and 12th week.
Liu et al11 reported that since the increased the thickness of RNFL occurred in the first week after an acute attack, a progressive decreasing then occurred after the next six weeks. In phacoemulsification, the mechanical effects resulted from ultrasound energy and liquid regulation in that surgery due to compression reaction and hypoxia in the tissue.15
One week after phacoemulsification, the thickness of peripapillary RNFL increased in every quadrant (superior, inferior, temporal, and nasal) and in the mean of all quadrants, even though the differences were not statistically significant. The increase of peripapillary RNFL thickness was greater in
glaucoma group compared to non-glaucoma. In the glaucoma group, the peripapillary RNFL was thickened in every quadrant post-operatively, despite the variation of the thickening. The most visible change in the glaucoma group was found in the superior quadrant in which the thickening was 6.15±1.46 μm. The least change was found in the temporal quadrant (2.15±17.71 μm). We may found the difference between peripapillary RNFL in every quadrant before and after phacoemulsification in both groups clinically, but we found that the difference was not significant statistically.
Several previous studies reported a peripapillary RNFL examination post-cataract surgery with various RNFL measurement techniques. A significant increase of peripapillary RNFL post-surgery have been reported. In those studies, the increase of RNFL thickness was related with the power of OCT signal and lens opacity. A lower signal power before phacoemulsification that caused by lens opacity would be increased after surgery because of the subsequent clearer media.16,17
In this study, the mean of image quality in all subjects were nearly similar in both of the groups, so the possibility of difference results before and after surgery measurement could be ignored. A peripapillary RNFL thickness increased in this study was caused by the inflammatory factors post and a longer healing of retinal layer compared with the edema of cornea. In glaucoma with peripapillary nerve fiber and ganglion cells damage, and with inhibited perfusion, the inflammation process, the healing process was slower than normal condition. This could be observed in figure 1, a mean increase of RFNL group was about 4 μm and in non-glaucoma group was only 1 μm.
All of the subjects of this study did not have severe corneal edema so we could perform the OCT examination in one week after surgery, but in the first week of post-phacoemulsification there was RNFL edema period of healing compared with the improvement of corneal edema, so it was seen like RNFL thickness in OCT examination.
retinal nerve fiber. At the beginning of glaucoma process, there was a destruction of the structure such as the ganglion cells apoptosis, loses of the RNFL and alteration of optical papil. All of the continuing process provided no signs or symptoms, and could not be diagnosed until functional disorder could be detected as early scotoma in the visual field examination.18,19
In this study, we also found a decrease in the mean deviation of the visual field in glaucoma group, but it was not statistically significant. In contrast, post-cataract surgery sensitivity was improving, but the visual field narrowed. This indicates that a damage of RNFL occurred in glaucoma group post-phacoemulsification. In the contrary, we found a visual field improvement that was statistically significant in non-glaucoma group. This improvement of visual field was resulted from the improvement of contrast sensitivity after the removal of cataract.18,19
In conclusion, the peripapillary RNFL thickness
in some quadrants were increased after phacoemulsification, however these changes were not statistically significant in both glaucoma and non-glaucoma patients. The differences between groups were also not statistically significant. In addition, glaucoma patients had decreased visual field after phacoemulsification, although the changes were not statistically significant. While in non-glaucoma patients the visual field were significantly improved.
Conflicts of interest
The authors affirm there is no conflict of interest in this study. CS. Retinal nerve fiber layer and macular inner retina measurements by spectral domain optical coherence tomograph in Indian eyes with early glaucoma. Eye (Lond). 2012;26(1),133–9.
3. Sung KR, Kim DY, Park SB, Kook MS. Comparison of retinal nerve fiber layer thickness measured by Cirrus HD and Stratus optical coherence tomography. Ophthalmology. 2009;116(7):1264–70.
4. Schuman JS, Hee MR, Puliafito CA, Wong C, Pedut-Kloizman T, Lin CP, et al. Quantification of nerve fiber layer thickness in normal and glaucomatous eyes using optical coherence tomography. Arch Ophthalmol. 1995;113(5):586–96.
5. American Academy of Ophthalmology. Fundamentals and principles of ophthalmology: basic and clinical science course. San Francisco: American Academy of Ophthalmology; 2006–2007.
6. Chen D, Zhu J, Li J, Ding XX, Lu F, Zhao YE. Effect of simulated dynamic intraocular pressure on retinal thickness measured by optical coherence tomography after cataract surgery. Int J Ophthalmol. 2012;5(6):687–93.
7. Quigley HA, Broman AT. The number of people with glaucoma worldwide in 2010 and 2020. Br J Ophthalmol. 2006;90(3):262-7.
8. Faiqoh M. Karakteristik pasien di divisi glaukoma poliklinik mata Rumah Sakit Cipto Mangunkusumo tahun 2001–2010 Jakarta: Indonesia; 2011. Indonesian 9. Wang YX, Xu L, Yang H, Jonas JB. Prevalence of glaucoma
in North China: the Beijing eye study. Am J Ophthalmol. 2010;150(6):917–24.
10. Giangiacomo A, Coleman AL. The epidemiology of glaucoma In: Grehn F, Stamper R, editors. Glaucoma. Heidelberg: Springer; 2009. p. 13–21.
11. Liu X, Zhong YM, Xiao H, Huang JJ, Kong XY. The damage patterns of retinal nerve fiber layer in acute and chronic intraocular pressure elevation in primary angle closure glaucoma. Eye Sci. 2011;26(3):154–60.
12. Tsai JC, Lin PW, Teng MC, Lai IC. Longitudinal changes in retinal nerve fiber layer thickness after acute primary angle closure measured with optical coherence tomography. Invest Ophthalmol Vis Sci. 2007;48(4):1659–64.
13. Schuman JS. Spectral domain optical coherence tomography for glaucoma (An AOS Thesis). Trans Am Ophthalmol Soc. 2008;106:426–58.
14. Yoles E, Schwartz M. Potential neuroprotective therapy for glaucomatous optic neuropathy. Surv Ophthalmol. 1998;42(4):367–72. measurements by optical coherence tomography. J Ophthalmic Vis Res. 2010;5(3):151–7.
17. Dada T, Behera G, Agarwal A, Kumar S, Sihota R, Panda A. Effect of cataract surgery on retinal nerve fiber layer thickness parameters using scanning laser polarimetry (GDxVCC). Indian J Ophthalmol: 2010;58(5):389–94. 18. Gazzard G, Foster PJ, Devereux JG, Oen F, Chew P,
Khaw PT, et al. Intraocular pressure and visual field loss in primary angle closure and primary open angle glaucomas. Br J Ophthalmol. 2003;87(6):720–5. 19. Cheung CY, Leung CK, Lin D, Pang CP, Lam DS.