ON THE STUDY OF THE ACOUSTIC PERFORMANCE OF THE SEMINAR HALLS
NURUL HAMIZAH BINTI MOHAMED
i
ON THE STUDY OF THE ACOUSTIC PERFORMANCE OF THE SEMINAR HALLS
NURUL HAMIZAH BINTI MOHAMED
This report is submitted in fullfillment of the requirement for the award Bachelor of Mechanical Engineering ( Design & Innovation)
Faculty of Mechanical Engineering Universiti Teknikal Malaysia Melaka
ii
DECLARATION
“I hereby declare that the work in this report is my own except for summaries and quotations which have been duly acknowledged.”
iii
SUPERVISOR DECLARATION
“I hereby declare that I have read this thesis and in my opinion this report is sufficient in terms of scope and quality for the award of the degree of
Bachelor of Mechanical Engineering (Design & Innovation)”
iv
For my left shoulders:
Mohamed Mahat Nor’ashikin Kasbi Nurul Hasyimah Mohamed
Nurul Hazwani Mohamed Muhammad Ammar Ashraf Mohamed
and
v
ACKNOWLEDGEMENT
First and foremost, I would like to express my sincere gratitude to my supervisor, Assoc Prof. Dr Azma Putra. Without fail, he has provided me details guidance and encourages me throughout the project. He has always been enthusiastic in solving, reflecting, responding and advising my problems. I appreciate for the countless time he had spent having discussion with me regarding my final year project and offering numerous suggestion to improve my work.
Secondly, I would like to acknowledge and give appreciation to a senior, Dg Hafizah Kassim, for giving suggestions, sharing knowledge and provide guidance throughout the project, mostly on modelling and analyzing using CATT Software. Her knowledge has helped me a lot on completing this project.
Special thanks go to my parents and families for their good-natured forbearance with the process and for their pride in this accomplishment. My gratitude is for their understandings of my busy life and pack schedules.
vi
ABSTRACT
vii
ABSTRAK
viii
TABLE OF CONTENT
TOPIC PAGE
TITLE PAGE i
DECLARATION ii
SUPERVISOR DECLARATION iii
DEDICATION iv
ACKNOWLEDGEMENT v
ABSTRACT vi
ABSTRAK vii
TABLE OF CONTENTS viii
LIST OF FIGURES x
LIST OF SYMBOLS xiii
CHAPTER 1 INTRODUCTION
1.1 Background 1
1.2 Problem Statement 2
1.3 Objectives 3
1.4 Scope 3
CHAPTER 2 LITERATURE REVIEW
2.1 Introduction 4
2.2 Sound Absorption 5
2.3 Reverberation Time 6
2.4 Speech Intelligibility 9
2.5 Rapid Speech Transmission Index 10
2.6 Early Decay Time 11
2.7 Clarity 12
ix
CHAPTER 3 METHADOLOGY
3.1 Flow Chart 14
3.2 Seminar Halls 15
3.3 Modeling
3.3.1 CATT Acoustic 17
3.3.2 Point Declaration 18
3.3.3 Planes Production 19
3.3.4 Coefficient of Absorption 20
3.4 Analyzing
3.4.1 Source and Receiver 20
3.5 Validation Experiment 21
3.5.1 Sound Level Meter 23
3.5.2 Experimental Source and Receiver 23
3.6 Summary 24
CHAPTER 4 RESULTS AND DISCUSSION
4.1 Dewan UTeM 1 25
4.1.1 Reverberation Time 27
4.1.2 Clarity 29
4.1.3 Early Energy Fraction 31
4.2 Dewan Besar 32
4.2.1 Reverberation Time 32
4.2.2 Clarity 36
4.2.3 Early Energy Fraction 37
4.3 Suggestion on Improving The Acoustic Performance
4.3.1 Dewan UTeM 1 38
4.3.2 Dewan Besar 41
CHAPTER 5 CONCLUSION AND RECOMMENDATION 44
REFERENCES 46
x
LIST OF FIGURES
FIGURE TITLE PAGE
2.1 Frequency Range of Typical Sound Source (Everest & Pohlman, 2009)
5
2.2 The Ray Path of the Reflection and Absorption of Sound
(Crandall, 1926) 6
2.3 Graph of Reverberation Time by Taking Sound Level versus Time (Grade et al, 2001)
8
2.4 The Variation of Optimum Reverberation Time with Volume (Noise Pollution and Its Control, 1989)
9
2.5 Qualitative Interpretation of RASTI (Sound System Equipment Part 16).
11
3.1 The Flow Chart of Methodology 14
3.2 Interior Part of Dewan UTeM 1 16
3.3 Interior Part of Dewan Besar (a) Views from right (b) Views from left (c) Views fom back
17
3.4 Logo of CATT Acoustic 18
3.5 The management of Point from Each Axis 18
3.6 Declaration of each point for Dewan UTeM by using CATT Software
19
3.7 Declaration of Planes of Dewan UTeM 1 by using CATT Software.
19
3.8 Declaration of Coefficient of Material Absorption of Dewan UTeM 1 by using CATT Software
20
3.9 Declaration of the Sources for Dewan UTeM 1 by using CATT Software.
xi
3.10 Declaration of the Receivers for Dewan UTeM 1 by using CATT Software
21
3.11 Measurement setup for the Validation Experiment 22
3.12 SLM set in the experiment: (a) SLM is calibrated before used. (b) SLM being put on 1.2m tripod stand
23
3.13 The points of Reverberation Time in Experiment 24 4.1 The Model of Dewan UTeM 1:
(a) views from sides of the hall (b) views from the floor of the hall
26
4.2 The Reverberation Time of Receivers in Dewan UTeM 1 27 4.3 The Optimum Reverberation Time Graph Depends on The
Room Volume for 500Hz Octave Sound. [14] 27 4.4 The Experimental Reverberation Time of Dewan UTeM 1 29
4.5 The Clarity of Dewan UTeM 1 30
4.6 The Division of the Receivers in Dewan UTeM 1 30
4.7 The Early Energy Fraction of Dewan UTeM 1 31
4.8 Model of Dewan Besar UTeM: (a) views from the side of the hall (b) views from the below of the hall
33
4.9 The Reverberation Time of Dewan Besar 34
4.10 The Reverberation Time for The Receiver That Be Sitting on Stage
35
4.11 The Distribution of Early Energy Fraction of Receiver That Sit on Stage
36
4.12 Figure 4.12: The Distribution of Clarity in Dewan Besar 36
4.13 Figure 4.13: The Distribution of Early Energy Fraction in Dewan Besar.
xii
4.14 Soundboard Set on Dewan UTeM 1 Ceiling 38
4.15 The Acoustic Performance of Dewan Utem 1 with Soundboard as Absorber
39
4.16 Graph of Difference RT Before and After Soundboard Installation
39
4.17 Carpet is attached on Dewan UTeM 1 Floor 40
4.18 The Acoustic Performance of Dewan UTeM 1 with Carpet as Absorber
40
4.19 Graph of Difference RT Before and After Carpet Installation 41
4.20 Nylon Cloth attached to hall ceiling 42
4.21 Result of attaching Nylon Cloth at the hall ceiling. 42 4.22 Figure 4.22: Glass Fence Attached on the Stage 43
xiii
LIST OF SYMBOLS
FIGURE TITLE
RT Reverberation Time V Volume of Rooms in m3
S Total surface area of room in m2
Α Average of Coefficient of Material Absorption of the room surfaces
E(t) Early Decay Time (EDT) p Impulse response
τ C D
Early Limit of Sound Clarity
CHAPTER 1
INTRODUCTION
1.1 BACKGROUND
A speech is a method of delivering messages, knowledge or lectures. In delivering a speech, most all the activities involve speech between the source (deliver) and the receivers. While listening to a speech, a clear sound is a very important. Clear sound will directly affect the listener’s attention. According to Smaldino & Crandell (1999), a person who develops skills in poor acoustic environment may develop long-term speech comprehension problems.
2
In this research, the study of the acoustic performance of lecture halls will be the main part of the projects. To narrowing the research, two Seminar Halls in UTeM have been chose to be the specimens. The halls are Dewan UTeM 1 and Dewan Besar UTeM. The materials of the walls, floors and tops of the halls are the main subject to be examined in this study. This is because the reflection and refraction of sounds can be influenced by the materials used.
On the same time, most of the lecture halls, in huge or small size, are using reinforcement system. Reinforcement system is where combination of tools used to make the sound can be heard in every side of the hall. Addition of tools like microphones, signal processors, amplifiers and loudspeakers will help to make the voice louder. Sometimes, connection of too many reinforcement tools will bring the outputs of humming, buzzing, vibration and echoes. Hence, the factor of getting the clear sound is neglected.
This study will helps on giving result of good acoustic performance in the way to give best decision for the architects to either choose the correct materials in building or else, allocate absorbers in the right position.
1.2 PROBLEM STATEMENTS
3
1.3 OBJECTIVES
1. To model and simulate the acoustic performance of Dewan UTeM 1 and Dewan Besar UTeM using CATT software.
2. To suggest the solutions on improving the acoustic quality of the halls.
1.4 SCOPE
This research will only focus on the experimental of acoustic performance of the Seminar Hall by using CATT software. Modelling the shape of the hall will be done as the first step before any analyzing works take place. Measurement of the perimeter of the hall and the material used is noted on modelling the hall inside the software. The project also intends to find the result of the clarity of speech and the reverberation time of the sound waves.
The audience area will be set on the floor, and will be labelled in 5 different coordinates. This is to make sure that the performance of the sound will be tested in different points of the hall. Source will be located at where the microphone is always set.
CHAPTER 2
LITERATURE REVIEW
2.1 INTRODUCTION
Every day we are exposed to sound either is not required, necessary or beneficial for almost twenty-four hours a day, seven day a week. Sound is a vibration that propagates as a typical audible mechanical wave of pressure and displacement, through a medium such as air or water. Sound wave that travels through air is the resulting of the physical disturbance of air molecules such when tapping a tuning fork and the waves will combine to reach the listener direct or indirectly (Crandall, 1926).
5
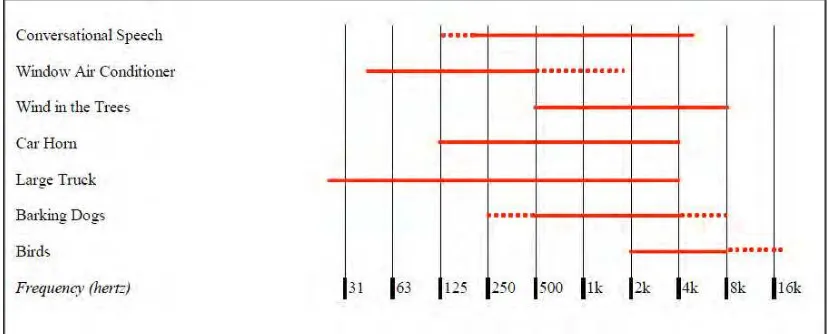
Although sound travels and can be heard but not all sound is audible. Limits of audibility for humans are only between 20Hz to 20 kHz (Charles, 1998). Sound below 20Hz is infrasonic and sound greater than 20 kHz is called an ultrasonic sound.
Figure 2.1: Frequency Range of Typical Sound Source (Everest & Pohlman, 2009).
Decibel or dB is the most common unit of sound measurement (Charles, 1998). The threshold of hearing is considered to be 0dB and the range sound for normal human experience is 0dB to140dB.
2.2 SOUND ABSORPTION
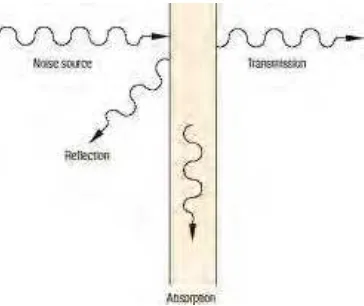
Sound absorption refers to a material, structure or object absorbing sound energy when sound waves collide with it, as opposed to reflecting the energy. Every material has its own ability to absorb sound energy. Materials that have low absorption ability tend to reflect most of the acoustical energy.
6
transformed into heat and part is transmitted. The energy transformed into heat is said to be lost.
The property of material absorbing ability is called Sound Absorption Coefficient. To find the coefficient, architect usually used the Noise Reduction Coefficient (NRC). If the scale of NRC is 1.0, that mean that the material is perfectly absorptive and if it is 0.0, it is a reflective materials (Crandall, 1926). This coefficient helps the work on choosing the right material for each building walls.
Figure 2.2: The Ray Path of the Reflection and Absorption of Sound (Crandall, 1926)
2.3 REVERBERATION TIME
When a sound is triggered or generated in a room, many things will happen in a blink of eye. The reflecting boundaries of the room will result repeated reflections which determine the rapid establishment of more or less uniform sound field. And this field then decays as the sound energy is absorbed by the bounding materials. The reflecting surface with its absorptive ability will determine the rate of the sound energy decays. And time taken for the sound intensity to decays for 60 dB is called the “Reverberation Time” (Grade et al, 2001).
7
acoustic design is to identify the good values of the reverberation time depends on the function of the room. Furthermore, we can specify the materials that to be used in the construction which will achieve the desired value of the Reverberation Time.
For an example, a classroom should have the reverberation time in the range of 0.4 to 0.6 seconds. But in reality, many did not manage to achieve the suitable reverberation time and having reverberation time of 1 second and more. In such reality cases, teachers have to compete against the lingering reflection of his or her own voice to get the student’s attention. The result is a chaotic jumble of sound (Goelzer & Hansen).
In 1922, a pioneer in the study of room acoustics, Wallace Sabine came up with the formula which is defined as Eq. (1) below,
SV m
RT 0.16 1 (1)
The equation above show that the RT is the reverberation time, where V is for the room volume in m3, S will be the total surface area in m2, and is the average of the absorption coefficient of room surfaces.
8
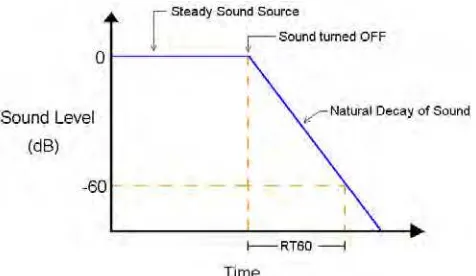
Figure 2.3: Graph of Reverberation Time by Taking Sound Level versus Time (Grade et al, 2001)
The graph above show of RT60 where T is defined as the duration required for the space-averaged sound energy density in an enclosure to decrease by 60 dB after the source emission has stopped (Grade et al, 2001). Things that will be effect reverberation are size of space and the amount of reflective or absorptive surface within space (Goelzer & Hansen). A space with high absorptive surface will absorb the sound and stop it from reflecting back into the space (Grade et al, 2001). Reflective surfaces will reflect sound and increase the reverberation time within space. Therefore, a large space will need more absorption instead of reflection in the way to achieve the same reverberation time as a smaller space.
In general, the best reverberation times are less than 1 second for speech and longer than 1 second for music. Short reverberation times are necessary for clarity of speech; otherwise, the continuing presence of reverberant sound will mask the following sound and cause the speech to be blurred. Longer reverberation times are considered to enhance the quality of music, which will give “dead” environment if the reverberation time is too short. Larger rooms are judged to require longer reverberation times, as is also the case with lower frequencies of sound.
9
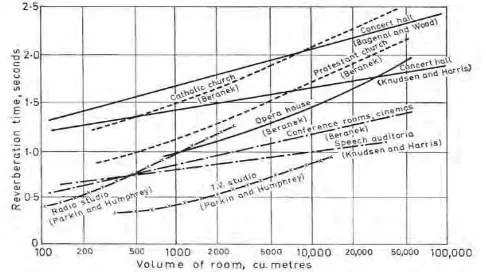
1996). The reverberation time of a room must be suitable to the function and volume of the room, should apply for sound frequency from 125Hz to 4,000Hz.
Figure 2.4: The Variation of Optimum Reverberation Time with Volume (Noise Pollution and Its Control, 1989)
2.4 SPEECH INTELLIGIBILITY
Speech intelligibility is defined as a percentage of speech or words heard correctly by the listeners. It is a vital element of human communication. Without outstanding speech intelligibility, communication is hampered. Good intelligibility is influenced by reverberation time (RT), background noise and distance of the listener from the speaker. From the three elements, RT and background noise are influenced by the architecture of the room; therefore, they should be given greater attention at the design stage. However, the quality of speech is also dependent on vocal strength or power, dialect and clarity of the spoken words.
10
the quality of a reproduce speech signal with respect to the amount of audible distortions. Thus, a message that lacks quality may still be intelligible.
Speech intelligibility in the hall is a crucial aspect when talk or lecture is given. The non-uniform distribution of the intelligible speech was due to the impaired direct path of the sound from the speaker (Amasuomo, 2013). Echoes experienced in the lecture halls were as a result of the time delay between the arrivals of the initial sound from the speaker and then reflected sound from the parallel walls. The presence of echoes in the halls during speech or seminar is a nuisance. Thus, echoes should be avoided.
2.5 RAPID SPEECH TRANMISSION INDEX (RASTI)
RASTI method is an objective method for rating the transmission quality of speech with respect to intelligibility (Sound System Equipment Part 16). The method is intended for rating speech transmission in auditorium, halls and room with or without the sound reinforcement system. It is economical, and time saving for each station can be evaluated either in eight, sixteen or thirty two seconds.
Rapid speech transmission index (RASTI) is a simplified version of speech transmission index (STI). A modulated test signal is fed to a loudspeaker at the talker’s location. The receiver’s microphone is positioned at the receiver location. The system gives an accurate read out of the measured RASTI value at the receiver position. RASTI can also take account of the effects of reverberation, as well as background noise (Sound System Equipment Part 16).