AIR FLOW AROUND BODIES IN SUBSONIC WIND TUNNEL
LIM FONG KIAW
This report is submitted as partial requirement for the completion of the Bachelor of Mechanical Engineering (Thermal Fluids) Degree Program
Faculty of Mechanical Engineering Universiti Teknikal Malaysia Melaka
ii
DECLARATION
“I hereby, declare this report is resulted from my own research except as cited in the references”
Signature :……….
Author’s Name : ……….
iii
DEDICATION
iv
ACKNOWLEDGEMENT
v
ABSTRACT
vi
ABSTRAK
vii
LIST OF CONTENTS
CHAPTER TOPIC PAGE
DECLARATION ii
DEDICATION iii
ACKNOWLEDGEMENT iv
ABSTRACT v
ABSTRAK vi
LIST OF CONTENTS vii
LIST OF TABLES xi
LIST OF FIGURES xii
LIST OF SYMBOLS xiv
LIST OF APPENDICES xvi
1.0 INTRODUCTION 1
1.1 Background Study 1
1.2 Problem Statement 4
1.3 Objectives 4
viii
CHAPTER TOPIC PAGE
2.0 LITERATURE REVIEW 5
2.1 Background about Airfoils 5
2.2 Airfoils Nomenclature 7
2.3 Previous Studies of Air Flow on Bodies and Airfoils 9
2.4 Computational Fluid Dynamics 10
2.4.1 Applications of Computational Fluid
Dynamics 11
2.4.2 Advantages of Computational Fluid
Dynamics 12
2.4.3 Disadvantages of Computational Fluid
Dynamics 12
2.5 Wind Tunnel 13
2.5.1 Subsonic Wind Tunnel 13
2.6 Drag and Related Equations 14
3.0 METHODOLOGY 18
3.1 Introduction 18
3.2 Experimental Setup 19
3.2.1 Description of Subsonic Wind Tunnel 19
3.2.2 Experimental Procedures 21
3.3 CFX Computational Fluid Dynamics 23 3.3.1 ANSYS CFX 10.0 Computational Fluid
Dynamic Software 23
3.3.2 CFD Simulation Flow Chart 25
ix
CHAPTER TOPIC PAGE
4.0 RESULTS AND DISCUSSIONS 30
4.1 Introduction 30
4.2 Simulation Results 30
4.2.1 Lift and Drag Force at Different
Angle of Attack 32
4.2.1.1 Lift and drag force with different angle of attack
at air velocity of 10 m/s 32 4.2.1.2 Lift and drag force with
different angle of attack
at air velocity of 30 m/s 33 4.2.2 Lift and Drag Force with Different
Angle of Attack at Various Air Velocities 34 4.2.3 Velocity and Pressure Profiles at Various
Air Velocity and Angle of Attack 36 4.2.3.1 Velocity and pressure profiles at
air velocity of 10 m/s 36 4.2.3.2 Velocity and pressure profiles at
air velocity of 30 m/s 39
4.3 Experimental Results 42
4.3.1 Lift and Drag Force at Different
Angle of Attack 44
4.3.1.1 Lift and drag force with different angle of attack
x
CHAPTER TOPIC PAGE
4.3.1.2 Lift and drag force with different angle of attack
at air velocity of 30 m/s 45 4.3.2 Lift and Drag Force with Different
Angle of Attack at Various Air Velocities 46 4.4 Comparison between Simulation and
Experimental Results 48
4.4.1 Comparison between Simulation and
Experimental Results for Lift and Drag Force
with Different Angle of Attack at 30 m/s 50 4.4.1.1 Discussion on Factors Affecting
the Results of Lift and Drag 51
5.0 CONCLUSION AND RECOMMENDATIONS 53
5.1 Conclusion 53
5.2 Recommendations 54
REFERENCES 55
BIBLIOGRAPHY 58
APPENDIX A 59
APPENDIX B 64
APPENDIX C 66
APPENDIX D 69
APPENDIX E 72
xi
LIST OF TABLES
NO. TITLE PAGE
3.1 Simulation feature and details 28
3.2 Various air inlet velocity settings for CFD simulation 29 4.1 Simulation Results for NACA 2412 and NACA 4412 31 4.2 Experimental Results or NACA 2412 and NACA 4412 43 4.3 Percentages error of lift and drag force for NACA 2412
xii
LIST OF FIGURES
NO. TITLE PAGE
1.1 Drag coefficients of blunt and streamlined body 2 (Source: Munson et al. (2006))
1.2 Drag coefficients of various bodies 3
(Source: http://www.centennialofflight.gov)
2.1 Phillips Patented Aerocurves – 1884 and 1891 6 (Source: http://www.desktopaero.com/appliedaero/airfoils1/
airfoilhistory.html)
2.2 Airfoils nomenclature 7
(Source: Ress. (1962))
2.3 Schematic diagram of closed circuit subsonic wind tunnel 14 (Source: http://en.wikipedia.org/wiki/Subsonic_and_transonic_
wind_tunnel#Subsonic_tunnel)
2.4 Schematic diagram of opened circuit subsonic wind tunnel 14 (Source: http://en.wikipedia.org/wiki/Subsonic_and_transonic_
wind_tunnel#Subsonic_tunnel)
3.1 Schematic drawing of airfoils. (a) NACA 2412. (b) NACA 4412 19 3.2 Subsonic Wind Tunnel, Downstream Fan in UTeM 20
(Source: http://www.essom.com/productslist.php?p_id=157)
3.3 Schematic diagram of Subsonic Wind Tunnel 21
3.4 Displays the oncoming wind direction as well as angle of attack 22
3.5 CFD Simulation Flow Chart 25
xiii
NO. TITLE PAGE
3.7 Four planes of wind tunnel test section as FreeWalls Boundaries 28 4.1 Forces with air velocity of 10 m/s at different angle of attack 33 4.2 Forces with air velocity of 30 m/s at different angle of attack 34 4.3 Forces versus angle of attack at various air velocities 35 4.4 Velocity and pressure profiles at air velocity of 10 m/s and
the angle of attack, α = 0° 37
4.5 Velocity and pressure profiles at air velocity of 10 m/s and
the angle of attack, α = 20° 38
4.6 Velocity and pressure profiles at air velocity of 10 m/s and
the angle of attack, α = 50° 39
4.7 Velocity and pressure profiles at air velocity of 30 m/s and
the angle of attack, α = 0° 40
4.8 Velocity and pressure profiles at air velocity of 30 m/s and
the angle of attack, α = 20° 41
4.9 Velocity and pressure profiles at air velocity of 30 m/s and
the angle of attack, α = 50° 42
4.10 Forces with air velocity of 10 m/s at different angle of attack 45 4.11 Forces with air velocity of 30 m/s at different angle of attack 46 4.12 Forces versus angle of attack at various air velocities 47 4.13 Comparison between experimental and simulation results
xiv
LIST OF SYMBOLS
A = Reference/characteristic area of the body (planform area for airfoils) AV = Wetted area of the body
a = Speed of sound (m/s) b = Wing span
CD = Drag coefficient
CL = Lift coefficient
CDp = Pressure or form drag coefficient
CDv = Viscous or skin friction drag coefficient
c = Mean chord length
FD = Total drag force on the body
FL = Lift force on the body
L = Characteristic length chord length (m) M = Mach number
R = Specific gas constant, which equal to 287J/kg/K Re = Reynolds number
T˚C = Atmospheric temperature in degree Celcius (˚C) U = Free stream velocity (m/s)
xv
Greek letters
ρ Density of the fluid (kg/m³)
μ Fluid dynamic viscosity (Pa·s or N·s/m²)
ν Fluid kinematic viscosity (defined as ν = μ / ρ) (m²/s) k Specific heat ratio, which is usually equal to 1.4
α Angle of attack
Acronyms
CAD Computer-Aided-Design CFD Computational Fluid Dynamics
xvi
LIST OF APPENDICES
NO. TITLE PAGE
A Sample Calculations for Similarity 59
B NACA 4 Digits Series Generator Program 64
C NACA 2412 and NACA 4412 Airfoils Drawings 66
D Specifications of Subsonic Wind Tunnel 69
1
CHAPTER 1
INTRODUCTION
1.1 Background Study
According to Finnemore and Franzini (2002), a body that immersed in a moving fluid, experiences a resultant force due to the interaction between the body and the completely surrounded fluid. This is one of the flow classifications of aerodynamics (which is a branch of dynamics concerned with studying the air motion), named as external flow as well as internal flow. The forces arising from that relative motion are known as drag and lift which is resolved along the tangential and the normal direction to the surface respectively.
2
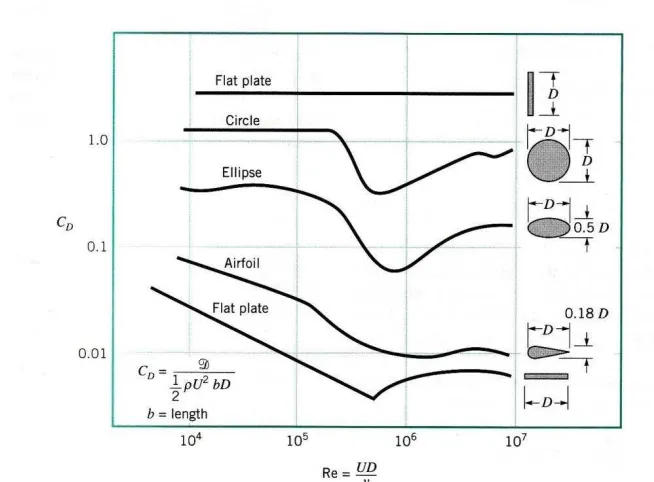
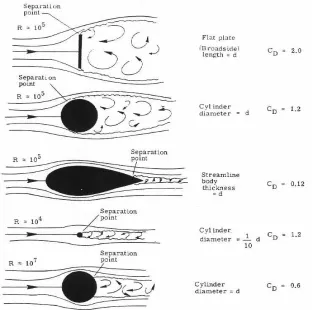
[image:18.612.145.472.292.533.2]However, from the statement (Finnemore et al. 2002) mention that the drag force can be reduced by streamlining a body. By delaying the boundary layer separation, the pressure drag is reduced and the frictional drag is increased by increasing the surface area. For the streamlined body, the drag is almost entirely due to friction drag by which will only increase the surface area and thus the total drag (sum of the friction drag and pressure drag). By other means that the bodies shape can be classified into blunt/bluff body (sphere, building and etc.) and streamlined body (aerofoil, racing car and etc.) which have a different in drag force and thus its drag coefficient. Some instances of drag coefficients of blunt and streamlined body versus Reynolds number is shown as in Figure 1.1 and the drag coefficients of various bodies as shown in Figure 1.2.
Figure 1.1: Drag coefficients of blunt and streamlined body versus Reynolds number (Source: Munson et al. (2006)).
3
Figure 1.2:Drag coefficients of various bodies (Source: http://www.centennialofflight.gov)
Furthermore, the drag and lift coefficient are primarily function of the shape of the body, but they also may depends on the Reynolds number, the Mach number and the surface roughness. From Finnemore and Franzini (2002), for a subsonic flow (low speed flow), a streamlined body which has a rounded-nose and a long, tapered afterbody (its streamlining must be given to the rear end or downstream part as well as to the front), produces the least disturbance.
4
1.2 Problem Statement
To solve the drag force problem on such bodies like turbine blade, aircraft wings or vehicles, it is important that the drag should be reduced since the increase in drag force will tend to affect the performance to become lower due to larger air resistance and also will increase its fuel consumption. Thus, the Computational Fluid Dynamics will be utilized to overcome this higher drag force problem and then to get a better result on design and optimize its performance. This simulation result also will be validated with the wind tunnel test result.
1.3 Objectives
The objectives of this project are to determine the drag force around streamlined body. To achieve this aim, experiment was conducted on two prototype airfoil models. In addition to that, the experiment was performed to validate the simulation data that was developed using CFX software.
1.4 Scopes
5
CHAPTER 2
LITERATURE REVIEW
2.1 Background about Airfoils
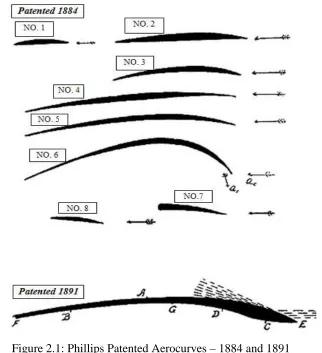
In the late 1800’s, the earliest work on the development of airfoil sections had been started. It was known that flat plates may produce lift at an angle of incidence (which is also named as angle of attack). However, some suspected that shapes with a curvature would produce more lift and more efficient due to its shape resembled to the bird wings. In 1884, a series of airfoil shapes as shown in Figure 2.1, had been altered by H.F. Philips (1845-1926) after the earliest wind tunnel testing in which the artificial of air produced from a steam jet in a wooden trunk or conduit. In 1893, he constructed a large device (sustainers which is also known as airfoils) for the effective lift testing. According to Octave Chanute in 1893, the success and failure of a flying machine will depend upon the sustaining effect between a plane and a curve surface to get a maximum lift.
6
[image:22.612.173.495.193.546.2]resembled Lilienthal’s thin and highly cambered sections to do some of the earliest research on the most effective airfoil (which is a curvature or camber of wing). At an extremely low Reynolds number, such sections behave much better than thicker ones. But there was some of the first airplanes were biplanes because of the wrong belief that efficient airfoils had to be thin and highly cambered.
Figure 2.1: Phillips Patented Aerocurves – 1884 and 1891
(Source: http://www.desktopaero.com/appliedaero/airfoils1/airfoilhistory.html)
7
made to provide data that may be directly employed for a rational choice of the most suitable airfoil section for a given application. Thus, the NACA airfoils became widely used, for example, the NACA 2412 continued in use on some light aircrafts more than half a century later (Jacobs et al. 1933). In 1939, the first laminar flow airfoil sections which had extremely low drag and achieved a lift drag ratio of about 300 had been designed and tested by Eastman Jacobs at NACA in Langley.
Nowadays, most of the airfoils are normally designed especially for their intended application, such as the wing of aircraft, shape for sail or blade of a propeller, rotor or turbine.
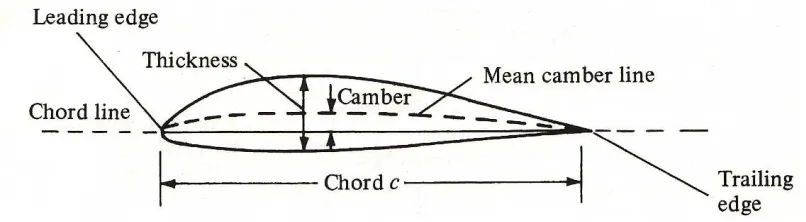
[image:23.612.123.526.384.495.2]2.2 Airfoils Nomenclature
Figure 2.2: Airfoils nomenclature (Source: Ress. (1962))
8
The leading and trailing edges are the most forward and rearward point of the mean camber line respectively. The straight line connecting the leading and trailing edges is the chord line of the airfoil. The precise distance from the leading to the trailing edge measured along the chord line is simply designated the chord c of the airfoil. The camber is the maximum distance between the mean camber line and the chord line, measured perpendicular to the chord line. The thickness is the distance between the upper and lower surfaces, also measured perpendicular to the chord line. The shape of all standard NACA airfoils are generated by specifying the shape of the mean camber line and then wrapping a specified symmetrical thickness distribution around the mean camber line (Aderson, 2001).
The NACA identified different airfoil shapes with a logical numbering system. However there are several families of NACA airfoils, such as “four-digit” series, “five-digit” series, “6-series”, “7-series” and “8-series”. The six, seven and even eight series were designed to highlight some aerodynamic characteristic.