accredited by DGHE (DIKTI), Decree No: 51/Dikti/Kep/2010 29
Migration from Gasoline to Gaseous Fuel for Small-scale
Electricity Generation Systems
Seno D. Panjaitan1, Yandri2, Sukandar3, Berlian Sitorus4 1,2
Department of Electrical Engineering, Tanjungpura University, Indonesia Jl. Prof. Hadari Nawawi, Pontianak 78124, Ph./Fax: +62-561-740186
3
School of Environmental Engineering, Bandung Institute of Technology, Indonesia Jl. Ganesha 10, Bandung, Ph./Fax: +62-22-2502647/2530704
4
Department of Chemistry, Faculty of Mathematics and Natural Science,Tanjungpura University, Indonesia Jl. Prof. Hadari Nawawi, Pontianak 78124, Ph./Fax: +62-561-585343
e-mail: [email protected], [email protected], [email protected], [email protected]
Abstrak
Paper ini memaparkan sebuah studi yang memberikan pertimbangan untuk mengubah sumber bahan bakar untuk generator listrik dari bensin menjadi gas. Perbandingan unjuk kerja generator dilakukan terhadap bahan bakar bensin dan gas berdasar parameter-parameter listrik terukur dan konsumsi bahan bakar yang digunakan. Dalam eksperimen, dua tipe beban diujikan yaitu resistif dan resistif-induktif. Dengan mengoperasikan generator menggunakan kedua bahan bakar bensin dan gas, keduanya memiliki faktor daya (Cos φ) lebih besar dari 0,8 untuk beban resistif-induktif dan memiliki hanya sedikit perbedaan pada tegangan operasi. Kekurangan bahan bakar gas adalah frekuensi listrik yang nilainya di bawah standar yaitu 50 Hz. Pada eksperimen skala lab, konsumsi bensin meningkat proporsional dengan peningkatan beban, sementara itu konsumsi gas meningkat dengan rata-rata 100 gram per 15 menit operasi pada beban yan diujikan. Keuntungan utama menggunakan bahan bakar gas (liquiefied petroleum gas) jika dibandingkan dengan bensin adalah emisi gas yang bersih setelah pembakaran.
Kata kunci: biogas, energi, konversi, generator gas, liquefied petroleum gas
Abstract
This paper describes a study that gives a consideration to change fuel source for electriccity generator from gasoline to combustible gas. A gaseous fuel conversion technology is presented and its performance is compared with gasoline. In the experiment, two types of load were tested, resistive and resistive-inductive. By using both fuels mostly the power factor (Cos φ) of resistive-inductive load variations were greater than 0.8, and they had slight difference on operational voltage. The drawback of using gaseous fuel is the frequency of the electricity might be not reach the standard frequency (i.e. 50 Hz). In the lab scale experiment, the gasoline consumption increased proportionally with the load increase, while using gaseous fuel the consumption of gas equal also increased where the average consumption value is 100 gram per 15 minutes operation for the tested load in the experiment. The main advantage using gaseous fuel (liquefied petroleum gas or biogas) compared to gasoline is a cleaner emitted gas after combustion.
Keywords: biogas, energy, conversion, gas driven generator, liquefied petroleum gas
1. Introduction
1.1. Gasoline and Gaseous Fuel
has different properties regarding caloric value, vapor pressure and boiling point. Propane (C3H8) is the main constituent of LPG as it is a single, relatively simple species so engines could have combustion process cleanly. It has density of 1.779 Kg/m3 at Standard Temperature and Pressure (STP), molecular weight of 44, ratio Stoich air/fuel is 15.7, and Lower Heat Value of 46.33 MJ/Kg. Besides, it can be stored at atmospheric pressure so there are no evaporative losses. Propane has a good volumetric energy content and road octane number of more than 100. The main advantage of using combustible gases as fuel compared to gasoline is a cleaner emitted gas after combustion, while the output power seemed similar. The LPG nowadays existing abundantly and inexpensively in the developing countries such as in Indonesia, wherein the transformation from using fossil fuel into gas has been encouraged by the government. Another combustible gas coulbe be produced from anaerobic digestion of organic compounds in wastewater or solid waste, from which the pollutant could harm the environment once they are casted out without further treatment. Therefore, using wastes as source of electrical generation system by converting them into biogas will bring two benefits: renewable energy source and environmental friendly technology.
1.2. Conversion of Gaseous Fuel into Electricity
Some previous researches on biogas-powered electricity generation presented in [4-7]. According to [4], the power output of the biogas is directly proportional to the consumption of biogas, and therefore modulation of the output power is the key to ensure the voltage will not vary in the distribution system. Mixture control system for biogas-gasoline dual-fuel engines is discussed in [5]. The system adopted electronic control unit (ECU) and applied micro control unit (MCU) as the main component. Fuel supply control in the system used a valve that was set by stepper motors. Meanwhile, in [6], [7] resistive (R) load utilized as load testing. A miniature of the gasoline generator was modified by increasing the compression ratio: regulate the ignition angle, desulfurization components, gas pressure stabilizer and mixing unit.
Furthermore, qualitative and quantitative analysis on biogas generation system using an induction motor-based generator set is presented in [8], meanwhile bibliographic application of induction generators for nonconventional energy systems is presented in [9]. General analysis of biogas from landfill was briefly presented in [10] without any supporting data, while analysis of biogas process through modeling, numerical or simulations was presented in [7, 11-14].
From the mentioned references, biogas generation process could be carried out through the combustion system. Therefore, application of a commercial generator set to convert biogas into electricity requires some modifications aprticularly in combustion systems and gas pressure control. An important aspect need be considered in order to have a perfect combustion process is the biogas purity. Additionally, the gas pressure must be set to consider the varying load. This paper presents the study results of hands-on experience in conversion of combustible gas into electricity. It is a preliminary research regarding a micro scale biogas to electricity generation system using modified generator set in order to feasibly applied in a separate area community especially in developing countries.
2. Materials and Methods
2.1. Preparation of Material and Equipment
Gasoline and LPG were used for testing the conversion process and analyze some electrical parameters. Several load variations were determined by approximation since it could not be the same with theoretical computation. An amount of 250 ml gasoline was used for each testing while for the gas, commercial LPG 3 Kg was used. A commercial generator set (YASUKA) with maximum power capacity 1000 watt and average power capacity of 850 watt was used for the testing. There is no modification needed for testing generator run by gasoline since it used the original carburetor. Meanwhile for testing using gaseous fuel, the generator used gas combustion system as the modification of the original carburetor.
2.2. Experimental Design
In the experiment, electrical generation system used a generator set with maximum average power 850 watt with the original combustion using gasoline. The experiment compared the consumption of gasoline and gas in conversion to the electricity. There were two variations of load types in the experiment, i.e. R and R-L. The load values were performed by setting the value of resistance and resistance-inductance. Lab scale variable resistance was used to simulate the R load such as lamps (bulb) while for R-L load, a water pump was taken into account. There were some parameters measured in this experiment: resistance (Ohm or Ω), active power (watt or W), reactive power ampere reactive or VAR), apparent power (volt-ampere or VA), voltage (volt or V), current ((volt-ampere or A), frequency (hertz or Hz), fuel/gas consumption (liter/gram), rotor speed (rotary per minute or rpm), and power factor (Cos φ).
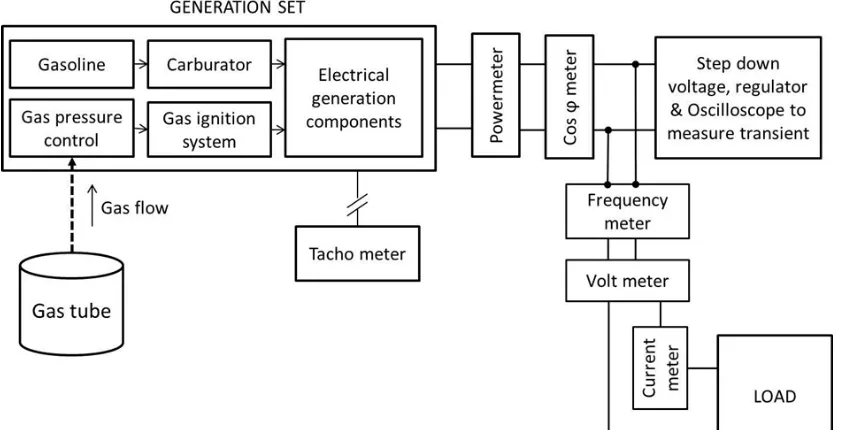
Figure 1 shows the experiment design in which some equipments were needed to measure the required parameter values mentioned above. The experiment was carried out in Control System Laboratory, Tanjungpura University, Pontianak, Indonesia. Power meter measures active, reactive and apparent power while Cos φ meter was measured the power factor (the best value was one). In order to analyze the response, the signal should be turned down and converted into direct current, then the oscilloscope recorded the transient. Frequency, voltage and current were also measured and analyzed to investigate the quality of the signals. Furthermore, the rotor speed of rotor was also measured by using tacho meter.
Figure 1. Experimental setup for testing gasoline and combustible gas as source of electrical generation
Other experiment was the procedure using gasoline which was as follows: the generator set was filled with 250 ml gasoline, equipment was set for measurement, approximate value was set for load variations (two variations: about quarter and half of full load). The generator was turned on and the electrical parameters consisted of voltage, current, frequency, rotor speed, and rise time were measured and the generator ran until it automatically turned off because no more fuel inside. The duration was measured by stopwatch.
3. Results and Discussion 3.1. Experiment using Gasoline
The experiment variation was carried out based on the fuel and load types. For the gasoline, the experiment was done by using 250 ml for each condition of load (Table 1 and 2). To determine the approximation of load value, the following computation was performed.
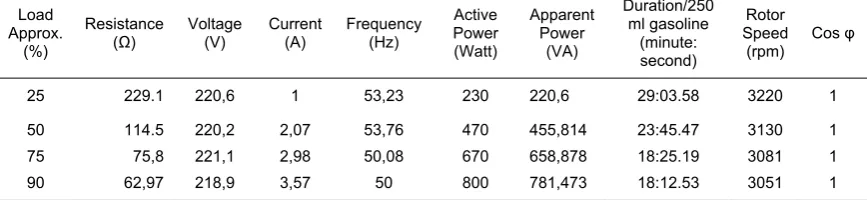
For the load value in Table 1, the variable load resistance (R) had maximum current (IRmax) of 3 A, while maximum current of generator (IGmax) was 4 A. If the voltage (V) was about 220 Volt, the resistance minimum for the experiment based on constraint of the load was RRmin = V/IRmax = 73.33 Ω while with constraint of maximum current of generator, RGmin = V/IGmax = 55 Ω. With average load of the operated generattor (850 watt), we can find the resistance based on the 25%, 50%, 75% and 100% of the average load that should be set arround the follow values: R25% = V2/212.5 = 227.76 Ω; R50% = V2/425 = 113.88 Ω; R75% = V2/637.5 = 75.92 Ω; R100% = V2/850 = 56.94 Ω. It can be seen that, theoretically the resistance for full load (R100%) could not be tested since it is less than RRmin and only slightly above RGmin which could make the operation of generator quite heavy. Therefore the testing was performed by using 90 % of average load, R90% = V2/765 = 63.26 Ω. In the experiment, the value resistance depicted in Table 1 has slightly difference (∆R = resistance based on theoretical computation – resistance as result of measurement) as follows: ∆R25% = - 1.34 Ω; ∆R50% = - 0.62 Ω; ∆R75% = 0.12 Ω; ∆R90% = 0.29 Ω. Based on these difference values, it can be concluded that the less load results the more negative difference, whereas the higher load results more positive difference.
In Table 1, there is also very slight difference between the standard voltage (i.e. 220 V) and frequency (i.e. 50 Hz) with the real measurement. For the running duration of generator, it shows that the higher load value the faster was the 250 ml gasoline consumed. The power factor (Cos φ) shows the value of one since the type of load used was R which has no inductive effect in the system. However, based on the theoretical calculation related active, reactive and apparent power it shows the power factor slightly difference with the measurement (Cos φ for all load variation is 1) which could be caused by the mechanical and electrical effect of the measuring equipment.
Table 1. Experiment results with gasoline fuel of generation set and R load
Load
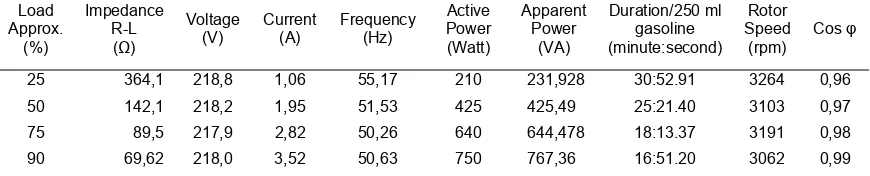
In table 2, the calculation of load variation is almost the same with Table 1. The difference is the availability of inductance and then the load type is inductive (L). Generally, it shows the similar characteristic with the R load by means of the curve of impedance value. The higher load percentage is considered, the impedance value becomes lower. The difference value of voltage and frequency is higher than the standard (220 V and 50 Hz). Meanwhile, based on the theoretical calculation, the power factor (Cos φ25% = 0.96; Cos φ50% = 0.97; Cos
Table 2. Experiment results with gasoline fuel of generation set and R-L load
3.2. Experiment using Gaseous Fuel
Table 3 shows the experiment results using gaseous fuel with R load and two variation of load value (i.e. 25 % and 47.05%). Two variation of load value was determined since the combustion process in the modified generator, which was originally from gasoline generator set, constrained the load less than 50%. It might be caused by the dimension of the gas line in the combustion system that needs to be made bigger. However, the two variations should simulate the use of biogas which potentially to be scaled up in the future. In Table 3, it shows that the difference frequency with the standard (i.e. 50 Hz) is quite high. However, the power factors show good value swhich are above 0.9 and the gaseous fuel consumption in 15 minutes running was the same either for 25% or 47.05 % load, which was 100 gram.
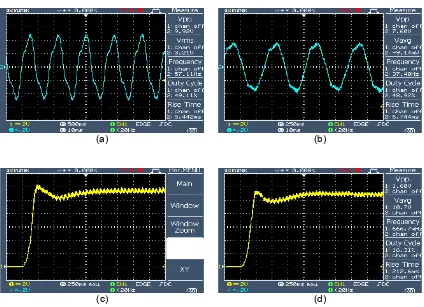
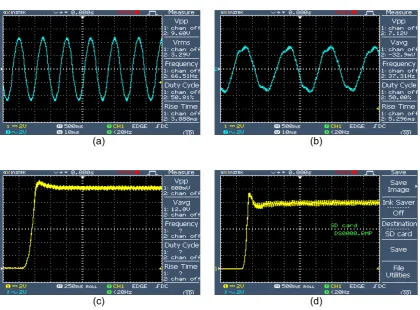
Figure 2 shows the experiment results of R load using gaseous fuel for generating system. Figure 2(a-b) depicts the voltage signal of 25 % and 47.05 % R load respectively. To be measured and displayed by oscilloscope, the original signal was stepped down with scale 2V/div. The voltage peak-to-peak (VPP) of 25% R load is 9.92 V (about 4.3 % of 228.1 V) and 50% R load is 7.6 V (about 3.5 % of 205 V). It can be seen a little ripple at both signal, where the signal of 47.05 % R load is better than the other one. Furthermore, the rise time of alternating current (AC) in Figure 2(a) is 5.442 ms for 25 % R load which is faster than 47.05 % R load (i.e. 6.744 ms). For direct current (DC), the rectification of AC signal was carried out to analyze the rise time. Figure 2(c-d) depicts the rise time for both loads. The rise time of DC signal at 25% R load is 211 ms which is faster than 47.05 % load (i.e. 212.6ms), but the overshoot of the first signal is higher than the second one.
Table 3. Experiment results with gaseous fuel of generation set and R load
Load
(a) (b)
(c) (d)
Figure 2. Experimental results with gaseous fuel for R load: (a) stepped down sinusoidal signal of 25% load, (b) stepped down sinusoidal signal of 47.05% load, (c) DC rise time of 25% load,
(d) DC rise time of 47.05 % load.
Figure 3 shows the experiment results of R-L load using gaseous fuel for generating system. Figure 3(a-b) depicts the voltage signal of 10.6 % (i.e. a water pump) and 40.2 % R-L load (i.e. water pump and resistive load) respectively. VPP of 10.6 % R-L load is 9.6 V (about 4.2 % of 227.1 V) and 40.2 % R-L load is 7.12 V (about 3.45 % of 206.3 V). There is a little ripple at both signals, where the signal of 40.2 % R-L load is better than the other one. The rise time of alternating current (AC) in Figure 3(a) is 3.888 ms for 10.6 % R-L load which is slower than 40.2 % R-L load (i.e. 5.296 ms). For direct current (DC), Figure 2(c-d) depicts the rise time for both loads. The rise time of DC signal at 10.6 % R-L load is 231 ms which is slower than 40.2 % load (i.e. 221 ms), but the overshoot of the first signal is higher than the second one. Furthermore, Figure 3(a) shows the perfect sinusoidal signal which has no ripple.
Table 4. Experiment results with gaseous fuel of generation set and R-L load
Load Approx.
(%)
Resistance (Ω)
Voltage (V)
Current (A)
Frequency (Hz)
Active Power (Watt)
Apparent Power
(VA)
Gas consumption in 15 minutes
(gram)
Rotor Speed
(rpm)
Cos φ
10.6 504.67 227.1 0.45 58.34 90 102.195 100 4142 0.89
(a) (b)
(c) (d)
Figure 3. Experimental results with gaseous fuel for R-L load: (a) stepped down sinusoidal signal of 10.6 % load, (b) stepped down sinusoidal signal of 40.2 % load, (c) DC rise time of
10.6 % load, (d) DC rise time of 40.2 % load.
3.3. Comparison of Gasoline and Gaseous Fuel
The power factor of some load variations either with gasoline or LPG were greater than 0.8 and they also had slight difference of voltage with the standard (i.e. 220 V). The drawbacks of using gaseous fuel were the deviation of frequency could be up to 10 Hz and could run in less than 50% of average power while with gasoline the generation could reach 90% of average power. In order to consider gas generation system, a frequency control and an accurate gas pipe dimension were needed. Therefore, the use of gaseous generation system should have an average power twice than the required load. However, the main advantage using gaseous fuel (liquefied petroleum gas or biogas) compared to gasoline is a cleaner emitted gas after combustion. This advantage deals with environmental issue in energy conversion, where the producing of energy such as electricity could in the same time solve some enviromental problems, such as air pollution, municipal solid waste and waste water either domestic or from industrial processes.
4. Conclusions
This paper has been elucidated the investigation of migration from gasoline to gaseous fuel based generator for electricity generation system. Technically, the use of gasoline has higher limit of operated load value than using gaseous fuel. Therefore, the use gaseous fuel for electricity generator with modification of gasoline to gas combustion system to the should consider limit of maximum load of teh generator higher than the load value in plant for safety operation. However, two main advantages of using gasesous fuel, lower operation cost and lower emission are important reasons for the conversion technology migration. Furthermore, another gas produced by anaerobic digestion of highstrength wastewater or municipal organic solid waste is also prospective for the sustainable supply of gaseous fuel in the next generation of electricity generation system. This will produce renewable energy that also solve the enviromental problem.
Acknowledgements
The authors would like to thank Indonesian Ministry of Research and Technology that provided research grant in scheme Insentif Riset Sistem Inovasi Nasional (Research Incentive for National Inovation System).
References
[1] Atia DM., Fahmy FH, Ahmed NM, Dorrah HT. Modeling and Control PV-Wind Hybrid System based on Fuzzy Logic Control Technique. TELKOMNIKA. 2012; 10(3):431-441.
[2] Atia DM., Fahmy FH, Ahmed NM, Dorrah HT. A New Control and Design of PEM Fuel Cell Powered Air Diffused Aeration System. TELKOMNIKA. 2012; 10(2):291-302.
[3] Muhammed YES. Combustion Noise Knocking Limits of Dual Fuel Engines Using Gaseous Fuel. U.A.E. University. 2000.
[4] Zhang Y, Kang L, Cao B, Huang C, Wu G. Simulation of Biogas Generation. IEEE Conf. on Transmission & Distribution Conference & Exposition: Asia and Pacific. 2009; 1-5.
[5] Su C, Ye S, Wei C, Xie M. The Design and Study on the Mixture Control System of the Biogas-Gasoline Dual-fuel Engine. IEEE International Conference on Materials for Renewable Energy & Environment (ICMREE). 2011; 1: 517-520.
[6] Shi L, Rang G, Huang Z, Zhang R. Refitting Design of Miniature Biogas Generating System. IEEE Conference on Consumer Electronics, Communications and Networks (CECNet). 2011; 1544-1547. [7] Jiang Y, Xiong S, Shi W, He W, Zhang T, Lin X, Gu Y, Lv Y, Qian X, Ye Z, Wang C, Wang B.
Research of Biogas as Fuel for Internal Combustion Engine. Power and Energy Engineering Conference. 2009; 1-4.
[8] Li W, Ping-Yi L. Analysis of a Commercial Biogas Generation System Using a Gas Engine–Induction Generator Set. IEEE Transactions on Energy Conversion. 2009; 24(1): 230-239.
[9] Bansal RC, Bhatti TS, Kothari DP. Bibliography On The Application Of Induction Generators In Nonconventional Energy Systems. IEEE Transactions on Energy Conversion. 2003; 18(3): 433-439. [10] Garcilasso VP, Velazquez SMSG, Coelho ST, Silva, LS. Electric Energy Generation From Landfill
Biogas — Case Study And Barriers. International IEEE Conference on Electrical and Control Engineering (ICECE). 2011; 5250-5253.
[11] Zhijun L, Yu Y, Xiujuan B. Simulation and Analysis of the Third-order Model of Synchronous Generator based on MFC. International Conference on Mechatronics and Automation. 2009; 4252-4256.
[12] Bardi S, Astolfi A. Modeling and Control of a Waste-to-Energy Plant [Applications of Control]. IEEE Transaction on Control System. 2010; 30(6): 27-37.
[13] Jiasheng G, Chaokui Q, Schmitz G. Numerical Investigation on the Performance of Spark Ignition Engine used for Electricity Production Fuelled by Natural Gas/Liquefied Petroleum Gas-biogas Blends with Modelica. 2nd International Conference on Computer Engineering and Technology (ICCET). 2010; 6(2): 682-687.
[14] Xu Z. Model And Performance for Direct Supplying Energy System by Biogas. International Conference on New Technology of Agricultural Engineering (ICAE). 2011; 751-754.
[15] Bambang Y. Pengujian Mesin Disel (genset) dengan Sistem Bahan Bakar Ganda Solar-LPG. Rotasi