DOI: 10.12928/TELKOMNIKA.v13i2.1468 730
Research on Beef Skeletal Maturity Determination
Based on Shape Description and Neural Network
Xiangyan Meng*, Yumiao Ren, Haixian Pan
College of Electronic Information Engineering, Xi’an Technological University, 710032, China *Corresponding author, e-mail: [email protected]
Abstract
Physiological maturity is an important indicator for beef quality. In traditional method, the maturity grade is determined by subjectively evaluating the degree of cartilage ossification at the tips of the dorsal spine of the thoracic vertebrae. This paper uses the computer vision to replace the artificial method for extracting object (cartilage and bone) regions. Hu invariant moments of object region were calculated as the regional shape characteristic parameters. A trained Hopfield neural network model was used for recognizing cartilage and bone area in thoracic vertebrae image based on minimum Euclidean distance. The result showed that the accuracy of network recognition for cartilage and bone region was 92.75% and 87.68%, respectively. For automatically maturity prediction, the accuracy of prediction was 86%. Algorithm proposed in this paper proved the image description and neural network modeling was an effective method for extracting image feature regions.
Keywords: Beef Skeletal Maturity, Image Processing, Invariant Moments, Neural Network
1. Introduction
Standardization of meat products can facilitate marketing and merchandising. For the majority of beef cattle slaughtered in the United States, carcass value has three determining factors: weight, evaluation of intramuscular fat and physiological maturity, and estimate of the percentage yield of salable meat product [1],[2]. The European Beef Carcass Grading system takes into account carcass conformation and fattness [3]-[5]. The drawbacks of visual inspection are inconsistence and variations, because grading results may differ according to subjective experience of each expert meat grader. So the beef processing enterprises is hard to provide the consumers with meat products of consistent quality. For detection of quality degree of beef carcass, researches in this area began in the early 80s. Many people have studied on the detection of beef marbling, muscle color and fat color by computer vision [6]-[8]. Some previous research show that only few people had carried out the research on image automated segmentation algorithm for cartilage and bone areas and the automatic identification of skeletal maturity grade. Yield quality assessment by image processing started with the work by Hatem [9],[10], he studied the segmentation method based on HSL and CIELab color space transformation, and discussed image recognition method of skeletal maturity. Lean yield estimation system such as CVS system of USA, has been used in actual production [11]. Liu Muhua, et al.[12] used Ohta color system for automated segmentation of the cartilage and bone areas in the thoracic vertebrae images.
2. Methods
indicators for segmentation of cartilage and bone area, and Hopfield network was used to automatic index and recognition of target area.
2.1. Segmentation of cartilage and bone area
To identify the degree of ossification precisely, both cartilage area and bone area should be considered as important objects. Before extracting the features of indicators, cartilage and bone area should be separated from the thoracic image, respectively. Sometimes, it is difficult to separate the object area from surrounding area because of similarity of color. Especially cartilage has similar color with fat, and bone has the similar color with muscle. Besides, the cartilage color for same maturity may be different among animals raised on different diet [9]. So a good segmentation effect can’t be obtained with the color threshold segmentation method. According to this characteristic, color and shape of cartilage area and bone area are selected as the dictator of degree of ossification.
(1) Selection and calculation of shape parameters
An effective shape descriptor is a key component of multimedia content description, since shape is a fundamental property of an object. The invariant moment of cartilage region was selected to describe the shape characteristics.The two-dimensional moments of a gray function f(x,y) through order (j+k) is defined as,
Where, j+k is the order of moment. Because color features alone were not sufficient to isolate the cartilage and bone region, many regions with such color features resulted. In order to isolate the target region accurately, shape parameter were proposed to describe its shape. The image should be transformed into binary image for processing. The central moment of region was calculated as following,
Normalizing central moment,
moment. In terms of central moments, even moments defined by Hu(1962), which are invariant to object scale, position, and orientation, are given as,
(2) Segmentation methods of objective region
To reduce the computational complexity for neural network recognition and computation of invariant moment, noises and background should be removed in the image.
1) Pre-segmentation based on color
According to the characteristics of image (seen from Figure 2.(a)), separating operation will be conducted to cartilage area and bone area. The first step in color was designed to separate the objective region. For cartilage area, in which the grayscale value of R(red) >200, and average value and standard deviation of R,G(green), and B(blue) frame were calculated. 2) Hole filling and filtering
In order to match the template, hole filling operation was conducted on object region. To reduce the calculation of subsequent label processing and invariant moment parameters, some non-cartilage region with small area should be eliminated from image. In this paper, region preliminary selection was operation was conducted by filtering and region labeling. Disk filter(diameter=1 pixel) was selected for smoothing filtering, because it made little influence on shape of region. Regional screening operation was to statistic the region with big area, and objective region (area >800 pixels) were preserved.
(3)Segmentation of bone area
According to the characteristics of bone area, separating operation will be conducted to cartilage area and bone area. The first step in background removal was designed to separate the region, in which the grayscale value of R(red) >200, and average value and standard deviation of R,G(green), and B(blue) frame were calculated. As shown in Figure 2.(b), the rude segmentation of cartilage area was conducted. Cartilage area and bone area were separated by color characteristics from background.
2.2. Recognition of cartilage and bone area
Because the color of cartilage and fat tissue around was highly similar, the effect of threshold segmentation method was bad. But cartilage region have different characteristic in shape. In the same way, the color of bone and meat was highly similar, and the shape characteristic was used to separate bone region from around. After large number of calculation of cartilage and bone region invariant moment parameters.
(1) Hopfield network model establishment
The Hopfield neural network is a form of recurrent artificial neural network by John Hopfield. It has different characteristics from other network in network structure and learning method. Hopfield network can simulate the biological neural memory mechanism. So it’s very suitable for retrieval and recognition. Learning rule of Hopfield network is to find the connection weight among different neurons. Hebbian learning rule is selected as the learning method of network. The rule of weight adjustment procedure is that, firstly, the connections between the units are weighted; wij is the weight of the connection from unit j to unit i.
j
memory systems with binary threshold units. But in this paper, characteristic parameters are difficult to convert to binary vector, so the input vector was invariant moment parameters vector. 40 vertebra images were used for features extraction and neural network training.(2)Stability test
complication. Distance between original template invariant moment parameters vector and transformed template invariant moment parameters vector was calculated, and result was shown in table 1. Seen from the table, similarity measure between original template and transformed template was high. The result showed that the shape parameters were selected reasonable.
Table 1. Similarity measure between original template and transformed template
Transform template1 template 2 template 3 template 4 template 5 template 6 vertical flip 0 0.009 0.0558 0.0174 0.0607 0.0026 horizontal flip 0 0.009 0.0558 0.0174 0.0607 0.0026 Reduction 0.0175 1.00E-04 7.68E-04 5.20E-04 6.00E-04 0.0017 Edge complication 0.0099 0.0088 0.029 0.0096 0.0129 0.0285
(3) Region recognition and segmentation
Accurate segmentation of the cartilage area is premise of correct classification of degree of cartilage ossification. According to pictures of beef dorsal vertebra, 6 templates of cartilage and 6 templates of bone was selected. And then shape characteristic (invariant moment parameters) of template were calculated. The Euclidean distance between shape characteristics of sample and templates was calculated as following:
]
Where, di presents the shortest distance between the i -th sample characteristic vector and
template characteristic vector; Xi is the characteristic vector of measuring region, Xi=[x1, x2,
x3,…, x7]; Mn is the characteristic vector of template, Mn=[m1, m2, m3,…, m7].
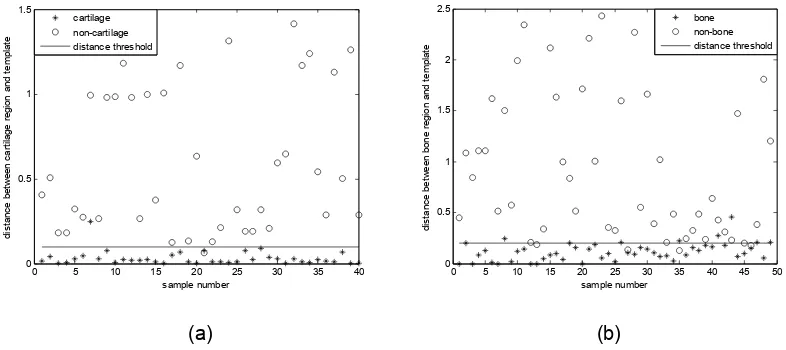
Region matching and recognition was accomplished by neural network. Matching method is minimum distance method. Before recognition, a distance threshold was selected to judge if the region is the cartilage or bone region. If distance between sample characteristic and template characteristic is less than threshold, the region is target region, and vice versa. Labeling number of target region was saved and used to subsequent feature extraction.
0 5 10 15 20 25 30 35 40
Figure 1. Similarity measure between segmented region and template
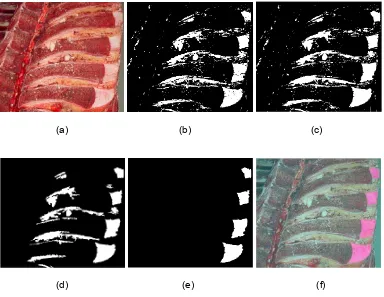
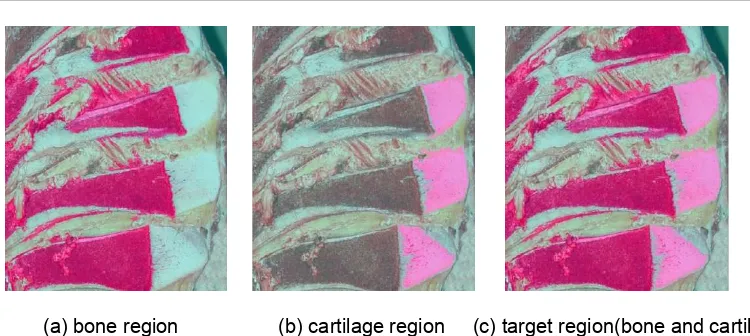
calculated, the distance threshold is determined as 0.1 for cartilage region and 0.2 for bone region (seen from Figure 1(a), and Figure 1(b)). The operations of distance calculation are accomplished by Hopfield neural network. The operation flow of region recognition and segmentation is given in the following Figure 2. Figure 3 showed the Segmentation processing results, and Figure 3.(a-d) represented the pre-treatment process of image, Figure 3.(e,f) indicated the recognition and segmentation result of cartilage region. Region recognition is the process of calculating the shortest distance, and segmentation process is to label the target region and save the labeling number. Figure 4.(a) and (b) shows the final bone and cartilage region segmented result by algorithm in this paper.
3. Segmentation result evaluation
In order to eliminate the errors from cattle breeds, all images were captured in Haoyue Corp., Changchun Province, China. The objective region of example image was manually segmented from the image. Recognition accuracy and classification error[13] were selected as evaluation parameters for evaluation of object region segmentation.
%
cartilage or bone region. Region misclassification error is defined as follows:
%
where, EB is region classification error; NB/F is number of object region which is misclassified into
non-object region; NF/B is number of non-object region which is misclassified into object region;
NB is actual number of object region.
After recognition of neural network, 50 vertebra images (128 cartilage regions and 128 bone regions) were tested for segmentation evaluation. Among them, 20 images of A-maturity, 10 images of B-maturity, 10 images of C-maturity and 10 images of D-maturity. The accuracy of segmentation result was calculated by formula 13 and 14. And the result showed that the accuracy of network recognition for cartilage and bone region was 92.75% and 87.68%, respectively. The classification error of algorithm was 14.49%.
4. Skeletal maturity prediction model
Six texture features were selected, including coarseness, in contrast, degree of direction, linearity, regularity and roughness. These six attributes are vector reflects the cartilage texture features [15]. In general, high-level visual features of three kinds of attributes can be used to capture the texture, commonly used in the content based image retrieval, and better texture feature selection.
(1) Coarseness
1) It relates to distances of notable spatial variations of grey levels, that is, implicitly, to the size of the primitive elements forming the texture. The proposed computational procedure accounts for differences between the average signals for the no At each pixel (x,y), compute six averages for the windows of size 2k × 2k, k=0,1,...,5, around the pixel.
2) At each pixel, compute absolute differences Ek(x,y) between the pairs of nonoverlapping
averages in the horizontal and vertical directions.
3) At each pixel, find the value of k that maximizes the difference Ek(x,y) in either direction and
set the best size Sbest(x,y)=2 k
.
Figure 2. The operation flow of region recognition and segmentation
(a) (b) (c)
(d) (e) (f)
Figure 3. Segmentation process of cartilage region
(a) bone region (b) cartilage region (c) target region(bone and cartilage)
Figure 4. Result of segmentation
Instead of the average of Sbest(x,y), an improved coarseness feature to deal with textures having multiple coarseness properties is a histogram characterizing the whole distribution of the best sizes over the image.
(2) Contrast
Contrast measures how grey levels q; q = 0, 1, ..., qmax, vary in the image g and to what
extent their distribution is biased to black or white. The second-order and normalized fourth-order central moments of the grey level histogram (empirical probability distribution), that is, the variance,σ2, and kurtosis,α4, are used to define the contrast: the first order moment of the grey level probability distribution. The value n=0.25 is recommended as the best for discriminating the textures.
(3) Direction degree
Degree of directionality is measured using the frequency distribution of oriented local edges against their directional angles. The edge strength e(x,y) and the directional angle a(x,y) are computed using the Sobel edge detector approximating the pixel-wise x- and y-derivatives of the image:
where ∆x(x,y) and ∆y(x,y) are the horizontal and vertical grey level differences between the
neighbouring pixels, respectively.
A histogram Hdir(a) of quantized direction values a is constructed by counting numbers
where np is the number of peaks, ap is the position of the pth peak, wp is the range of the angles
attributed to the pth peak (that is, the range between valleys around the peak), r denotes a normalizing factor related to quantizing levels of the angles a, and a is the quantized directional angle (cyclically in modulo 180o).
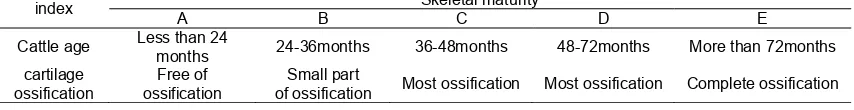
Table 2 shows the relationship between the cattle age and degree of cartilage ossification. From the table, we can see that the degree of cartilage ossification in the vertebrae is the most important indicator of skeletal maturity. For ”A” maturity, the cartilage in the thoracic vertebrae is free of ossification; and for ”E” maturity, there is completely evidence of ossification. Prediction results as shown in Figure 5. show the prediction accuracy of maturity grade.
Table 2. Relationship between thoracic vertebral cartilage bone and degree of skeletal maturity
index Skeletal maturity
A B C D E
Cattle age Less than 24
months 24-36months 36-48months 48-72months More than 72months cartilage
ossification
Free of ossification
Small part
of ossification Most ossification Most ossification Complete ossification
Figure 5. Evaluation of the degree of accuracy of cartilage
Artificial neural networks were trained to predict the maturity grades from the texture features. The neural network output was the maturity grades. The networks had two layers and the log-sigmoid function was used in each layer. The neural network was trained by using the backward propagation algorithm in Matlab. The average accuracy of prediction is 86.0%. Hatem used the hue function of the HSL color system to separate the object region, and the average accuracy of his method is 75% [9]. The result showed that the prediction accuracy of our method proved efficient. The predicted maturity grades were compared with the grades from the trained graders. The reasonably good results from the two very different sets of samples show that the procedure developed in this research is fairly robust. The method we proposed for cartilage and bone segmentation and prediction model for ossification proved useful for determining the maturity grades.
5. Conclusions
Acknowledgements
This paper is fund by the special scientific research plan project of Shaanxi Province Education Office, NO.14JK1341; The authors are grateful to Haoyue Corp., Changchun, for the assistance given with the site for this research.
References
[1] Lawrence TE, Farrow RL, Zollinger BL, Spivey KS. Technical note: The United States Department of Agriculture beef yield grade equation requires modification to reflect the current longissimus muscle area to hot carcass weight relationship. Journal of Animal Science. 2008; 86: 1434–1438.
[2] Acheson R, Woerner DR, Belk KE, Engle TE, et al. Effects of quality grade, yield grade, gender, and cattle type on the nutrient composition of retail cuts from the beef loin and round. Meat Science. 2014; 96(1): 447.
[3] Beriain MJ, Indurain G, Carr TR, et al. Contrasting appraisals of quality and value of beef carcasses in Spain and the United States. Revue Méd. Vét. 2013; 164(7): 337-342.
[4] Craigie CR, Ross DW, Maltin CA, et al. The relationship between video image analysis (VIA), visual classification, and saleable meat yield of sirloin and fillet cuts of beef carcasses differing in breed and gender. Livestock Science. 2013; 158: 169-178.
[5] Craigie CR, Navajas EA, Purchas RW, Maltin CA, Bünger L., Hoskin SO, Ross DW, Morris ST, Roehe R. A review of the development and use of video image analysis (VIA) for beef carcass evaluation as an alternative to the current EUROP system and other subjective systems. Meat
Science. 2012; 92: 307–318.
[6] Jiewen Z, Muhua L, Haidong Z. Segmentation of longissimus dorsiand marbling in ribeye imaging based on mathematical morphology. Transactions of the Chinese Society of Agricultural Engineering. 2004;20(1):143-146.
[7] Muhua L, Jiewen Z, Haidong Z.Segmentation of fat and lean meat in beef images based on fuzzy C-means clustering. Nongye Gongcheng Xuebao/Transactions of the Chinese Society of Agricultural
Engineering. 2004; 20(2): 161-163.
[8] Cannell RC, Belk KE, Wise JW, et al. Online evaluation of a commercial video image analysis system (Computer Vision System) to predict beef carcass red meat yield and for augmenting the assignment of U SDA yield grades. J Animal Science. 2002; 80(5): 1195-1201.
[9] Hatem I, Tan J. Cartilage and bone segmentation in vertebra images. Transactions of the ASAE. 2003; 46(5): 1429- 1434.
[10] Hatem I, Tan J, Gerrard D E. Determination of animal skeletal maturity by image processing . Meat
Science. 2003; 65: 999-1004.
[11] Hatem I, Tan J. Cartilage segmentation in vertebra images. 2000 ASAE Annual International Meeting, Technical Papers: Engineering Solutions for a New Century; 2000; 1: 1419-1430.
[12] Muhua L, Jiewen Z, Xiaobo Z. Auto-segmentation of cartilage and bone areas in thoracic vertebrae images .Transactions of the CSAE. 2005; 21(8): 110-113.
[13] Guanghong Z. Meat Science. China Agricultural Press. Beijing. 1999.
[14] Zhang YJ, Gergrands JJ. Segmentation evaluation using ultimate measurement accuracy. SPIE. 1992; 1657: 449-460.