THE INFLUENCE OF WORKING CAPITAL MANAGEMENT AND LIQUIDITY TOWARDS PROFITABILITY
( Case Study : Automotive and Components Industry Listed in Indonesia Stock Exchange 2008-2012)
By:
Andre Eko Saputro Julianda ID: 109081100007
MANAGEMENT DEPARTMENT INTERNATIONAL CLASS PROGRAM FACULTY OF ECONOMICS AND BUSINESSES STATE ISLAMIC UNIVERSITY SYARIF HIDAYATULLAH
CURRICULUM VITAE
PERSONAL DATA
Name : Andre Eko Saputro Julianda
Date of Birth : Padang, June 12 th 1991
Address : Kp. Bintaro RT 007 RW 002
Pesanggrahan Jakarta Selatan
Religion : Islam
Phone : 081-316-622-376
Email : [email protected]
EDUCATIONAL BACKGROUND
1. 1996–1997 : TK Dwi Satria
2. 1997 –2003 : SD Botoran 02 Tulungagung 3. 2003 –2006 : SMP Negeri 1 Padang 4. 2006 –2009 : SMA Negeri 3 Padang
5. 2009–2013 : UIN Syarif Hidayatullah Jakarta
ORGANIZATIONAL EXPERIENCE
ABSTRACT
This study aims to analyze the influence of working capital management (working capital turnover, receivable turnover, inventory turnover) and liquidity (current ratio) toward profitability (ROI) in the automotive and component companies in Indonesia Stock Exchange.
Object of this research study is a twelve automotive and components companies listed in Indonesia Stock Exchange. Financial statement data used 5 years from 2008-2012. The method is multiple regression analysis.
The results show that there is a simultaneous effect on the working capital turnover, receivable turnover, inventory turnover, current ratio toward the return on investment. In this research is founded the analysis result of the most dominant variable that is a current ratio. The coefficient of determination (adjusted R-square) of 0.161. This means that working capital turnover, receivable turnover, inventory turnover, and current ratio have accounted for 16.1% the return on investment.
ABSTRAK
Penelitian ini bertujuan untuk menganalisa pengaruh manajemen modal kerja (working capital turnover, receivable turnover, inventory turnover) dan likuiditas (Current Ratio) terhadap profitabilitas (ROI) pada perusahaan otomotif dan komponen di Bursa Efek Indonesia.
Objek studi penelitian ini adalah 12 perusahaan otomotif dan komponen yang terdaftar di Bursa Efek Indonesia.Data laporan keuangan yang digunakan adalah laporan keuangan selama 5 tahun, dari tahun 2008-2012. Metode penelitian yang digunakan adalah metode analisis regresi berganda.
Hasil penelitian menunjukkan bahwa terdapat pengaruh secara simultan pada working capital turnover, receivable turnover, inventory turnover, dan current ratio terhadap Return on Investment. Pada penelitian ini ditemukan hasil analisa variabel yang paling dominan adalah Current Ratio. Hasil koefisien determinasi (Adjusted R-square) sebesar 0.161. Hal ini berarti working capital turnover, receivable turnover, inventory turnover, dan current ratio memiliki kontribusi sebesar 16.1 % terhadap Return on Investment. Kata Kunci : Working Capital Turnover, Receivable Turnover, Inventory Turnover,
PREFACE
Assalamu’alaikumWr.Wb.
Firstly thanks to Allah SWT, because of His blessing the writer can finished this thesis. Shalawat and Salam also give to the guidance prophet Muhammad SAW also to his best friends.
Thesis entitled “The Influence of Working Capital Management and Liquidity Toward Profitability” (Case Study : Automotive and Component Industry
listing in Indonesia Stock Exchange 2008-2012). This is the final author in
completing the undergraduate program at the Faculty of Economics and Business Financial Management Department of the State Islamic University Syarif Hidayatullah Jakarta.
In this chance, the writer wants to say thanks for supporting and helping from every party. So, thankful would be for :
1. My parents always give love and compassion, and give me motivation in completing this thesis. Accompaniment of unceasing prayer in each of these steps. Thank God.
2. Prof. Dr. Abdul Hamid, MS as dean of the Faculty of Economics and Business Syarif Hidayatullah Jakarta.
3. Mr. Prof. Dr. Ahmad Rodoni as a first supervisor always motivate me and provide the best guidance to the author so that they can finish this thesis. 4. Mr. Dr. Indoyama Nasarudin, SE, MAB as a second supervisor always give
guidance for the creation of my thesis with good results.
5. Whole Lecturers and Staff Management Department International FEB UIN Syarif Hidayatullah Jakarta.
6. To my sister (Kakak Wella Anggelia Permata Sari) and my sister (Vivi Anggraini), thank you always pray and give encouragement
.
Don’t give up in finish your thesis. (Gracias)
8. Mr. Sugih, Bu Sri, Pak Dum and also Mr. Dr. Arief Mufraini thanks for support and suggestion in doing thesis
9. To my friends in Accounting International 2009, and my friends in Perbankan Syariah (Nia, Madu, and Uko)and also Mutia Risma always support me. Thanks much time we spent together. May we all succeed.
The Writer realizes there are still many shortcomings in the writing of this paper, therefore, the authors beg criticism and suggestions that are built from the readers.
Jakarta, 27 September 2013
The Writer,
TABLE OF CONTENT
Curriculum Vitae………... i
Abstract………... ii
Abstrak………... iii
Preface……….... iv
Table of Content……… vi
List of Table………... x
List of Figure………. xi
List of Graph………. xii
CHAPTER I INTRODUCTION A. Background………... 1
B. Problem Formulation………... . 10
C. Research Objectives……….. 11
D. Benefit of Research……….. 11
CHAPTER II LITERATURE REVIEW A. Working Capital Management………... 13
1. Definition of Working Capital………... .. 13
2. Factors Determining Amount of Working Capital… .. 14
3. Sources of Working Capital………... .. 16
4. Use of Working Capital………. .. 16
5. Types of Working Capital………. .. 17
7. Ratio of Working Capital Management……….. .21
B. Liquidity………. 22
1. Understanding Liquidity………. 22
2. Liquidity Ratio………... . 23
C. Profitability………... 25
1. Understanding Profitability……… 25
2. Profitability Ratio………... 27
D. Previous Research………. 29
E. Logical Framework………... 36
F. Hypothesis……… 38
CHAPTER III RESEARCH METHODOLOGY A. Scope of Research………. 40
B. Sampling Method………. .. 40
C. Data Collection Method………... .. 42
D. Data Analyze Method……….. .. 43
1. Descriptive Statistic………... .. 43
2. Classical Test Assumption………. .. 44
a. Normality Test………. .. 44
b. Multicollinearity Test………. 45
c. Autocorrelation Test……… .. 46
d. Heteroscedasticity Test……….... .. 46
3. Hypothesis Testing………... 47
a. Multiple Regression Analysis……….. .. 47
c. Partial Significance Test ( t- Test)……… 49
d. Coefficient Determination Test(R2)………. 49
E. Variable Operational Reseasrch……….. 50
1. Independent Variable………. 50
2. Dependent Variable……… 51
CHAPTER IVFINDING AND ANALYSIS A. General Description of Research Object……….. . 52
B. Analysis and Discussion……….. . 58
1. Descriptive data………. . 58
a. Analysis of Return on Investment………. 58
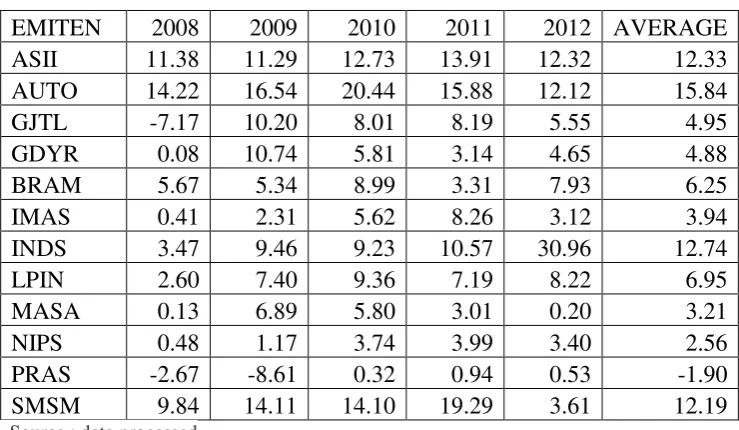
b. Analysis of Working Capital Turnover…………. 61
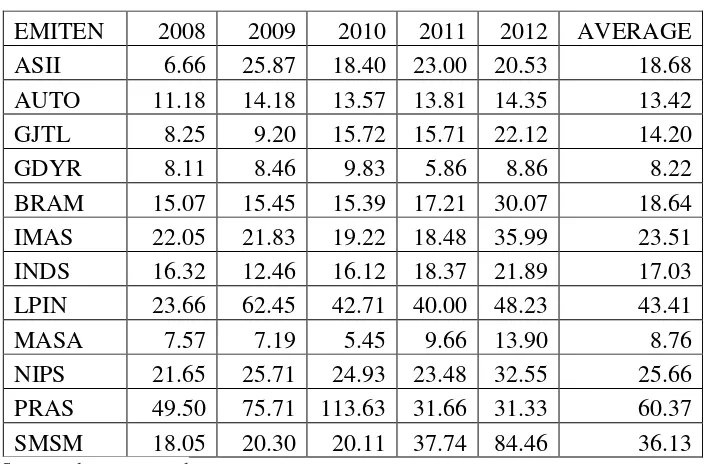
c. Analysis of Receivables Turnover………... . 63
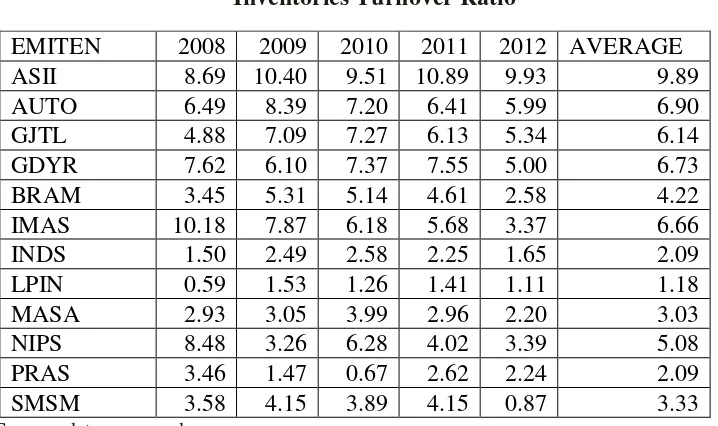
d. Analysis of Inventories Turnover……… ..66
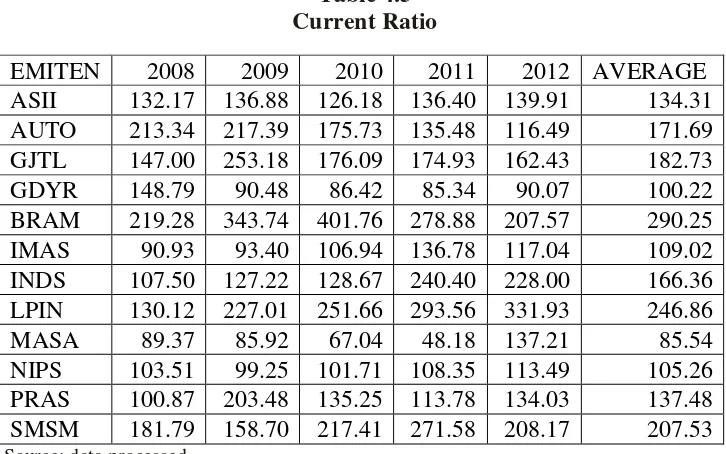
e. Analysis of Current Ratio……… . 68
2. Classical Assumption Test………. .71
a. Normality Test Data………...71
b. Multicolinearity Test……… ..73
c. Autocorrelation Test………...74
d. Heteroscedasticity Test………...75
C. Hypothesis Testing……….………....76
1. Analysis of Multiple Regression………...76
a. Simultaneous Test ( F- Test)……… ..76
b. Partial Test ( T- Test)………...78
D. Intepretation…...………....80
CHAPTER V CONCLUSION AND IMPLICATION A. Conclusion……… 83
B. Implication……… 84
C. Recommendation……….. 85
REFERENCES……… 86
List of Tables
No. Description Pages
2.1 Overview Previous Research 33
3.1 List of Sample 42
4.1 Return on Investment (2008-2012) 59
4.2 Working Capital Turnover (2008-2012) 61
4.3 Receivable Turnover (2008-2012) 64
4.4 Inventories Turnover (2008-2012) 67
4.5 Current Ratio (2008-2012) 69
4.6 Kolmogrov - Smirnov Normality Test 72
4.7 Multicolinearity Test 74
4.8 Autocorrelation Test 74
4.9 F Test 76
4.10 Partial Test (T Test) 78
List of Figures
No. Description Pages
1.1 Automobile Sales in Indonesia 2001-2012 5
2.1 Logical Framework 36
List of Appendix
No. Description Pages
1 List of Sample Company (2008-2012) 88
2 Data Processed 89
3 Descriptive Statistics 92
CHAPTER I INTRODUCTION
A. Background
In the era of globalization, the company are required to have competitive advantage and are able to maintain the success and continuity in improving profitability. The company is established to get the maximum profit in order to the survival of company can be maintained and developed well. In achieving the goal, manager of the company always faced with various problems such as technical, administrative, and financial (Rukmana, 2011: 1).
Working capital refers to a firm’s short term assets such as inventory, and its short-term liabilities, such as money owed to suppliers. Managing the firm’s working capital is day-to-day activity that ensures
that the firm has sufficient resources to continue its operations and avoid costly interruptions (Ross et al,2010 : 4).
Working capital management of a firm has been recognized as an important area in financial management. This field can include decisions about amount and the combination of current assets and financing them. The process of working capital management includes decisions about different aspect of cash investment, the maintenance of certain level of inventories and managing of receivable and payable accounts. The main goal of working capital management is to teach and keep an optimized balance between each component of working capital (Mousavi et al, 2012:141).
Business success heavily depends on the ability of financial executives to effectively manage receivables, inventory, and payables (Filbeck and Krueger, 2005). Firms can reduce their financing costs and increase the funds available for expansion projects by minimizing the amount of investment tied up in current assets. Most of the financial managers’ time and effort are allocated in bringing non-optimal levels of
current assets and liabilities back toward optimal levels. Excessive levels of current assets may have a negative effect on the firm’s profitability
and stock outs resulting in difficulties in maintaining smooth operations (Afza et al, 2009 : 20).
Efficient management of working capital plays an important role of overall corporate strategy in order to create shareholder value. Working capital is regarded as the result of the time lag between the expenditure for the purchase of raw material and the collection for the sale of the finished good. The way of working capital management can have a significant impact on both the liquidity and profitability of the company(Dong. H.P, 2010: 60).
The main purpose of any firm is maximum the profit. Then, maintaining liquidity of the firm also is an important objective. The problem is that increasing profits at the cost of liquidity can bring serious problems to the firm. Thus, strategy of firm must be a balance between these two objectives of the firms. Because the importance of profit and liquidity are the same so, one objective should not be at cost of the other. If we ignore about profit, we cannot survive for a longer period. Conversely, if we do not care about liquidity, we may face the problem of insolvency. For these reasons working capital management should be given proper consideration and will ultimately affect the profitability of the firm (Dong. H.P, 2010: 60).
obligations as they mature (Sawir, 2001: 31). If the company is able to make payments on its maturing obligations, meaning the company in a liquid state, and vice versa if the company does not have the ability to make payments, meaning the company in a state liquid that can inhibit the activity of the company's operations and reduce its effectiveness. Liquidity can also be shown by the size of the current assets easily converted into cash such as accounts receivable, marketable securities and inventories.
National Automotive industry is one of the Indonesian economic
driving. Automotive industry chain business has been started
manufacturing components, manufacturing the vehicle itself, the
distribution network and after-sales service, both official and public
workshops, including sales of spare parts network throughout Indonesia. In
addition, the industry is also developing other supporting industries such
as finance and insurance. Thus Automotive industry chain is also creating
huge employment opportunities for the community. Furthermore, the rapid
development of the national automotive industry will attract foreign
investors to participate in developing its business in Indonesia.
during the last 7 months of the year rose 8.8% from 29.5 million on the part of the same period last year to 32 million pieces (kemenperin.go.id).
Based on a survey of the basic plan Indonesian automotive industry with labor relations in Indonesia, the growth of investment in the automotive industry in 2011 reached 70 percent. In the third quarter of 2012, an investment of over 1.3 billion U.S. dollars. Thus, the automotive sector became one of the biggest in Indonesia 2012 (kemenperin.go.id).
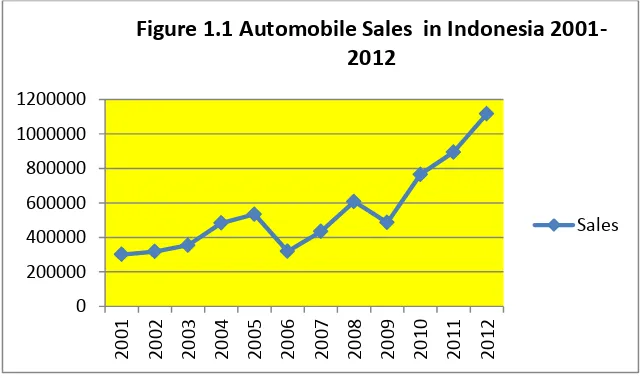
One of the automotive industry that growing and sophisticating is a
car. Car is the popular transportation and many of people needed this
transportation. Figure 1.1 is the growth of automotive industry especially
automobile sales data in 2001-2012:
Source : data processed (Gaikindo)
Based on figure 1.1 shows that automobile sales fluctuate from
[image:22.596.186.508.447.636.2]year to year. In 2009-2012 increased automobile sales each year. In 2009 0 200000 400000 600000 800000 1000000 1200000 20 01 20 02 20 03 20 04 20 05 20 06 20 07 20 08 20 09 20 10 20 11 20 12
Figure 1.1 Automobile Sales in Indonesia 2001-2012
Increased automobile sales will increase revenue company that also
increasing profitability in the company. According to Munawir (2003:64), profitability is one of the company's objectives in analyzing financial statements, that also profitability is the ratio of a company's success in using wealth productively, thus making a profit or a satisfactory profit. So if the company is able to produce a satisfactory profit will increase foreign investors to participate in developing its business in Indonesia.
The rapid growth of the national automobile market began to have a positive impact on investment in the automotive components industry. Ministry of Industry projected investment in the automotive components sector by the end of this year could break the USD 10 trillion, an increase compared to the 2012 amounting to Rp 6 trillion. Investment growth in the automotive component industry in line with the rapid growth of industrial transport equipment, machinery, and equipment to Quarter I/2013 recorded the highest growth of 10.51 percent (Gaikindo).
The few studies that have been done before, there is a difference in the results of research. There is a difference of research on working capital management and profitability. Deloof (2003) investigated the relationship between working capital management and corporate profitability for a sample of 1,009 large Belgian non-financial firms for the 1992-1996 periods. The result showed that there was a negative relationship between variables cash conversion cycle as well number of day’s accounts receivable and inventories toward gross operating income. He suggested that managers can increase corporate profitability by reducing the number of day’s accounts receivable and inventories. Less profitable firms waited
longer to pay their bills.
Singh and Pandey (2008) had an attempt to study the working capital components and the impact of working capital management on profitability of Hindalco Industries Limited for period from 1990 to 2007. Results of the study showed that current ratio, liquid ratio, receivables turnover ratio and working capital to total assets ratio had statistically significant impact on the profitability of Hindalco Industries Limited.
cash conversion cycle. From those results, they claimed that the managers could create value for shareholders by handling correctly the cash conversion cycle and keeping each different component to an optimum level.
Raheman and Nasr (2007) have selected a sample of 94 Pakistani firms listed on Karachi Stock Exchange for a period of 6 years from 1999-2004 to study the effect of different variables of working capital management on the net operating profitability. From result of study, they showed that there was a negative relationship between variables of working capital management including the average collection period, inventory turnover in days, average collection period, cash conversion cycle and profitability. Besides, they also indicated that size of the firm, measured by natural logarithm of sales, and profitability had a positive relationship.
Finally, Afza and Nazir (2009) made an attempt in order to investigate the traditional relationship between working capital management policies and a firm’s profitability for a sample of 204 non
crease value if they adopt a conservative approach towards working capital investment and working capital financing policies.
Christopher et al (2009) study, they investigated a sample of 14 corporate hospitals in India using panel data analysis for the period 96/97 to 2005/06. The independent variables used were current ratio, quick ratio, inventory turnover ratio, working capital turnover ratio, debtor´s turnover ratio, ratio of current asset to total asset, ratio of current asset to operating income, comprehensive liquidity index, net liquid balance size, leverage and growth. The dependent variable profitability is measured in terms of return on investment ROI. From multiple regression analysis, negative association with ROI can be seen in current ratio, cash turnover ratio, current asset to operating income and leverage. On the other hand, positive association with ROI are in quick ratio, debtor´s turnover ratio, current asset to total asset and growth rate. Conclusion is that hospitals should concentrate more on efficient use of working capital for increasing the profitability which would increase the value of hospitals.
M. Rajesh et al (2011) conducted a study on impact of working capital management on firm's profitability. This study uses nine variables, the current ratio, acid test ratio, current assets to total assets ratio, current assets to sales ratio, working capital turnover, inventory turnover, debtors turnover ratio, cash turnover and ROI. The results of this study indicate that the current ratio, working capital turnover, inventory turnover ratio and debtors turnover ratio has positive effect on ROI. While the acid test ratio, current assets to total assets ratio, current assets to sales ratio, cash turnover ratio and negatively affect ROI.
Based on the description above, author is interestto use the title“
The Influence of Working Capital Management and Liquidity Toward
Profitability” (Case Study : Automotive and Component Industry listing
in Indonesia Stock Exchange 2008-2012) .
B. Problem Formulation
Based on the background that has been presented, the problem formulation in this study are:
a. How does the influence of working capital turnover, receivable turnover, inventory turnover, and current ratio toward profitability (ROI) of automotive and component industry in Indonesia by simultaneous and partial.
ratio) toward profitability (ROI) of automotive and components company.
C. Research Objectives
Based on the problem formulation, this study aims to:
a. To analyze the influence of working capital turnover, inventories turnover, receivable turnover, and current ratio toward the profitability (ROI) of automotive and components industry in Indonesia by simultaneous and partial.
b. To analyze the most dominant effect of independent variable (working capital turnover, inventories turnover, receivable turnover, or current ratio)toward profitability (ROI) of automotive and components industry.
D. Benefits of Research
Based on the research of working capital management and liquidity toward profitability at companies listed in the Indonesia Stock Exchange, it will obtain some benefit to the parties as follows:
1. For the Companies
b. As inputs for the company to use the existing working capital as effectively and efficiently as possible to increase the profitability of the company
2. For the Investors
The study is expected to provide information on the importance of working capital management that affect the company's business continuity and feasibility assessment consideration in making investment decisions.
3. For the Academics
CHAPTER II
LITERATURE REVIEW
A. Working Capital Management 1. Definition of Working Capital
Working capital is very required to operating the company. Working capital is the assets which is required to operating the daily for several periods. For the example to buy raw materials, pay the employee salaries, pay the direct labor, and pay the debt. (Kasmir, 2008 :250)
Working capital refers to a firm’s short term assets such as inventory,
and its short-term liabilities, such as money owed to suppliers. Managing the firm’s working capital is day-to-day activity that ensures that the firm has
sufficient resources to continue its operations and avoid costly interruptions. (Ross et al, 2010 : 4)
According to Markus (2008: 138), working capital is a short-term asset or assets and current liabilities, such as accounts receivables, inventory, and accounts payable when the company moves through a cycle where the raw materials purchased, the goods are produced and sold. So called working capital as short-term assets and liabilities.
sourced from long-term debt and equity capital. The benefits of sufficient working capital is (Djarwanto, 2004 : 87) :
a. Protect the company from the bad consequences where the value of current assets decreased. For example the financial loss because the debtor does not pay out, and the value of inventory decreased because the price declined.
b. Enabling the company to pay short-term liabilities on time.
c. Enabling enterprises to be able to buy goods with cash so that they can reap the benefits in the form of rebates.
d. Ensured the company to has credit standing so can solve unforeseeable. e. Enabling to have sufficient supplies to serve the demand of consumers. f. Enabling the company to give credit requirement which is profitable for
customers.
g. Enabling the company to operate more efficiently, because there is no difficulty in obtaining raw materials, services and supplies needed.
h. Enabling the company to survive in recession and depression periods.
2. Factors Determining Amount of Working Capital
a. General nature or type of company
Working capital of a company's services will be relatively lower when compared with working capital requirements of the company it self, due to service company does not require a large investment in cash, receivables and inventories.
b. The time required to produce or obtain goods and the cost of production per unit or price of the goods
Working capital needs of a company is directly related to the time required to acquire the goods that will be sold as well as the basic material to be produced until the goods are sold. The longer the time required to manufacture or acquire such goods, the greater the working capital needed.
Terms of the purchase of materials or merchandise Terms of the purchase of merchandise or raw materials that will be used to produce goods greatly affect the working capital required by the company. If credit terms are accepted at time of purchase benefits, so little cash that must be invested in the stock of materials or merchandise or otherwise.
c. Terms of sale
The more soft loans to buyers of the company will lead to the large amount of working capital invested in the sector accounts.
d. Inventory turnover rate
minimize the risk of loss due to the decline in prices or changes in consumer taste, but it will save the cost of storage and maintenance of the supplies.
3. Sources of Working Capital
According to Munawir (2004: 120), sources of working capital of a company can be derived from:
a. Company's operating results, is the amount of net income that appears in the statement of income plus depreciation and amortization, this number indicates the amount of working capital from the operating results of the company.
b. Profits from the sale of marketable securities
c. Sales of fixed assets, long-term investments and other assets not smooth. d. Sale of bonds and stocks as well as contribution of funds from the owners e. Borrowing funds from banks and other short-term loans.
f. Credit from a supplier or trade creditor
4. Use of Working Capital
According to Djarwanto (2004: 98), the use of working capital is reduced current assets:
b. Any usage prive which is from profits (on a proprietorship or partnership). c. Loss of business or loss incidental which is required cash expulsion. d. Establishment of a fund for a specific purpose such as pension funds, bond
debts payment, which had matured, the replacement of non-current assets. e. Additional purchases of fixed assets, intangible assets, and long-term
investments.
5. Types of Working Capital
According to Sjahrial (2007: 104), working capital can be divided into two types, is :
a. Permanent Working Capital
Permanent working capital is working capital that run the daily company operations. Without a working capital has resulted in the operation will be stop. Working capital divided by:
1. Primary working capital
The primary working capital is the minimum amount of working capital that should be by company to ensure business continuity.
2. Normal working capital
b. Variable Working Capital
Variable working capital is using and always changing according to circumstances. The changes are due to seasonal fluctuations, fluctuations conjuncture, and changes the nature of the emergency, so the variable working capital divided into:
1. Seasonal Working capital
Seasonal working capital is the amount of funds which is required to anticipate when there are fluctuations in the activities of company. 2. Working capital cycle
Working capital cycle is the amount of working capital which is their necessary influences by the conjuncture.
3. Emergency working capital
Emergency working capital is the amount of working capital needs which is influenced by the circumstances that happen beyond the capabilities of the company.
6. Definition of working capital management
According to Sawir (2005: 133) "Working capital management is an activity that includes all the functions of the management of current assets and current liabilities of the company". Working capital management purpose is managing current assets and current liabilities to obtain net working capital and also to guarantee the profitability of the company. Therefore, a manager is expected to managing of company in order to meet working capital can be carried out effectively and efficiently. Working capital management is also important, because it relates to some aspects, as follows:
a. Some research has indicated that most of the time of the financial manager is to spent by daily internal activities and this is the part of working capital management,
b. If more than half the total assets of company are current assets as part of a large investment and easily converted to cash, so current assets is require the careful attention of financial managers,
c. Relationship between the rate of sales growth and the need of financial capital also current assets are close and straight,
There are two fundamental principles in the management of operational funding working capital (Horne, 2005: 313), namely: "The ability to earn income is inversely related to liquidity and the ability to earn profits in line with risk". Control the exact amount of working capital will ensure the continuity of operations of the company efficiently and economically. When working capital is too large, then the funds that are embedded in the working capital requirement exceeded, resulting in idle funds, because these funds could be used for other purposes in order to increase profits.
Targets to be achieved from working capital management is (Sawir, 2005 : 133) :
a. Maximize the value of the company by managing current assets so that the level of margin return on investment (return on investment) is equal to or greater than the cost of capital used to finance the current assets,
b. Minimize the cost of capital used to finance the current assets in the long term,
7. Ratio of Working Capital Management a. Working capital turnover ratio
According to Abdullah (2005: 71) "The use of working capital management can be tested using working capital turnover ratio is the total number of sales with current assets owned by a company in a given period". When the volume of sales increase, so inventories and receivables increase means that increase working capital. Formulation of working capital turnover (WCT) :
The working capital turnover indicates the amount of net sales dollars earned for every dollar of working capital. Of the relationship between net sales to working capital, it can be known is whether the company worked with high working capital or working with low working capital.
Working capital turnover ratio is also related to the company's liquidity. If the working capital turnover ratio is high, it indicates low liquidity to support operations, while if the ratio is low means high liquidity. The greater of working capital turnover ratio show the better a company. It also shows how effective
utilization of working capital available to improve the profitability of the company.
b. Receivable Turnover Ratio
This ratio measures the efficiency management of receivable in company. The higher ratio shows that working capital invested in receivables is low. Formulation of Receivable Turnover is :
(Sugiono, 2009;73)
c. Inventory Turnover Ratio
This ratio measures the efficiency management of inventory in company, and shows how many times the inventory can be spin in a year. Formulation of Inventory Turnover is:
(Sugiono, 2009;73) B. Liquidity
1. Understanding liquidity
Liquidity is one of the components to assess the financial of company. Liquidity is the ability of a company to meet its short term obligations as they mature (Sawir, 2001: 31). If the company is able to make payments on its
Receivable Turnover : Receivable / Sales x 100 %
maturing obligations, meaning the company in a liquid state, and vice versa if the company does not have the ability to make payments, meaning the company in a state liquid that can inhibit the activity of the company's operations and reduce its effectiveness. Liquidity can also be shown by the size of the current assets easily converted into cash such as accounts receivable, marketable securities and inventories.
Problem of liquidity is an important issue in a company that is relatively difficult to solve. In view of the creditors, the company which has high liquidity is a good company, because the funds are borrowed short-term creditors can be guaranteed by the company's current assets. Otherwise from the side of management, the company which has high liquidity is a bad company due to high liquidity indicates that idle cash balances, higher inventory, or higher trade receivables.
2. Liquidity ratio
Liquidity has always been associated with working capital that there are two basic principles of working capital finance (Horne and Wachowicz, 2005: 313) :
a. Profitability is inversely related to liquidity
b. Profitability is directly proportional to the risk. In achieving higher profitability should be aware that the risks faced is greater.
Horne and Wachowicz (2005: 313) declared an indication of the greater liquidity of the company, the stronger overall financial condition, and the growth profit of the company means that the higher level of risk that funding is used, like as debt financing more attractive to an improvement in liquidity.
According to Horne and Wachowicz (2005 : 207-208), liquidity ratio is divided by :
a. Current Ratio is the total current assets divided by current liabilities (current assets / current liabilities). Availability of cash to meet those obligations from cash or cash conversion of current assets.
b. Quick Ratio is the current assets minus inventories divided by current liabilities. A company that has a quick ratio of less than 1: 1 or 100% is considered poor liquidity levels.
the time billed as a whole. Precision current ratio according to Tunggal (2000: 155) depends on many factors, which are as follows:
a. Accepted credit terms from suppliers than with credit terms granted by the company to the buyer,
b. The time it takes to collect receivables, c. Inventory turnover,
d. Characteristics of the company's financial program, e. Season of the year in question,
f. Conjuncture situation,
g. Working capital cycle length,
h. Whether the company was looking to generalize / be reduced.
The formula for the current ratio or current ratio can be used as follows:
C. Profitability
1. Understanding Profitability
Profit in operations is an important element to to ensure the survival in the future. The company's success can be seen from the ability of the company makes a profit, the company's ability to compete in the market, and the ability of the company to be able to expand the business.
According to Gitman (2003: 599): "profitability is the relationship between revenues and costs generated by using the firm's assets - both current
and fixed - in productive activities". Brigham and Houston (2001: 89) said the profitability is "the net result of a series of policies and decisions".
Second opinions concluded that profitability is ability of company to make a profit by using available capital. Managerial performance of each company will be able to say well if, the level of profitability of the company that manages high or in other words the maximum, where profitability is generally always be measured by comparing the profits from the company with a number of estimates that a measure of success of the company. There are several ways to measure the profitability of a company.
a. Gross profit margin (GPM)
The measurement of the percentage of any proceeds after the sale of the company to pay the cost of goods sold. The higher gross profit margin, the better.
b. Operating profit margin (OPM)
The measurement of the percentage of any sale proceeds leftover after all expenses and other expenses reduced, except for interest and taxes.
c. Net profit margin (NPM)
d. Return on investment (ROI)
The measurement of the effectiveness of management in generating profits with the assets available.
e. Return on equity (ROE)
The measurement of return earned on investment in the company's owners.
2. Profitability ratios
Brigham and Daves (2004: 1007) said "Profitability ratios are a group of ratios shows that combine the effects of liquidity, asset management, and debt on operations", which means that the profitability ratio is a ratio that shows the group aspect of liquidity, management assets and the amount of the company's operations are financed by debt. Horne and Wachowicz (2005:222), explains the profitability ratio is "the ratio of earnings to connect financial investment in enterprise IT sales". Profitability ratio is the ratio to assess the ability of the company in search of profits and also provides a measure of the effectiveness of a company's management.
The use of profitability ratios for the company and external companies (Kasmir, 2008: 197) :
d. To assess the magnitude of the net profit after tax to equity capital, e. To assess the productivity of all funds used by the firm's own money.
This study uses the ratio of Return On Investment (ROI). Analysis Return On Investment (ROI) in financial analysis has particular significance as one of the techniques of financial analysis that is thorough / comprehensive.
Analysis of return on investment has been a common technique used by management to measure the effectiveness of the overall operation of the company. Return On Investment (ROI) itself is a form of profitability ratios are intended to measure the overall ability of the company with funds invested in assets used for the company's operations in order to generate profits. (Kasmir, 2008: 197)
Return On Investment connects the benefits of the company's operationsby the number of investments or assets (Net Operating Assets) which is used to generate the operating profit (Munawir, 2004: 89). The higher ratio means that the position of the owner company is stronger and vice versa. The greater value of the Return On Investment is better, because it means the company can generate high profits by using total assets. Formulation of Return On Investment (ROI) that is :
D. Previous Research
Deloof (2003) investigated the relationship between working capital management and corporate profitability for a sample of 1,009 large Belgian non-financial firms for the 1992-1996 periods The result from analysis showed that there was a negative relationship between variables cash conversion cycle as well number of day’s accounts receivable and inventories toward gross operating income.He suggested that managers can increase corporate profitability by reducing the number of day’s accounts receivable and
inventories. Less profitable firms waited longer to pay their bills.
Singh and Pandey (2008) had an attempt to study the working capital components and the impact of working capital management on profitability of Hindalco Industries Limited for period from 1990 to 2007. Results of the study showed that current ratio, liquid ratio, receivables turnover ratio and working capital to total assets ratio had statistically significant impact on the profitability of Hindalco Industries Limited.
shareholders by handling correctly the cash conversion cycle and keeping each different component to an optimum level.
Raheman and Nasr (2007) have selected a sample of 94 Pakistani firms listed on Karachi Stock Exchange for a period of 6 years from 1999-2004 to study the effect of different variables of working capital management on the net operating profitability. From result of study, they showed that there was a negative relationship between variables of working capital management including the average collection period, inventory turnover in days, average collection period, cash conversion cycle and profitability. Besides, they also indicated that size of the firm, measured by natural logarithm of sales, and profitability had a positive relationship.
Finally, Afza et al (2009) made an attempt in order to investigate the traditional relationship between working capital management policies and a firm’s profitability for a sample of 204 non-financial firms listed on Karachi
Stock Exchange (KSE) for the period 1998-2005.The study found significant different among their working capital requirements and financing policies across different industries. Moreover, regression result found a negative relationship between the profitability of firms and degree of aggressiveness of working capital investment and financing policies. They suggested that managers could crease value if they adopt a conservative approach towards working capital investment and working capital financing policies.
independent variables used were current ratio, quick ratio, inventory turnover ratio, working capital turnover ratio, debtor´s turnover ratio, ratio of current asset to total asset, ratio of current asset to operating income, comprehensive liquidity índex, net liquid balance size, leverage and growth. The dependent variable profitability is measured in terms of return on investment ROI. From multiple regression analysis, negative association with ROI can be seen in current ratio, cash turnover ratio, current asset to operating income and leverage. On the other hand, positive association with ROI are in quick ratio, debtor´s turnover ratio, current asset to total asset and growth rate. Conclusion is that hospitals should concentrate more on efficient use of working capital for increasing the profitability which would increase the value of hospitals.
Anggarini (2009) in PT Perkebunan Nusantara II (Persero) Tanjung Morawa in the period 2004-2008. The independent variables used were current ratio, quick ratio, debt to total equity ratio, and debt to total assets ratio. The dependent variable that is used in this research is Return on Investment. The result is current ratio has positive significant effect toward ROI. While quick ratio, debt to total equity ratio, debt to total assets ratio have no significant effect toward ROI.
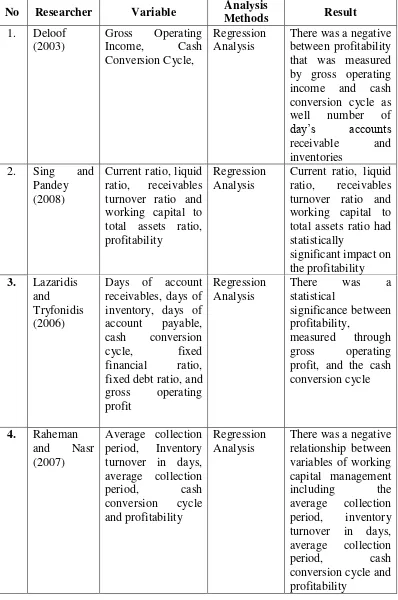
Table 2.1
Overview Previous Research
No Researcher Variable Analysis
Methods Result
1. Deloof (2003)
Gross Operating Income, Cash Conversion Cycle,
Regression Analysis
There was a negative between profitability that was measured by gross operating income and cash conversion cycle as well number of
day’s accounts
receivable and inventories
2. Sing and Pandey (2008)
Current ratio, liquid ratio, receivables turnover ratio and working capital to total assets ratio, profitability
Regression Analysis
Current ratio, liquid ratio, receivables turnover ratio and working capital to total assets ratio had statistically
significant impact on the profitability 3. Lazaridis
and Tryfonidis (2006)
Days of account receivables, days of inventory, days of account payable, cash conversion cycle, fixed financial ratio, fixed debt ratio, and gross operating profit
Regression Analysis
There was a
statistical
significance between profitability,
measured through gross operating profit, and the cash conversion cycle
4. Raheman and Nasr (2007)
Average collection period, Inventory turnover in days, average collection period, cash conversion cycle and profitability
Regression Analysis
There was a negative relationship between variables of working capital management including the average collection period, inventory turnover in days, average collection
period, cash
No Researcher Variable Analysis
Methods Result
5. Afza and Nazir
(2009)
Operating cycle, operating cash flows, leverage, size, ROA, Tobin’s
q and growth as internal
company-related factors, and Industry dummy and level of economic activity as external
Regression Analysis
Result found a negative relationship
between the
profitability of firms and degree of aggressiveness of working capital investment and financing policies
6. Christopher and
Kamalavalli (2009)
Current ratio, quick ratio, inventory turnover ratio, working capital turnover ratio, debtor´s turnover ratio, ratio of current asset to total asset, ratio of current asset to operating income, comprehensive liquidity index, net liquid balance size, leverage and growth, ROI
Multiple Regression Analysis
Negative association with ROI can be seen in current ratio, cash turnover ratio, current asset to operating income and leverage. On the other hand, positive association with ROI are in quick ratio, debtor´s turnover ratio, current asset to total asset and growth rate.
7. Hilda Anggarini (2009)
Current ratio, Quick ratio, Debt to total equity ratio, Debt to total asset ratio
Regression Analysis
Current ratio has a positive significant effect on ROI. While quick ratio, debt to total equity ratio, debt to total assets ratio have a no significant effect toward ROI
8. M. Rajesh and N.R.V. Ramana Reddy (2011)
Current ratio, acid test ratio, current assets to total assets ratio, current assets to sales ratio, working capital
Multiple Regression Analysis
No Researcher Variable Analysis
Methods Result
turnover, inventory turnover, debtors turnover ratio, cash turnover, ROI
Multiple Regression Analysis
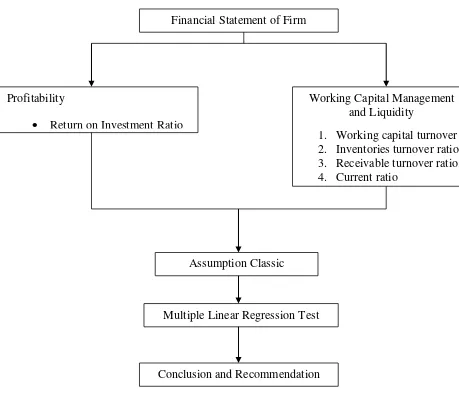
E. Logical Framework
Figure 2.1
Logical Framework
Based on the logical framework, it appears that the relationship between the independent variables and the dependent variable is the causative relationship (cause and effect). Where the determined independent variable are working capital turnover (X1), inventories turnover (X2), receivables turnover (X3), and liquidity (X4) will affect the
Financial Statement of Firm
Profitability
Return on Investment Ratio
Assumption Classic TestTTeTest
Multiple Linear Regression Test
Conclusion and Recommendation
Working Capital Management and Liquidity
profitability as the dependent variable (Y).Working capital used to operate of activities daily company, therefore, necessary to have a control over the sources and uses of working capital that is made in the form of a statement of changes in working capital. Supervision of the sources and uses of working capital essential for companies if the owner of company want to maintain the continuity of the company.
According to Horne (2005: 224) " If the company knows for certain future sales demand, collection of accounts receivable and production schedules, then the company can manage its debt maturity schedule associated with the timing of net cash flows in the future, the result will be the maximum profit, because there is no need to store assets”.
F. Hypothesis
The hypothesis of this study concerned whether there is a significant effect of the independent variables to the dependent variable simultaneously or partially. This study tested the following hypothesis:
1.Ho :b1, b2, b3, b4,=0 ; There is no effect between variables working capital turnover, accounts receivable turnover, inventory turnover and current ratio toward return on investment with a simultaneously
Ha : b1, b2, b3, b4,≠0 ; There is a effect with a simultaneous
between variable working capital turnover, accounts receivable turnover, inventory turnover and current ratio toward return on investment.
investment.
Ha :b1 ≠ 0 ; There is a positive effect of working
capital turnover ratio toward return on investment
3. Ho :b2= 0 ; There is no significant effect of receivable turnover ratio toward return on investment
Ha :b2 ≠0 ; There is a negative effect of receivable
turnover ratio toward return on investment 4. Ho :b3= 0 ; There is no significant effect of inventory
turnover ratio toward Return on Investment
Ha :b3 ≠0 ; There is a positive effect of inventory
turnover ratio toward return on investment 5. Ho :b4= 0 ; There is no significant effect of current
ratio toward return on investment
Ha :b4 ≠0 ; There is a positive effect of current ratio
CHAPTER III
RESEARCH METHODOLOGY
A. Scope of Research
This research uses quantitative method by using Microsoft Excel and SPSS 20.0 application. The research design or relationship between variables uses association causality. Causality is a type of relationship, which can be seen from the characteristics of the relationship between independent and dependent variables, if the dependent variable explained or influenced by independent variables, it can be stated that variable X cause variable Y (Indriantoro and Supomo,2009).
The scope of the research is the annual report of automotive and components listed in Indonesian Stock Exchange (IDX) within 2008-2012. This research will examine the influence of working capital management and liquidity towards profitability.
B. Sampling Method
This research conduct by purposive sampling method. Purposive sampling is divided into two types, quota sampling and judgmental sampling. In this research, researcher will use judgmental sampling as sampling method. In judgmental sampling, subjects selected on the basis of their expertise in the subject investigated (Indriantoro et al, 2009). The research data are taken from annual report of manufacturing company in the sector of automotive and components listed in Indonesia Stock Exchange (IDX). The reason why the researcher chooses manufacturing company as a research object because manufacturing company is the largest company’s sector listed in IDX.
Besides that, in automotive and component industry is one of the sectors most substantial investment growth in 2012. So that, it is good to choose this sector as research sample because most of company’s substantial investment growth
in 2012.
Regarding to the population in this research must meet the following criteria :
1. Manufacturing company in the sector of automotive and components listed in IDX during period of 2008-2012.
2. The company has published annual report in period 2008-2012. 3. The company has the data of working capital turnover, inventories
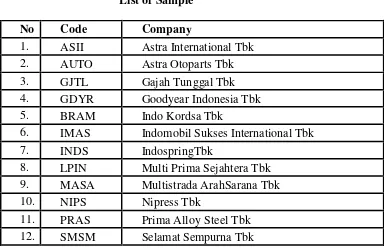
Based on these criteria the obtained samples are 12 automotive and components companies in the period 2008-2012 in Indonesia Stock Exchange :
Table 3.1 List of Sample
No Code Company
1. ASII Astra International Tbk
2. AUTO Astra Otoparts Tbk
3. GJTL Gajah Tunggal Tbk
4. GDYR Goodyear Indonesia Tbk
5. BRAM Indo Kordsa Tbk
6. IMAS Indomobil Sukses International Tbk
7. INDS IndospringTbk
8. LPIN Multi Prima Sejahtera Tbk 9. MASA Multistrada ArahSarana Tbk
10. NIPS Nipress Tbk
11. PRAS Prima Alloy Steel Tbk
12. SMSM Selamat Sempurna Tbk
Sources: idx.co.id
C. Data Collection Method
The research uses secondary data. The type of data obtained through research literature which provide theoretical basis and frame of mind to support primary data, as well as to support problem identification discussion (Indriantoro et al, 2009). Secondary data refer to information gathered from sources that already exist (Uma Sekaran and Roger Bougie, 2010). This research data will be acquired from reports on the company’s website, annual
Secondary data used in this study are the annual report of automotive and components industry companies listed on the Indonesia Stock Exchange in 2008-2012. Data obtained from the Indonesian, www.idx.co.id, Capital Market Reference Center (CMRC) at the Indonesia Stock Exchange (IDX), companies’ website and www.yahoofinance.com.
D. Data Analyze Method
The method of analysis data in this research is using statistical calculations, the name of application is SPSS (Statistical Product and Service Solutions) 20.0 for windows. Once the necessary data collected in this study, and then performed the data analysis consisted of descriptive statistical methods and test hypotheses :
1. Descriptive Statistic
2. Classical Test Assumption a. Normality Test
According to Zulkifli Matondang (2009), normality tests are conducted in purpose to detect whether a set of data will be used as basic start to test hypothesis is empirical data that meets the naturalistic nature. Naturalistic nature is a thought that phenomena (symptoms) occur in this nature are natural and patterned. Widhiarso (2009) said that normality tests are some tests to measure whether our set of data having normality distribution so it can be used in parametric statistic. Tests of normality become important because this is a parametric test and have to normal distributed (Haryadi and Winda, 2011). So, normality tests are some kind of tests to clarify whether the data obtained are normally distributed and, importantly, represent the whole population or not.
Researcher choose two tools to test whether the data is distributed normally or not.
1) GraphAnalysis
a) For histogram graph, if the curve make a form of bell around the chart, so the regression model meet the normality assumption
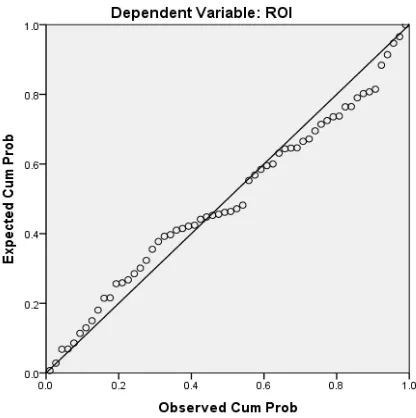
b) For Normal Probability Plot(P-P Plot), if the data spread around the diagonal line and follow the direction of the diagonal line, so the regression model meet the normality assumption.
2) Statistical Analysis
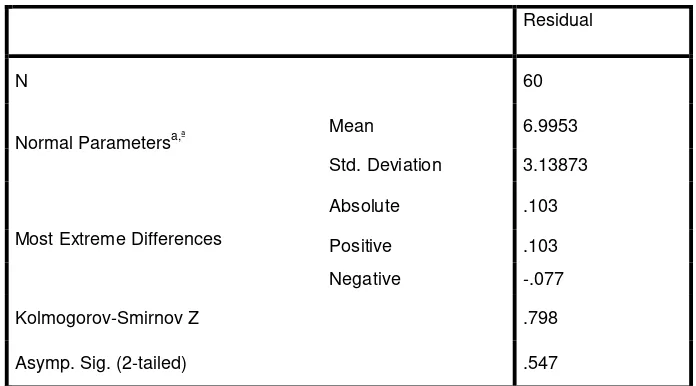
Researcher uses tools of Lilliefors (Kolmogorov- Smirnov) because Haryadi and Winda (2011) suggested that if data of testing are more than 50 (i.e. respondents are more than 50 people) then use Lilliefors (Kolmogorov- Smirnov) test. Criteria for Lilliefors (Kolmogorov- Smirnov) test are:
a) Number of Kolmogorov- Smirnov significance Sig. > 0.05, indicates the data normally distributed.
b) Number of Kolmogorov- Smirnov significance Sig. < 0.05, indicates the data are not normally distributed (NovitaItalianiKatsuri, 2011).
b. Multicollinearity Test
multicollinearity in the regression model can be seen from the value of tolerance and the variance inflation factor (VIF). Multicollinearity views of the tolerance value > 0.10 or VIF < 10. Both of these measurements indicate each independent variable which is explained by the other independent variables.
c. Autocorrelation Test
Autocorrelation is correlation between observed members arranged in time series (if the data used is time series data) or correlation among four contiguous variables (Andriyatno, 2010). Diagnose the autocorrelation done through testing to test the value of Durbin Watson (DW test) by (Ghozali2009:100).Here the criteria for testing autocorrelation.
1) If 0<Dw< DL there is any positive autocorrelation.
2) If DL <Dw< Du or 4-Du < D < 4-DL uncertain conclusion. 3) If 0 <Dw< DL or Du <Dw< 4-Du there is no autocorrelation. 4) If 4-DL <Dw< 4 there is any negative autocorrelation. d. Heteroscedasticity Test
there is no heteroscedasticity. In this study, heteroskedastisity test can be viewed with using the chart Scatterplot between the predicted value of dependent variable (ZPRED) and residual (SRESID). Y-axis becomes the axis that has been predicted and the X axis is the residual (Y predicted-Y actually) that has been in the studentized. Basic for decision-making are as follows:
1) If there is a certain pattern, like dots that are forming a regular pattern(wavy, widening and then narrow), then it indicates that there is heteroscedasticity.
2) If there is no clear pattern, as well as the dots spread above and below zero (0) on the Y axis, then it indicates that there is no heteroscedasticity or homocedasticity.
3. Hypothesis Testing
a. Multiple Regression Analysis
This research will show us about the influence of independent variables, working capital turnover (X1), inventories turnover (X2),receivables turnover (X3), current ratio (X4) toward dependent variable, Return on Investment (Y). The form of multiple linear regression equation as follows:
Where: Y = Return on Investment X1 = Working Capital Turnover X2 = Receivables Turnover X3 = Inventories Turnover X4 = Current Ratio
bi = Coefficient of Regression Variable b. Simultaneous Significance Test ( F- Test)
Essentially, F-test has purpose to know whether among independent variables simultaneously have significant influence toward dependent variable. Independent variables in this research working capital turnover, inventories turnover, receivables turnover and current ratio whereas dependent variable is ROI. So, F-test has function to know the influence among working capital management and liquidity towards profitability (ROI). α used for this research is 0.05 ( 5%) with
assumption:
1.) Ftest<Ftable, independent variables simultaneously not influence towards dependent variable or hypothesis is rejected.
2.) Ftest>Ftable, independent variables simultaneously influence significantly towards dependent variables or hypothesis is accepted.
c. Partial Significance Test ( T - Test)
Partial Significance Test or t- test basically has purpose to know how far and how much the influence independent variables toward dependent variables. In this research, t- test is done to know the influence of working capital turnover, receivable turnover, inventory turnover, and current ratio as independent variables towards profitability (ROI) as dependent variable.
Assumption used for this test are if the significance value of t
more than α (significance value > α), so H0= accepted and H1 = rejected
but if on contrary the significance value of t less than α (significance
value < α), so H0= rejected and H1 = accepted. Level of significance (α)
use in this research is 0.01 (1%), 0.05 (5%), and 0.10 (10%) d. Coefficient of Determination Test ( R2)
gives almost all the information needed to predict the variation in the dependent variable (Ghozali, 2009).
E. Variable Operational Research
Variable operational research is a concept that had variation point applied in a research and meant to ensure, so variable that wanted to be researched clearly could be seen. As for variable that is meant as follows: 1. Independent Variable
The independent variable is the type of variables that explain or influence another variable or variables suspected as the cause of the dependent variable (Indriantoro and Supomo, 2009). The independent variables used are:
a. Working Capital Turnover
The sales of the current assets minus current liabilities
b. Inventory Turnover
The cost of good sold by the average of inventory
Working capital Turnover = Sales / ( Current assets – Current Liabilities)
c. Receivable Turnover
The receivables divided by sales
d. Liquidity (Current Ratio)
Current assets divided by current liabilities
2. Dependent Variable
Dependent variable is type of variables that explained or influenced by other variables or variable expected as a result of the independent variable (Indriantoro and Supomo, 2009). Dependent variable used in this research is ROI.
Return On Investment (ROI) is one of the profitability ratios are intended to measure the ability of companies with total funds invested in assets that are used for the operation of the company to generate profits. Return on investment can be formulated as follows (Munawir, 2004):
Receivable Turnover = Receivables / Sales x 100%
Current Ratio = Current Assets / Current Liabilities
CHAPTER IV
FINDING AND ANALYSIS
A. General Description of Research Object
National automotive industry is one of the Indonesian economic driving. The automotive industry has begun manufacturing value chain components, manufacturing the vehicle itself, the distribution network and after-sales service, both official and public workshops, including network sales of spare parts throughout Indonesia. In addition, the industry also develop supporting industries such as finance and insurance. Thus the chain of the automotive industry is also creating opportunities tremendous work for the community. Based on data GAIKINDO, the automotive industry is the fourth rank contributors to the tax. Furthermore, the rapid development of the national automotive industry will attract foreign investors to participate in developing its business in Indonesia. Automotive and Components number of companies listed in the Indonesia Stock Exchange period 2008-2012 amounted to 12 companies. But companies are still listed and issued financial statements amounted to only 12 companies. Here is the company profile Automotive and Components in brief:
1. PT. Astra International Tbk. (ASII)
April 4th, 1990. Currently the majority of its shares owned by Singapore's Jardine Cycle & Carriage. In 1957, PT Astra International was founded. In 1965 the company began importing heavy equipment and cars from the United States. 1969 Astra then became the sole distributor of Toyota cars in Indonesia. Astra was appointed as the sole distributor of Honda Motor and copy machine Xerox in Indonesia in 1970. Astra International 1990 listed in the Jakarta Stock Exchange and Surabaya Stock Exchange. Then in 2005 Toyota Astra Finance was established to support the financing of the Toyota brand.
2. PT. Astra Otoparts. (AUTO)
3. PT. Gajah Tunggal Tbk. (GJTL)
Established in 1951, PT. Gajah Tunggal Tbk. start production tires with a bicycle tire. The company has since grown into a manufacturer the largest integrated tire in Southeast by making a variety of products through the production of motorcycle tires in 1971,followed by bias tires for passenger cars and commercial in 1981. Early90s, the company began manufacture radial tires for cars passenger and truck. PT Gajah Tunggal Tbk listed in the Stock Exchange Jakarta and Surabaya in 1990.
4. PT.Goodyear Indonesia Tbk. (GDYR)
PT Goodyear Indonesia is the first tire company and the oldest in
Indonesia, which was founded in 1935 on an area of 172,000 of greenery in the city of Bogor. GDYR was one of the first companies listed on the Jakarta Stock Exchange in 1980. Since 1935, Goodyear became a pioneer for the development of the tire industry in Indonesia, and provide technical support in the establishment of PT Intirub (Indonesian Tire & Rubber Company). It also contributed to the technology industry by forming a bead wire for PT Indocordsa Tbk.
5. PT.IndoKordsa Tbk. (BRAM)
6. PT. Indomobil Sukses Internasional Tbk. (IMAS)
PT Indomobil Sukses International is an integrated business group applying the concept of one-stop service which has several subsidiaries engaged in the automotive field in Indonesia. The Company was founded in 1976 under the name PT. Indomobil Investment Corporation and in 1997 was the merger with PT. Indomulti Inti IndustriTbk. Since then the company changed to the status of a public company under the name of PT. Indomobil Sukses Internasional Tbk, with its headquarters in Wisma Indomobil East Jakarta. The main business areas of the company and its subsidiaries include: brand licensees, distributors vehicle sales, after-sales service, motor vehicle assembly, automotive component manufacturers, and distributors of spare parts. In addition, to assist consumers in meeting the needs of the vehicle, the Company and its subsidiaries also offer auto financing services, distribution of lubricating oils and other supporting business group.
7. PT. Indospring Tbk. (INDS)
8. PT.Multi Prima Sejahtera Tbk. (LPIN)
PT. Enterprises Lippo Tbk. established on January 7th, 1982. In June 27th, 2001 a change in corporate name is PT. Multi Prima Sejahtera Tbk. Line of Business includes manufacturing spark plugs and automobile parts, trade goods of own production or a related company, investments in companies or other legal entities. The Company started commercial operations in 1987 with the main production automobile spark plugs and lights.
9. PT.Multisrada Arah Sarana Tbk. (MASA)
PT Multistrada Arah SaranaTbk (MASA) is a manufacturer of vehicle tires four wheel brand Achilles, Corsa and Strada. MASA is fully committed to provide the best service and products of high quality for the customers, by not using substandard raw materials, not to produce and deliver a product that does not meet quality standards.
10.PT. Nipress Tbk. (NIPS)
11.PT.Prima Alloy Steel Tbk. (PRAS)
The company was founded in February 1984 and located in
Sidoarjo. The company’s factory is located 60.000 , employs 800
people, and capable of producing 1.2 million pieces wheels annually make
the company grow into a major manufacturer of a