Agricultural and Forest Meteorology 101 (2000) 67–78
Nocturnal mixing in a forest subcanopy
L. Mahrt
a,∗, Xuhui Lee
b, Andrew Black
c, Harold Neumann
d, R.M. Staebler
d aCollege of Oceanic and Atmospheric Sciences, Oregon State University, Corvallis, OR 97331, USAbSchool of Forestry and Environmental Studies, Yale, New Haven, CT 06511, USA cDepartment of Soil Science, University of British Columbia, Vancouver, BC, Canada V6T 1Z2
dCanadian Atmospheric Environmental Service, Downsview, Ont., Canada M3H 5T4
Received 19 April 1999; accepted 3 November 1999
Abstract
The vertical structure of the flow in the old aspen canopy in BOREAS is examined in terms of thermocouple profiles and sonic anemometers above, within, and below the aspen canopy. The data are composited for different periods in order to isolate seasonal changes of the canopy and sun angle. On clear nights, a strong surface inversion develops in the lower part of the subcanopy in contrast to more closed canopies where strong stratification does not develop in the subcanopy. On clear nights with weak winds, a second weaker inversion develops at the top of the aspen canopy.
On average, the subcanopy is very stable in the early evening and becomes less stable later in the evening. This appears to be due to a general increase in wind speed above the canopy during the night. On some of the nights, the stability of the flow in and above the canopy suddenly decreases in association with cold air advection. The characteristics of these events are examined.
The vertical structure of the heat and momentum flux below and above the canopy are examined. The drag coefficient for the subcanopy stress exhibits a maximum at neutral stability and systematically decreases with increasing subcanopy stability and also decreases slowly with increasing instability. Possible explanations for this unexpected decrease with instability are examined. ©2000 Elsevier Science B.V. All rights reserved.
Keywords: Subcanopy; Nocturnal heat flux; Surface fluxes; Turbulence transport
1. Introduction
In open canopies, subcanopy fluxes can account for a significant fraction of the total flux from the forest (Black et al., 1996; Baldocchi and Vogel, 1997; Kelli-her et al., 1998). Empirical formulations of subcanopy fluxes have not been rigorously compared to observa-tions. Existing similarity theory is not expected to be valid in the subcanopy layer because the fluxes vary rapidly with height associated with sources and sinks
∗Corresponding author. Tel.:+1-541-737-3504;
fax:+1-541-737-2064.
E-mail address: [email protected] (L. Mahrt).
of heat and momentum in the subcanopy layer. Any similarity approach calibrated from data must contend with the fact that the time average flow will generally vary horizontally on the scale of the vegetation ele-ments (Baldocchi, 1997). The flux measureele-ments at a given point may not be representative because the footprint of eddy correlation measurements in the sub-canopy is small. Because of microscale heterogene-ity, the basic conservation equations are best posed in terms of horizontal averages (Raupach and Shaw, 1982). Spatially-averaged fluxes are not available from observations.
The surface fluxes from the ground floor may not establish equilibrium with the subcanopy air because
of occasional turbulent events penetrating from above the canopy into the subcanopy layer (Baldocchi and Meyers, 1991). As a result, some of the subcanopy flux is characterized by relatively long time scales, apparently associated with gusts penetrating into the canopy. Gao et al. (1989), Sun et al. (1998), and oth-ers provide details on the penetration of gusts into the canopy. At the same time, some subcanopy flux may occur on very small scales, not completely resolved by sonic anemometers. Since the subcanopy eddies con-sist of perturbations due to both penetrating eddies and locally generated eddies, the appropriate length scales for construction of similarity theory are not clear. Rau-pach (1989) suggests that the canopy depth can be used to scale the main transporting eddies.
Because of these difficulties, observational support for formulations of subcanopy fluxes is rather mea-ger, especially for the nocturnal case. Therefore, this study concentrates on turbulent fluxes in the noctur-nal subcanopy. Although measurements from sonic anemometers in the subcanopy inherit a number of dif-ficulties, there is sufficient information in such data to identify difficulties with current modelling approaches and suggest possible improvements. Although the sub-canopy drag coefficient is sensitive to stability in the subcanopy, no formulation has been constructed for the stability-dependent drag coefficient in the sub-canopy.
This study analyzes the basic characteristics of the fluxes and drag coefficient above and within an as-pen canopy in the BOREAS (Boreal Ecosystem and Atmospheric Study) (Blanken et al., 1997; Hogg et al., 1997; Lee et al., 1997; Lee, 1998; Lee and Barr, 1999). Blanken et al. (1998) analyzed this data in terms of spectra, variances, covariances and skewness and showed the importance of gusts penetrating into the subcanopy, which invalidates local transfer parameter-izations such as eddy diffusivities. Our emphasis here is on the subcanopy drag coefficient and its depen-dence on stability (Section 6).
While the coupling between forest subcanopies and the overlying flow has been documented extensively for daytime conditions where gusts associated with energetic eddies penetrate into the subcanopy, less is known about the nocturnal regime. Section 3 studies the nocturnal evolution of the thermodynamic struc-ture above and below the subcanopy using thermo-couple data from Lee (1998). Section 4 examines the
nocturnal evolution of the turbulence above and be-low the canopy while Section 5 focuses on nocturnal events corresponding to cooling and destabilization of the flow.
2. The data and calculations
The study site (53◦629′N 106◦200′W) was located in Prince Albert National Park approximately 50 km NNW of Prince Albert, Sask., Canada. The site lies near the southern limit of the boreal forest. A natu-ral fire occurred approximately 70 years ago resulting in an even-aged stand of aspen with a mean canopy height of 21.5 m and a diameter at the 1.3 m height of 20 cm. Crown space was limited to the upper 5–6 m beneath which was a branchless trunk space. The un-derstory was dominated by a uniform cover of hazel-nut with a mean height of 2 m. The fetch was at least 3 km in all directions.
The following study will analyze measurements from sonic anemometers at four levels on the main tower (Fig. 1) and at the 4 m level on a small tower approximately 40 m from the main tower. Subcanopy measurements are difficult due to weak amplitude of the fluctuations. The instrumentation and difficulties are detailed in Blanken et al. (1997). The momen-tum fluxes in the subcanopy are quite sensitive to the method used to correct for sonic tilt. For exam-ple, tilting the sonic coordinate system to remove the record (30 min or 1 h) mean vertical motion yields significantly different momentum fluxes compared to application of average tilt angles for each wind direc-tion bin. The tilt angle computed by eliminating the mean vertical motion for individual records leads to large tilt angles, which vary substantially from record to record.
L. Mahrt et al. / Agricultural and Forest Meteorology 101 (2000) 67–78 69
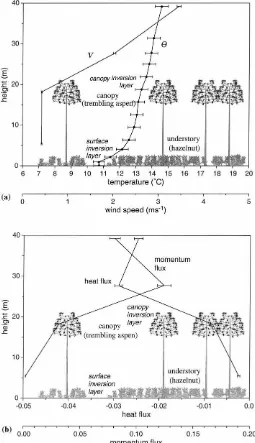
Fig. 1. (a) Composited vertical profiles of potential temperature from the thermocouple data and vertical profiles of the wind speed from the sonic anemometers between 21:00–05:00 h local time for late summer (15 August–19 September.). (b) Composited vertical profiles of the heat (m s−1◦C) and momentum flux (m2s−2). The horizontal brackets indicate error bars.
The temperature profiles are computed from accu-rate thermocouple data (Lee et al., 1997) that opeaccu-rated only during nocturnal periods. The sonic temperatures are not considered to be of sufficient accuracy to esti-mate vertical gradients of potential temperature.
error bars are relatively small due to the large number of records, approximately 300 depending on level.
The subcanopy Richardson number is defined as
Risc ≡(g/θ )(1θ )z
u2
where1θ is the difference of potential temperature between 1 and 6.4 m measured by thermocouples and
u is the magnitude of the vector-averaged wind speed
from the sonic at z=5.5 m.
The subcanopy drag coefficient is computed as
CD≡
u∗2
u2
The subcanopy drag coefficient is computed from eddy correlation data at the 4 m level on a small tower 40 m from the main tower and at the 5.5 m level on the main tower. Fluxes and wind speeds are computed by first averaging components and then computing the magnitude. The dependence of the drag coefficient on time and stability is discussed in Section 6.
3. Nocturnal subcanopy turbulence
Examination of subcanopy transfer is simplified by partitioning the data into seasons to reduce the in-fluence of seasonal variation of sun angle and veg-etation. For example, the amount of solar radiation reaching the subcanopy ground surface is much less in September compared to June–July. With the onset of foliage, the latent heat flux increases substantially and the sensible heat flux decreases significantly at all levels (Blanken et al., 1997). With our analysis of the pre-leafout period (15 April–20 May), the onset of positive heat flux in the subcanopy, on average, lags that above the canopy by about 1 h. The mid-day sub-canopy heat flux becomes about 40% of the heat flux above the canopy. After leafout, the heat flux in the subcanopy, on average, becomes positive about 2.5 h after the heat flux above the canopy becomes posi-tive. The sun elevation angle must exceed a certain value before a significant fraction of the ground sur-face receives sunlight. After leafout, the subcanopy heat flux reaches a mid-day value of only about 20% of the heat flux above the canopy. The subcanopy heat flux is therefore substantially reduced by the leafy
overstory. The stress above the canopy is not signifi-cantly affected by leafout while the subcanopy stress is significantly reduced by leafout (Blanken et al., 1998).
We focus on composited data for the late summer period, 15 August–19 September, where the data are the most complete. The general features of the noctur-nal structure within the canopy observed for this late summer period are also observed for the spring and mid-summer periods, except as noted earlier. Since some hours may be missing records for some of the days, the composite for each hour is based on a dif-ferent number of days, which contributes some noise to the diurnal variation of the composited variables.
For the composited data, the lowest 5 m is charac-terized by a strong subcanopy surface inversion cor-responding to a vertical change of potential temper-ature of almost 2.5◦C (Fig. 1a). The aspen canopy is sufficiently open that the surface net radiation is large negative and strong stratification develops at the ground surface. In contrast, the subcanopy stratifica-tion may become neutral or even unstable at night with more closed canopies where radiational cooling at the canopy top (Shuttleworth et al., 1985) and heat flux from the soil (Jacobs et al., 1994) destabilizes the sub-canopy air. With more closed canopies, the strongest stratification at night occurs above the canopy top (Amiro, 1990).
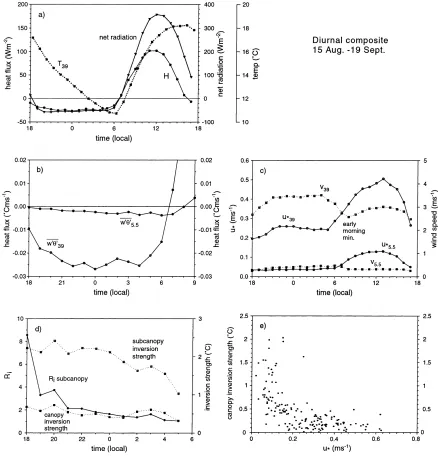
In addition to the subcanopy surface inversion, a weak canopy inversion develops at about 20 m where the composited potential temperature increases with height by about 0.5◦C across the canopy (Fig. 1a). The canopy acts as a radiative surface leading to this second elevated inversion. The strength of this inver-sion exceeds 1.0◦C on clear nights with weak winds. In general, the canopy inversion breaks down when the 39 m friction velocity exceeds about 0.15 m s−1 (Fig. 2e). The fast response thermocouple profiles in-dicate that coherent events often penetrate through the canopy inversion layer but normally do not penetrate into the subcanopy surface inversion.
L. Mahrt et al. / Agricultural and Forest Meteorology 101 (2000) 67–78 71
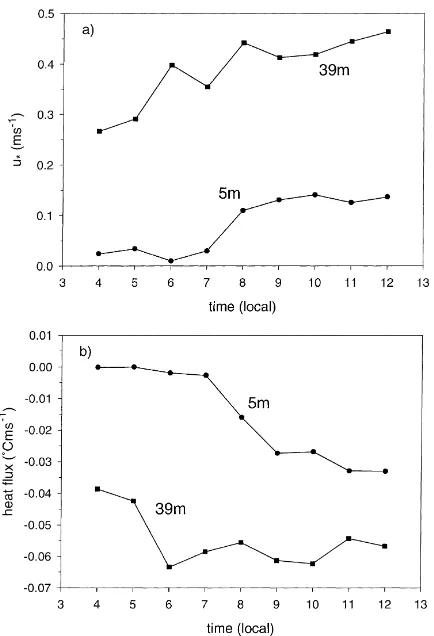
Fig. 2. For 15 August–19 September 1994, (a) the heat flux (H), the net radiation and the air temperature at the 39 m level, (b) the heat flux at 5.5 and 39 m, (c) the friction velocity and wind speed above the canopy (39 m) and in the subcanopy (5.5 m) based on the sonic anemometers, (d) the evolution of the canopy inversion strength (◦
boundary layers (Mahrt et al., 1998). After 05:00 h, the wind decreases, reaching an early morning min-imum at about 07:30 h local time. Then the wind increases with time due to the onset of convective mixing (upward heat flux) and enhanced downward momentum transport from above.
Within the vertical resolution of the data, the stress is a maximum at the 26 m level above the canopy and decreases significantly between this level and the 39 m level (Fig. 1b). The significant stress divergence above the canopy suggests either a very thin nocturnal boundary layer, less than 100 m depth, stress diver-gence associated with gravity waves (Lee et al., 1997) and/or large vertical changes of measured stress due to the change of footprint with height. Our analysis of flux errors could not account for this strong flux diver-gence although measurement errors cannot be ruled out as a contributor.
The strong heat flux convergence between the 26 and 18 m sonic is probably due to the radiative flux di-vergence in the upper part of the canopy. The heat flux divergence between 26 and 39 m is probably due to the usual decrease of heat flux with height in the bound-ary layer again implying that the nocturnal boundbound-ary layer is quite thin. Change of footprint with height could also be important.
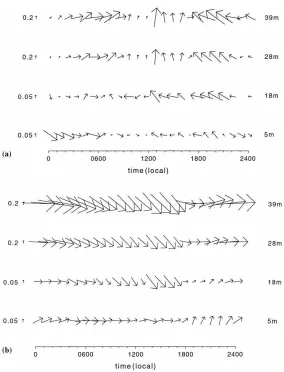
The diurnal pattern of the vector wind field was composited for strong wind cases (midnight winds greater than 4 m s−1, Fig. 3a) and weak wind cases with clear skies (midnight winds less than 3 m s−1and net radiation more negative than−40 W m−2, Fig. 3b). For the strong wind case, the flow is generally westerly at night and northwesterly in the daytime. Although it is difficult to interpret composited wind vectors, any influence of a nocturnal inertial oscillation (Stull, 1990) seems secondary. The winds at 39, 26 and 18 m show a similar diurnal pattern. Note that the wind at 5.5 m is directed to the left of the wind vector above the canopy and therefore more across the isobars, as proposed by Lee et al. (1994) and others.
For the weak wind case, the direction of the com-posited wind vector is more variable at all levels. The onset of northwesterly flow in the evening at 5.5 m could be associated with the weak local slope, on the order of 1%, which is directed toward the southeast and extends less than 1 km upstream. This postulated cold air drainage occurs only with weak large scale flow and only in the subcanopy.
4. Subcanopy fluxes
The subcanopy wind and friction velocity increase gradually during the night (Fig. 2c) while the cor-responding subcanopy Richardson number (Eq. (2)) decreases during the night (Fig. 2d). The subcanopy surface inversion strength, defined as the difference between the potential temperature at the 6.4 and 1 m levels, similarly decreases during the night (Fig. 2d). Therefore, the subcanopy is most stable in the early evening. The averaged subcanopy wind does not ex-ceed 0.5 m s−1 and the weak subcanopy friction ve-locity does not exceed 5 cm s−1.
On average, the downward heat flux in the noctur-nal subcanopy increases slowly with time, reaching a value near 0.004 km s−1late in the evening. Although this value could be smaller than the measurement er-ror, the heat flux in the subcanopy varies systemati-cally with time. On the other hand, the downward heat flux shows a slight decrease from the 18 m level to the 5.5 m level. The warming rate due to the heat flux convergence, ence between the two levels. However, the actual air temperature cools by a rate of about 1◦C h−1. Is this measured heat flux convergence due to instrument er-rors or variation of footprint with height, or is the im-plied warming due to turbulent flux convergence ex-ceeded by radiational flux divergence and horizontal advection of cold air? The latter would be consistent with the occasional occurrence of downslope flow in the subcanopy (Section 5).
5. Cooling events
L. Mahrt et al. / Agricultural and Forest Meteorology 101 (2000) 67–78 73
Fig. 3. The diurnal variation of the composited wind vectors for 15 August–19 September for (a) moderate wind cases and (b) weak wind cases. For adequate visualization, the vertical scale has been expanded for the within canopy and subcanopy winds.
air is substantially colder than even the suddenly cooled air above the canopy. Consequently, the sub-canopy surface inversion is not eliminated by the cold air events above the canopy. Mixing from higher lev-els above the tower would have produced warming in the tower layer. Therefore, simple instability and mixing is ruled out as the main mechanism. In this respect, these events are quite different from instabil-ity observed immediately above the nocturnal forest canopy by Hu and Lee (1998) and Sun et al. (1998). We take the liberty of referring to these events as nocturnal fronts even though their origin is not known.
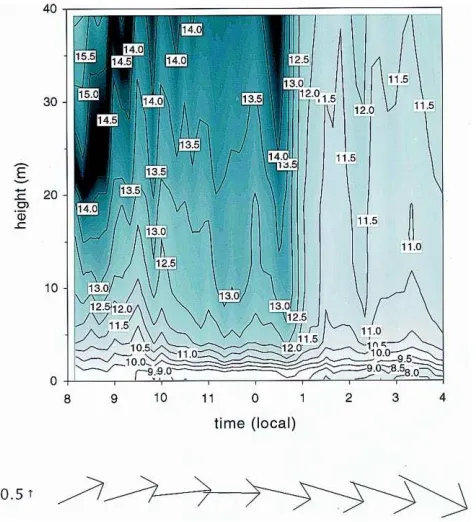
Fig. 4. The time-height cross-section for potential temperature (T+0.01z) for the thermocouple data and hourly-averaged wind vectors at 39 m for 16 September.
The stratification in the upper part of the surface inver-sion is reduced. The fluxes and wind direction above the canopy are not substantially modified during this particular frontal modification, although such modifi-cations occur on some other nights.
These cooling events sometimes occur periodically during the night and sometimes occur as a single front-like event late in the evening. Sometimes the cool air with reduced stratification is suddenly replaced by air similar to the original warmer air with strong strati-fication, suggesting that a pool of cooler air has moved past the aspen site.
Based on the 10 strongest events occurring during the summer, we summarize the following features: 1. A sudden drop in temperature at all levels except
in the subcanopy surface inversion (lower part of the subcanopy);
2. A substantial decrease of stratification and increase of turbulence and friction velocity;
3. Usually an increase in downward heat flux; 4. In a few cases, but not all, a sharp increase in wind
speed or change of wind direction.
Determination of the cause of these events may re-quire mesoscale observations which were unavailable for the present data sets. Propagation of large scale drainage flows from slopes increasing toward the west in Alberta would explain the late arrival of the cool air. Late evening pulses of cold air drainage were also observed in the studies of Blumen et al. (1999) and Mahrt and Larsen (1982).
6. Drag coefficient
L. Mahrt et al. / Agricultural and Forest Meteorology 101 (2000) 67–78 75
Fig. 5. For 16 September (a) the friction velocity at the 5.5 m (subcanopy) and 39 m (above canopy) levels and (b) the heat flux at the 5.5 and 39 m levels.
The subcanopy drag coefficient is quite large, typi-cally on the order of 0.1 for near-neutral conditions. The relatively large values are probably related to stress enhancement associated with the bottom of the aspen canopy, the trunks (wakes) and the bushy hazelnut at the ground surface. The laboratory results of Raupach et al. (1986) also show a large value of roughly 0.085 within the roughness elements depend-ing on the exact position with respect to individual roughness elements. On the other hand, Shaw et al. (1988) found drag coefficients on the order of 0.1 at the canopy top.
The drag coefficient increases dramatically as the wind speed decreases below 0.2 m s−1. Although such an increase may be at least partly physical, random flux errors are often large with weak winds speeds and small values of the stress. Therefore, records with
very small stress (u∗<0.01 m s−1and very weak wind speed<0.20 m s−1) are eliminated from further con-sideration.
Since the trunks correspond to sinks of momentum within the subcanopy layer, the stress may vary sub-stantially with height and Monin–Obukhov similarity theory does not formally apply. However, the Obukhov length, L, may still be relevant since it represents the ratio of shear-generation and buoyancy terms in the subcanopy turbulence energy equation. The normal stability parameter z/L is incomplete since the height above the ground and Obukhov length are just two of several relevant length scales. The distance from the bottom of the overlying aspen canopy and the spacing between tree trunks are also relevant turbulent length scales. The tree trunks directly induce drag on the sub-canopy flow as well as influence the scale of the tur-bulent transport from above and below. In addition, the stress in the subcanopy is strongly influenced by downward transport of turbulence. These various in-fluences could be sorted out only with multiple level data sets from a variety of sites with different trunk spacing and diameter and different depths of the trunk space.
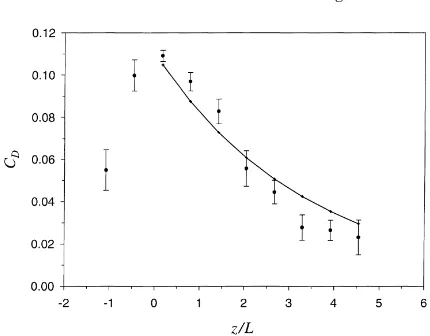
Nonetheless, Blanken et al. (1998) found Monin– Obukhov similarity theory to work well for σw/u∗ =f(z/L) in the subcanopy, where σw is the standard deviation of the vertical velocity fluctuations. Fur-thermore, they concluded that discarding records that deviated significantly from Monin–Obukhov simi-larity theory, seemed more consistent than the usual threshold criteria for the friction velocity. In the present analysis, the drag coefficient decreases by an order of magnitude as z/L varies from near neutral to very stable conditions. Therefore, a formulation for a stability-dependent drag coefficient seems justified, even if information on its height-dependence in the subcanopy is unavailable.
Fig. 6. The drag coefficient at 4 m averaged for different stability bins and Eq. (4) (solid line).
pattern in terms of z/L but not as pronounced. How-ever, roughness sublayer effects are suspected. Shaw et al. (1988) found that the drag coefficient at the top of a forest canopy showed large scatter for unstable conditions without a clear dependence on z/L while the drag coefficient for neutral and stable conditions was qualitatively similar to that in Fig. 6.
One might have expected the drag coefficient to increase with increasing instability since upward buoyancy flux generates turbulence and augments downward momentum transport. Explanations for the unexpected stability-dependence in the subcanopy could be:
1. Artificial self-correlation augments the perceived performance of most similarity theories. Here arti-ficial correlation is due to the fact that both the drag coefficient and the magnitude of z/L depend on u∗. Simulations performed by randomly varying the values of the wind speed, friction velocity and heat flux show that small values of the drag coefficient occur at large stability and large instability due to artificial correlation. Random variations which pro-duce small values of u∗ also produce large magni-tudes of z/L. For the present data, artificial corre-lation could account for a small but non-negligible fraction of the decrease of the drag coefficient with increasing instability. The exact fraction depends on the fit of the data to z/L.
2. With weak winds for the unstable case, fluxes are not reliable. Large attack angles may lead to larger
flow distortion. The momentum flux is thought to be more vulnerable to flow distortion than the heat flux.
3. With windy subcanopy conditions, the footprint is larger compared to weak wind conditions. Black et al. (1996) found significant differences in surface heat fluxes measured between the two towers at the aspen site, suggesting that heterogeneity is im-portant, apparently due to microscale variations of vegetation and soil moisture as well as sun flecks. However, the drag coefficient also decreases with increasing instability at the main tower, although the decrease is not as systematic. Apparently, the surface heterogeneity is not the main cause of the decrease of the drag coefficient with increasing in-stability.
4. With weak winds and strong heat fluxes, the con-vection originating from the canopy top may reduce the downward transport of turbulence into the sub-canopy. Examination of this hypothesis from the existing data was inconclusive.
One could form additional arguments in terms of the intermittency of the transport, interaction between trunk wake turbulence and convective eddies or the physics of airflow around leaves. However, these ar-guments cannot be adequately evaluated from existing data.
Until further observational evidence becomes avail-able, we recommend ignoring the stability-dependence for the unstable case and using an averaged value of
CD=0.11 for the near-neutral and unstable cases. For near-neutral conditions, the log profile corresponds to a roughness length of approximately 2 m. This value is simply a statistical fit and not necessarily uniquely related to the physical characteristics of the understory. For stable cases, the Dyer (1974) stability function, which was not intended for subcanopy con-ditions, substantially overestimates the decrease of the drag coefficient with increasing stability. Assump-tions for Monin–Obukhov similarity theory are not met in the subcanopy. Nonetheless, a reasonable fit (Fig. 6) is
CD=CD0 exp
−αz
L
L. Mahrt et al. / Agricultural and Forest Meteorology 101 (2000) 67–78 77 This relationship undoubtedly depends on trunk
characteristics, the relative height with respect to un-derstory and overstory, and openness of the overlying canopy. As a final complication, the wind and stress directions were not always well-aligned. It is not known if these deviations are physical or sampling problems.
7. Conclusions
The vertical structure of the flow in the old aspen canopy in BOREAS has been examined in terms of thermocouple profiles and sonic anemometers above, within, and below the aspen canopy. On clear nights, a strong surface inversion develops in the lower part of the subcanopy in contrast to more closed canopies where strong subcanopy stratification does not de-velop. Disturbances that propagate downward through the canopy do not penetrate into the strong subcanopy surface inversion. On clear nights with weak winds, a second weaker inversion develops at the top of the radiating aspen canopy, although significant mixing events easily eliminate this inversion.
On average, the subcanopy is very stable in the early evening and becomes less stable later in the evening. This appears to be due to a general increase in wind speed above the canopy during the night. However, the integrity of the subcanopy surface inversion is gener-ally maintained. On some of the nights, the stability of the flow in and above the canopy suddenly decreases in association with cold air advection. The origin of these cold fronts is not known, but they could be due to propagation of cold air drainage from outside the area. These events generally lead to increased mixing although the details of such events vary substantially between nights. The event nature of the fluxes on some nights and the influence of advection by larger scale motions compromise the ability to estimate represen-tative nocturnal fluxes from a single site.
The drag coefficient for the subcanopy stress ex-hibits a maximum at neutral stability and systemat-ically decreases with increasing subcanopy stability. The subcanopy drag coefficient also decreases, to a lesser extent, with increasing instability. Investigation of a number of hypotheses for this unexpected de-crease with instability was inconclusive.
Acknowledgements
This material is based upon work supported by NASA Grant NAG5-7416 and Grants DAAH04-96-10037 and DAAD19-9910249 from the U.S. Army Research Office.
References
Amiro, B.D., 1990. Comparison of turbulence statistics within three Boreal forest canopies. Boundary-Layer Meteorol. 51, 99–121. Baldocchi, D., 1997. Flux footprints within and over forest
canopies. Boundary-Layer Meteorol. 85, 273–292.
Baldocchi, D.D., Meyers, T.P., 1991. Trace gas exchange at the floor of a deciduous forest I. Evaporation and CO2 efflux. J. Geophys. Res. 96, 7271–7285.
Baldocchi, D.D., Vogel, C., 1997. Seasonal variation of energy water vapor exchange rates above and below a boreal jack pine forest canopy. J. Geophys. Res. 102, 28939–28951.
Black, T.A., den Hartog, G., Neumann, H.H., Blanken, P.D., Yang, P.C., Russell, C., Nesic, Z., Lee, X., Chen, S.G., Staebler, R., Novak, M.D., 1996. Annual cycles of water vapour and carbon dioxide fluxes in and above a boreal aspen forest. Global Change Biol. 2, 219–229.
Blanken, P.D., Black, T.A., Yang, P.C., Neumann, H.H., Nesic, Z., Staebler, R., den Hartog, G., Novak, M.D., Lee, X., 1997. Energy balance and canopy conductance of a boreal aspen forest: partitioning overstory and understory components. J. Geophys. Res. 102, 28915–28927.
Blanken, P.D., Black, T.A., Neumann, H.H., den Hartog, G., Yang, P.C., Nesic, Z., Staebler, R., Chen, W., Novak, M.D., 1998. Turbulent flux measurements above and below the overstory of a boreal aspen forest. Boundary-Layer Meteorol. 89, 109–140. Blumen, W., Grossman, R., Piper, M., 1999. Analysis of heat budget, dissipation and frontogenesis in a shallow density current. Boundary-Layer Meteorol. 91, 281–306.
Dyer, A.J., 1974. A review of flux-profile relationships. Boundary-Layer Meteorol. 7, 363–372.
Gao, W., Shaw, R.H., Paw U, K.T., 1989. Observation of organized structure in turbulent flow within and above a forest canopy. Boundary-Layer Meteorol. 47, 349–377.
Hu, X., Lee, X., 1998. Kelvin-Helmholtz billows over a forest canopy, Twenty-Third Conf. Agric. For. Meteorol., Am. Meteorol. Soc., Albuquerque, 429–430.
Hogg, E.H., Black, T.A., den Hartog, G., Neumann, H.H., Zimmermann, R., Hurdle, P.A., Blanken, P.D., Nesic, Z., Yang, P.C., Staebler, R.M., McDonald, K.C., Oren, R., 1997. A comparison of sap flow and eddy fluxes of water vapor from a boreal deciduous forest. J. Geophys. Res. 102, 28929–28937. Jacobs, A.F.G., van Boxel, J.H., Elkilani, R.M.M., 1994.
Night-time free convection characteristics within a plant canopy. Boundary-Layer Meteorol. 71, 375–391.
E.-D., 1998. Evaporation from a central Siberian pine forest. J. Hydro. 205, 279–296.
Lee, X., 1998. On micrometeorological observations of surface air exchange over tall vegetation. Agric. For. Meteorol. 91, 39–49. Lee, X., Shaw, R., Black, T.A., 1994. Modelling the effect of mean pressure gradient on the mean flow within forests. Agric. For. Meteorol. 68, 201–212.
Lee, X., Neumann, H.H., den Hartog, G., Fuentes, J.D., Black, T.A., Mickle, R.E., Yang, P.C., Blanken, P.D., 1997. Observations of gravity waves in a boreal forest. Boundary-Layer Meteorol. 84, 383–398.
Lee, X., Barr, A.G., 1999. Climatology of gravity waves in a forest. Q. J. R. Meteorol. Soc. 124, 1403–1419.
Mahrt, L., Larsen, S., 1982. Small scale drainage front. Tellus. 34, 579–587.
Mahrt, L., Sun, J., Blumen, W., Delaney, A., McClean, G., Oncley, S., 1998. Nocturnal boundary-layer regimes. Boundary-Layer Meteorol. 88, 255–278.
Raupach, M.R., 1989. Applying Lagrangian fluid mechanics to infer scalar source distributions from concentration profiles in plant canopies. Agric. For. Meteorol. 47, 85–108.
Raupach, M.R., Shaw, R.H., 1982. Averaging procedures for flow within vegetation canopies. Boundary-Layer Meteorol. 22, 79–90.
Raupach, M.R., Coppin, P.A., Legg, B.J., 1986. Experiments on scalar dispersion within a model plant canopy Part I. The ‘turbulence structure’ Boundary-Layer Meteorol. 35, 21–52. Shaw, R.H., den Hartog, G., Neumann, H.H., 1988. Influence of
foliar density and thermal stability on profiles of Reynolds stress and turbulence intensity in a deciduous forest. Boundary-Layer Meteorol. 45, 391–409.
Shuttleworth, W.J., Gash, J.H.C., Lloyd, C.R., Moore, C.J., Roberts, J., Filho, A., Fisch, G., Filho, V., Ribeiro, M., Molion, L., Abreu de Sa, L., Nobre, J., Cabral, O., Patel, S., de Moraes, C., 1985. Daily variations of temperature and humidity within and above Amazonian forest. Weather 40, 102–108.
Stull, R.B., 1990. An Introduction to Boundary Layer Meteorology. Kluwer Academic Publishers, Boston, 666 pp.