POINT CLOUD SERVER (PCS) : POINT CLOUDS IN-BASE MANAGEMENT AND
PROCESSING
R´emi Cura, Julien Perret, Nicolas Paparoditis
Universite Paris-Est, IGN, SRIG, COGIT & MATIS, 73 avenue de Paris, 94160 Saint Mande, France [email protected], [email protected], [email protected]
KEY WORDS:RDBMS, point cloud, point cloud management, point cloud processing, filtering, indexing, compression, point cloud storage, point cloud I/O, point cloud generalisation, patch, point grouping
ABSTRACT:
In addition to the traditional Geographic Information System (GIS) data such as images and vectors, point cloud data has become more available. It is appreciated for its precision and true three-Dimensional (3D) nature. However, managing the point cloud can be difficult due to scaling problems and specificities of this data type. Several methods exist but are usually fairly specialised and solve only one aspect of the management problem. In this work, we propose a complete and efficient point cloud management system based on a database server that works on groups of points rather than individual points. This system is specifically designed to solve all the needs of point cloud users: fast loading, compressed storage, powerful filtering, easy data access and exporting, and integrated processing. Moreover, the system fully integrates metadata (like sensor position) and can conjointly use point clouds with images, vectors, and other point clouds. The system also offers in-base processing for easy prototyping and parallel processing and can scale well. Lastly, the system is built on open source technologies; therefore it can be easily extended and customised. We test the system will several billionpoints of point clouds from Lidar (aerial and terrestrial ) and stereo-vision. We demonstrate∼400 million pts/hloading speed, user-transparent greater than2 to 4:1compression ratio, filtering in the approximately50msrange, and output of about a million pts/s, along with classical processing, such as object detection.
1. INTRODUCTION
The last decades have seen the rise of GIS data availability, in par-ticular through the open data movement. Along with the traditional raster and vector data, point clouds have recently gained increased usage1. Sensors are increasingly cheap, precise, and available, and the point cloud complements images naturally. However, due to their massive unstructured nature and limited integration with other GIS data, the management of point clouds still remains challenging. This makes point cloud data barely accessible to non-expert users.
With many point clouds, data sets are commonly in the teraByte (TByte) range and have very different usages; therefore every as-pect of their management is complex. The first difficulty is simply knowing which data-sets are available and where. Dealing with (extended) meta-data is difficult, especially without a standard data format. Because data is so big, it is essential to compress it, while maintaining a fast read and write access. Similarly, so much data cannot be duplicated and must be shared, which introduces concurrency issues. Efficiently extracting (filtering) only the part of the data needed is also important. Because displaying billions of points is not possible, visualising point clouds necessitates Level Of Details (LOD) strategies. Point clouds are geospatial data complementary to vectors and rasters. Thus, they need to be used conjointly to other data types, either directly or by converting point clouds to images or vectors. Lastly, some users need to design custom processing methods that must be fast and easy to design, scale well, and be robust.
In this article, we propose the investigation of the use of a point cloud server to solve some of these problems. The proposed server architecture provides perspective for metadata, scalability, concurrency, standard interface, co-use with other GIS data, and fast method design. We create an abstraction level over points
1
www.opentopography.org
clouds by dealing with groups of points rather than individual points. This results in compression, filtering, LOD, coverage, and efficient processing and conversion.
Historically, point clouds have been stored in files. To manage large volumes of these files, a common solution is to build a hi-erarchy of files (a tree structure) and access the data through a dedicated set of softwares. This approach is continuously im-proved (Hug et al.,2004;Otepka et al.,2012;Richter and D¨ollner, 2014) and a detailed survey of the features of such systems can be found in (Otepka et al.,2013). However, using a file-based system has severe limitations. These systems are usually built around one file format, and are not necessarily compatible. Recent efforts have been made towards format conversion2. Moreover, these systems are not adapted to share data and use it with several users simultaneously (concurrency).
Hofle (2007) proposed to use DataBase Management System (DBMS) to cope with concurrency. The DBMS creates a layer of abstraction over the file-system, with a dedicated data retrieval lan-guage (SQL), native concurrency capabilities (supporting several users reading/writing data at the same time), and the wrapping of user interaction into transactions that can be cancelled in case of errors. The DBMSs have also been used with image and vector data for a long time, and the possibility to define relations in the RDBMSs (Relational DBMS) offers a simple way to create robust data models. Adding the capacity to create point clouds as ser-vices, DBMSs solve almost all the problems we face when dealing with point clouds. Usually, the database stores a great number of tables, and each table stores a point per row (Lewis et al.,2012; Rieg et al.,2014). Such a database can easily reach billions of rows. Nevertheless, storing this many rows is problematic because DBMSs have a non-negligible overhead per row, which reduces the scaling possibilities, regarding the time it takes to create it, to index it, or in the final space it takes.
2
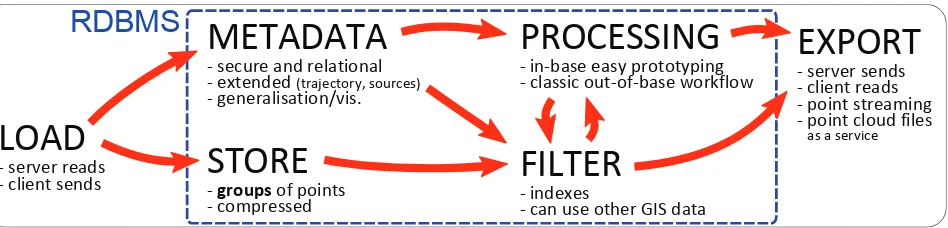
LOAD
- server reads
- client sends
STORE
- groups of points - compressedMETADATA
- secure and relational - extended (trajectory, sources)
- generalisation/vis.
FILTER
- indexes
- can use other GIS data
PROCESSING
- in-base easy prototyping - classic out-of-base workflow
EXPORT
- server sends - client reads - point streaming - point cloud files
as a service
RDBMS
Figure 1: In-base point cloud management pipeline.
These limitations have been studied and inspired NoSQL databases. Again, the proposed NoSQL databases are used to store individual points (Martinez-Rubi et al.,2014,2015;van Oosterom et al., 2015;Wang et al.,2014). NoSQL database are stripped DBMSs that have been specially tailored for massive and weakly relational data. They scale extremely well to many computers. However, this comes at a price. NoSQL databases must drop some guarantees on data, are not integrated with other GIS data, and have much less functionality. Indeed, NoSQL databases are closer to being a file-system distributed on many computers (with efficient index-ing) than being DBMSs. Thus massive scaling still necessitates specialised hardware, and the people to maintain it.
A possible workaround for this issue is to externalise the storage3 to cloud computing facilities, like Amazon S3, but it suffers from the same aggravated limitations as the NoSQL.
Figure 2: Simplified schema for ”Server reads” data loading
All the previous data management systems try to solve a very diffi-cult problem, managing massive number of points. The solutions that scale well must focus on data storage and retrieval, and drop the rest of the management problem. Recently, a new approach was proposed bypgPointCloud(2014). The idea is to manage groups of points (called patches) rather than points in a RDBMS. Creating this abstraction layer over points allows retention of all the advantages of an RDBMS, but without the overhead due to a great number of rows. Moreover, the proposed abstraction offers new theoretical possibilities. In this article, we present a point cloud management system fully based onpgPointCloud(2014) and open source tools. We test this system in every aspects of point cloud management to prove that it answers all the global needs of point cloud users.
Following the IMRAD format (Wu,2011), the remainder of this article is divided into three sections. Section2. presents the proposed system principles and details each of its parts. Section3. reports on the experiments that validate each part of the system. Finally, the details of the system and new potential applications are discussed in Section4.
2. METHOD
The proposed solution relies on a PostgreSQL(2014) RDBMS server using the PostGIS(2014) and pgPointCloud(2014) ex-tensions. The key idea is to store groups of points into the server
3
https://github.com/hobu/greyhound
table. Groups of points are called patches of point. An XML schema defines the size and nature of each attribute for each point type.
The user can load data into the server by several common means (using major programming languages, Bash, SQL, Python), from any format of point cloud that can be expressed as a list of values. Point clouds are stored without loss and are compressed. The very sophisticated database indexes allow efficient filtering of the points. Point clouds can be used with vector and rasters and other point clouds. Metadata are integrated and exploited. Furthermore, point clouds can be easily converted into other GIS data (vector/raster). Processing methods are directly accessible within the database; more can be added externally or internally. Attaining points from the database is also easy and can be done in several ways (whole files, specific points and streaming).
Briefly, storing groups of points offers the advantages of generali-sation (potentially more complex semantic objects), reduces the number of rows by several orders of magnitude, reduces index sizes, allows efficient compression, and offers a common frame-work for different types of points. Working on groups of points separates the filtering and retrieving of points. Groups can also be easily split or fused at any point after data loading. However, to obtain an individual point, we need to get the full group first. This means that grouping points is only possible when points can be categorised into groups that are coherent for the intended applications.
Choosing to use groups of points instead of individual points creates a generalisation of the data. For instance, if a group of points locally forms a plan, geometrically representing this group of points by a plan provides many more opportunities than just reducing storage space. The plan is another representation of the underlying object that has been sensed, and could be further used as a semantical part of another, more complex object (a building fac¸ade, for instance by Lafarge et al.(2013)). We propose several generalisations that are tailored to different needs (Figure9).
2.1 Loading
Writing data in a PostgreSQL RDBMS is standard. There are conceptually two kinds of solutions. Either the database reads the data (’server reads’), or a client connects to the server and writes the data (’client writes’). Clients exist in all major programming languages.
DBMSs are build for concurrency, we illustrate both of these methods with parallelism.
Distributed parallel loading (’Client sends’) In previous method, the database performs the grouping of points into patches and the actual writing of patches into tables. We could lessen the workload of the server by allowing the client do the grouping.
We design a loading method of type ’client sends’ (Python).
It is similar to the method adopted by the PDAL4project. The clients read point cloud files, group points into patches, and send the patches to the database. The database compresses the patches and writes them into the final point cloud table.
2.2 Point Cloud and Context
The RDBMS has been designed to create relationships between data. Our system manages point clouds rather than points. In particular, our system can store the full meta-data model, as well as more indirect meta-data like the trajectory of the sensor. It is also possible to use several point clouds together as well as mix point clouds and other GIS data (raster and vector), directly or after converting point clouds to other GIS data types.
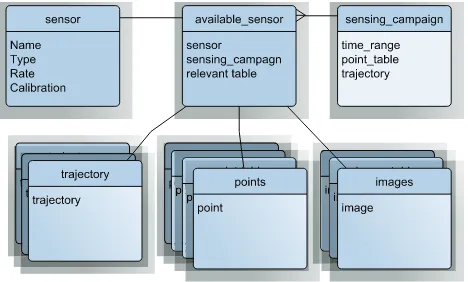
Figure 3: Example of a data model to store metadata. A more realistic data model is given byHofle(2007, p. 15).
Managing metadata The point cloud server offers the perfect space to regroup all the metadata concerning the point cloud. Unlike a file, it is possible to create a real relational model of the metadata and to enforce it (automatically). It guarantees coherency and enables searching points with a given set of characteristics. For instance, looking for stereo-vision points rather than Lidar points for an application based on colours.
Extended metadata We can extend the classical notion of meta-data a step further and consider that it also concerns the raw in-formation that was used to create the point cloud. For Lidar point clouds, this would be the trajectory and position of the sensing device, along with the raw sensing files. For stereo point clouds, this would be the camera poses for every image used to construct the point cloud, along with the images. This information can be stored in the server, and leveraged in filtering (see Section3.5) or processing.
Using several point clouds and other GIS data Point clouds are created by different sources, like stereo-vision, aerial Lidar, terrestrial Lidar, RGBZ device (Kinect), etc. The point cloud server mixes all this data, along with other GIS data (rasters and vectors). Vectors and rasters are stored and exploited using Post-GIS(2014). We can use geo-referenced point clouds together. For instance, a user asks for points in a given area. The user obtains points from a large 1 pt/m2
aerial Lidar point cloud automati-cally complemented by a more detailed but very local 10kpts/m2 stereo-vision point cloud.
4
www.pdal.io
Coverage map Using the server, we create metadata-like point clouds coverage (Figure7, 8), similarly to (Lewis et al.,2012, Figure 8). With this map, one can instantaneously and easily check what type of point cloud is available in a given area using a colour code (for instance).
Point cloud as raster or vector In the spirit of generalisation (see Section2.), it is advantageous for some applications to convert points to other GIS data types, such as raster or vectors, directly within the database. We propose several in-base groups of points vector representation, such as bounding box, oriented bounding box, concave envelope similar to alpha shape (Edelsbrunner et al., 1983), and 3D plans (Figure9). These representations can be used to extract information at the patch level, accelerate filtering, enable large scale visualisation, etc. We also propose two in-base means to convert points to multi-band rasters by a Z projection. Rasterisa-tion is a common first step in the literature because neighbourhood relations are explicit between pixels, unlike points.
conversion to raster
bilateral filter
gradient
Line detection
Figure 4: A piece of a point cloud is converted to a raster. We use bilateral smoothing, gradient (Sobel), and line detection (RRANSAC byChum and Matas(2002)) to reconstruct the pedes-trian crossing. These operations are much faster and easier on rasters rather than points.
2.3 Filtering Point Cloud
Point clouds are big; yet, we often need a very small part (Figure 5, parameters in3.5). Thus, the capacity to filter a point cloud is essential for many uses. Acceleration structures are the accepted solutions. This essentially creates indexes on the data to accelerate searches. Octree, B-tree, R-tree, and Morton-curves are popular acceleration structures. Designing and optimising these indexes is a major research subject (see (Kiruthika and Khaddaj,2014), for instance) and is also the main designing factor in point cloud management systems.
Filtering strategy Because our system stores patches (groups of points), we can separate the filtering and the retrieving of data. Our strategy is to first efficiently filter data at the patch level (reducing points from billions to millions, for instance), then, if necessary, further filter the remaining points.
Indexing Our system extensively uses indexes (BTree, RTree) that are native to PostgreSQL. We index patches (not points). Basically, these indexes answer in about10msto any filtering, such as ’What are the patches withfbetween .. and ..’;fcan be anything, a spatial position, an attribute of the points, a function, etc.
Figure 5: Among billions of points, only those respecting complex filtering conditions are kept. Results are shown in QGIS. Parameters in3.5
instance), we do not need to recomputef each time for every patch, nor store f results.
PostgreSQL also determines whether to use the indexes or not. In some cases, it will be faster to simply read all the data (sequential vs. random access). This decision is based on statistics on tables and a genetic optimisation.
Filtering example The following query illustrates possible fil-tering.
SELECTg i d , p a t c h
FROMt m o b 2 0 1 4 0 6 1 6 . r i e g l p c p a t c h s p a c e
WHERE/∗f i l t e r i n g c o n d i t i o n∗/ /∗s p a t i a l f i l t e r i n g∗/
S T I n t e r s e c t s ( p a t c h : : g e o m e t r y , . . . ) =TRUE
/∗f i l t e r i n g on a f u n c t i o n∗/
ANDP c N u m P o i n t s ( p a t c h )BETWEEN10AND1000 /∗f i l t e r i n g on an a t t r i b u t e r a n g e∗/
ANDr c c o m p u t e r a n g e f o r a p a t c h ( p a t c h , ’ g p s t i m e ’ ) && numrange ( 1 3 , 1 4 )
/∗f i l t e r i n g on o r i g i n a l s o u r c e f i l e name w i t h r e g e x p∗/
ANDf i l e n a m e ILIKE E ’ .∗TerMob .∗ 2 . p l y ’
/∗k e e p i n g o n l y p o i n t s t h a t a r e i n s i d e b u i l d i n g s ( v e c t o r l a y e r )∗/
AND EXISTS ( SELECT1
FROMo p d a r i s c o r r e c t e d . v o l u m e b a t i
WHERE S T I n t e r s e c t s ( p a t c h : : g e o m e t r y , v o l u m e b a t i . geom ) )
2.4 Output
Similarly to Section2.1, we divide the methods into two categories. The first family of solutions is that the server writes the points somewhere (’server writes’). The second family of solution is when the client reads the data from the server and do something with it (’client reads’).
Using PostgreSQL drivers/connector (’client reads’) PostgreSQL can be accessed using many programming languages, thus any PostgreSQL driver can be used to connect to the server and output points. This work-flow is very similar to what a classical pro-cessing program would do, ’open point cloud file, read points, do processing, write results’ becomes ’connect to server, read points, do processing, write results on the server or elsewhere’.
The additional capabilities are that the user does not have to read a whole file (or any files) if the user is interested in only a few points. Using the point cloud server, the user can directly filter the point cloud to obtain only the points desired, and even use in-base processing or LOD to further change the points obtained.
PLY File As a Service (PLYFAS) ’server writes’ Our system can be used transparently with a file-based workflow. Indeed, users may already have legacy processing tools that work with files. Of course, these tools could be easily adapted to read points from the database and not from files, but users may want to use their usual tools as-is. For this case, we propose PLYFAS, an easy means to export points from the database and create a .ply file.
The user can use the small PLYFAS API to request the database to create a ply file from any set of points. The user may simply want one of the exact original point cloud files that were loaded into the point cloud server. However, the user has also access to much more power and can request a file with filtered points by any means introduced in Section2.3, or with the additional processing results of Section2.5. For instance, the user can request all the points in a given area that have been classified as ’building parts’ with a given confidence, and that were sensed during the second week of March 2014.
Massive parallel export (’client reads’) We also designed a Python method to perform massive parallel export. Similarly to Section2.1, the goal is to reduce the work done on the server and increase the work done on the clients. In this version, the server sends raw binary uncompressed patches (groups of points), and the transformation to points is done by the client.
Asynchronous point cloud streaming to browser (’client reads’) The last output possibility is to stream points in a web context. The goal is to display a point cloud into a web browser with back-ground loading (i.e., the points are displayed as they arrive, the user keeps browsing and the loading is non-blocking).
For this, we use a Node.js server between the client and the point cloud server, which enables non-blocking interactions. From a point cloud server perspective, the task is standard (give points that are at a given place).
2.5 Processing Point Cloud with the Server
the results in the server. However, our system also offers in-base processing. Processing methods become very close to the data and can be reused or combined to create more complex methods. It is also more practical because the client does not have to install anything (all methods are on the server).
An advantage of in-base processing is that it is easy to add new processing methods. These methods can be written for efficiency (C, Cpp) or using high level languages (Python, R) for very fast prototyping. The most useful in-base processing functions are fast and simple. This way, the newly written functions can be used in other aspects of the point cloud server, such as indexing, or be combined directly in SQL queries. For instance,
SELECT t r a i n c l a s s i f i e r ( e x t r a c t p l a n ( p a t c h ) , e x t r a c t f e a t u r e 1 ( p a t c h ) ,
We design several experiments to test all parts of our point cloud server. All experiments have ample room for optimisation, and can be easily reproduced (open source tools). We use PostgreSQL 9.3, PostGIS 2.2, PgPointCloud 1.0, Python 2.7, and a recent (2014) version of Numpy and Scipy.
Result at the system level Overall, we load several billion points into the point cloud server, perform several processing in and out of base (sto hour), extensively use simple and com-plex filtering (msands), convert points to images and vectors, and output points (≥100k pts/s). The entire system works as in-tended and is efficient and powerful enough to be used in research settings.
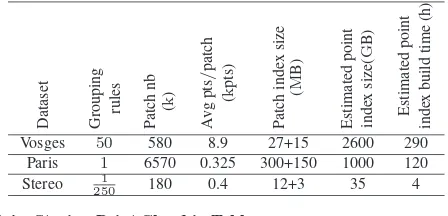
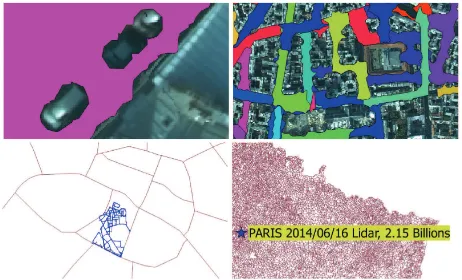
Data sets used For this article, we use three data sets (includ-ing (IQmulus,2014)). (See Figure6). They were chosen to be as different as possible to further evaluate how proposed methods can generalise on different data (Figure1). We emphasize that the Vosges dataset is a massive aerial Lidar point cloud covering mountains and forests.
Table 1: Point cloud data-sets used, with some figures. AL stands for aerial lidar, TL for terrestrial lidar and SPC for stereo point cloud.
Experiments Hardware We tested all our methods on two set-tings. The development settings are portable (the point cloud server is hosted on a virtual box on an external drive), the server settings is powerful and offers much more storage place (12 cores, 20 Go RAM, SSD for OS, regular disk for storage, Ubuntu 12.04). We try to provide timing, but these are orders of magnitude be-cause of influence of caching and configuring.
3.2 Input
Parallel loading (’server reads’) In one night, we aim at load-ing the data sensed by a Lidar system durload-ing one day, which is a practical Lidar management requirement. The points are stored
Table 2: Loading time for each point cloud data set.
Dataset Loading time Parallelism Loading speedkpts/s
Vosges 11h30 8 125
Paris 8h 6 74.5
Stereo 7min20 7 160
in files, over a gigabyte network. We uses a dedicated program to convert the points file into ASCII values (CSV). We modified the RPly library5for the .PLY point cloud, and use Lastool6for .las files. The ASCII values are streamed to a ’psql’ process that is connected to the database. The ’psql’ executes a ’COPY’ SQL command that reads the ASCII streams and creates and fills a table with the values from the ASCII stream. When the file has been fully streamed, we use an SQL query to create points from attributes and group them into patches. These patches are inserted into the final patch table. This pipeline (Figure2) is executed several times in parallel, each pipeline working on a different file.
Distributed parallel loading (’client sends’) In this experi-ment, we use clients to send uncompressed patches to the server. The clients read point cloud files (.ply in our experiment, using the plyfile7Python module ). Then, each client groups the points into patches using a custom Python module. The patches are sent to the server through Python. The server compresses these patches and adds them to the final point cloud table. This experiment is a proof of concept; therefore, we limit the number of clients to one computer, using seven threads.
Result We load Vosges and Paris data set through ’massive parallel loading’, and stereo through ’out of database grouping’ (Table2). For both methods, the bottleneck is not the CPU but the input/output (I/O). Indeed, the point files are read over the network, and the point tables are stored on the SSD, but the final patch table is stored on the regular disk, which also limits how many threads can write data on it at the same time.
Result We load Vosges and Paris data set through ’massive parallel loading’, and stereo through ’out of database grouping’ (Table2). For both methods, the bottleneck is not the CPU but the input/output (I/O). Indeed, the point files are read over the network, and the point tables are stored on the SSD, but the final patch table is stored on the regular disk, which also limits how many threads can write data on it at the same time.
3.3 Storing Point Cloud in Table
Table 3: Creating and indexing patches for the test data set compared to non-grouped scenario. Grouping rules are: 50 =
f loor(X
Dataset Grouping rules Patch
nb
Vosges 50 580 8.9 27+15 2600 290
Paris 1 6570 0.325 300+150 1000 120
Stereo 2501 180 0.4 12+3 35 4
3.4 Storing Point Cloud in Table
Grouping points Points must be categorised into groups that will make sense for subsequent uses of the point cloud. Groups
Figure 6: Vosges dataset (aerial Lidar), Paris dataset (terrestrial Lidar), Stereo dataset (Stereovision)
Table 4: Analysing compression ratio.
Dataset BillionPoints Disk sizeGByte
Server size GByte
Compression ratio
Vosges 5.2 170 39 4.36
Paris 2.15 166 58 2.86
Stereo 0.070 1 0.49 2.05
Table 5: Analysing compression and decompression computing cost.
Dataset Subset sizeMillion pts CompressingMillion pts/s DecompressingMillion pts/s
Vosges 473.3 4.49 4.67
Paris 105.7 1.11 2.62
Stereo 70 2.44 7.38
of points must be big enough to have a tractable number of rows, but not too big because getting only one point still necessitates obtaining the entire group. We designed grouping rules so that the number of rows is less than a few millions -i.e., fitting in server memory (Table3). Moreover, this range of numbers of rows is classical for GIS software. We can afford to have very large groups as a result of the PostgreSQL TOAST8storage system.
Grouping is done at data loading but can be changed at any time. Index creation is very fast (a few seconds to a few minutes), and the index size is≤1 %of the point cloud size.
Indexes are built on the patches and not on the points, and thus are several orders of magnitude smaller and much faster to build. We estimate the size of indexes if we were to store one point per row rather than one patch per row (extrapolating index size and build time observed on 0.01 to 10 million-row tables). See Table3.
Compressing point clouds Patches are compressed before stor-age. We compare loaded data-set space occupation on the server with original binary files on the disk. In our case, patches are compressed attribute-wise, with either a run-length, common bit removal, or zip strategy. Compressing efficiency widely varies depending on the data and the kind of attributes of the points. See Table3.4.
Compressing and decompressing data introduces an overhead on data access. We estimate it by profiling the uncompress and compress functions. Again, the overhead is dependent on the type and number of attributes. For instance stereo contains double attributes that are compressed with the zip strategy, which is slower in compression. See Table5.
3.5 Point Clouds and Context
Our point cloud server manages point clouds, as opposed to sets of points. First, we demonstrate the construction of several two-dimensional (2D) vectorial visualisations of point clouds. We
8
http://www.postgresql.org/docs/current/static/ storage-toast.html
demonstrate the possibility to work on all point clouds at the same time, transparently for the user. Point clouds can also be used conjointly with other GIS data (raster and vector). Lastly, we demonstrate an example of use of the sensor trajectory meta-data.
Figure 7: Successive visualisations of point cloud coverage, see 3.5for details
Coverage visualisation Creating a coverage visualisation is easy (about30SQL lines) and fast (about150s, one thread) with our point cloud server. Indeed, instead of working with billions of points, we can work with millions of patches (generalising the points).
We created several visualisations for the Paris dataset, ranging from5MByte to100kByte, each adapted to a different scale. (see Figure7)
• 1:25 to 1:1500: Precise, occlusions visible (∼1m).
• 1:1500 to 1:15k: Help to understand road network structure (∼8m).
• 1:15kto 1:200k: Use the trajectory. If not available, fabricate a trajectory-ersatz through basic straight skeleton
• ≥1:200k: A simple point with text attributes for details.
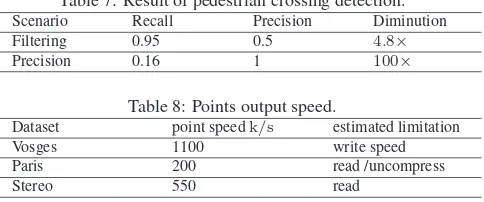
Table 6: Result of filtering.
As a proof of concept, we propose a coverage hexagonal grid (see Figure8), conceptually identical to regular grid, with some benefits (see (Sahr,2011)). The idea is to visualise both what was sensed and what remains to be sensed in a given area (here the whole of Paris), to help plan data-sensing missions. We fabricate an hexagonal grid over the extent of Paris (about30s), and remove the hexagons that are in buildings or too far from road (about
60s). Then we colour the hexagon depending on whether the point clouds cover it or not(about30s) (Red is not sensed, blue is sensed). Such visualisation are easy to create (about 30 minutes), and could be tailored to more specific needs.
Using several point clouds As a proof of concept of integration of several point clouds, we demonstrate the conjoint use of stereo-vision point cloud and Lidar point cloud. For this experiment, we choose to use PostgreSQL inheritance mechanism. The idea is to create a ’parent’ table. We set the Lidar table and stereo-vision table to be a ’child’ of the ’parent’ table. Then we can query the ’parent’ table as if it was a super-point cloud comprised of all the others. Querying the ’parent’ point cloud is as fast as querying one point cloud, and we correctly attain points from both point clouds.
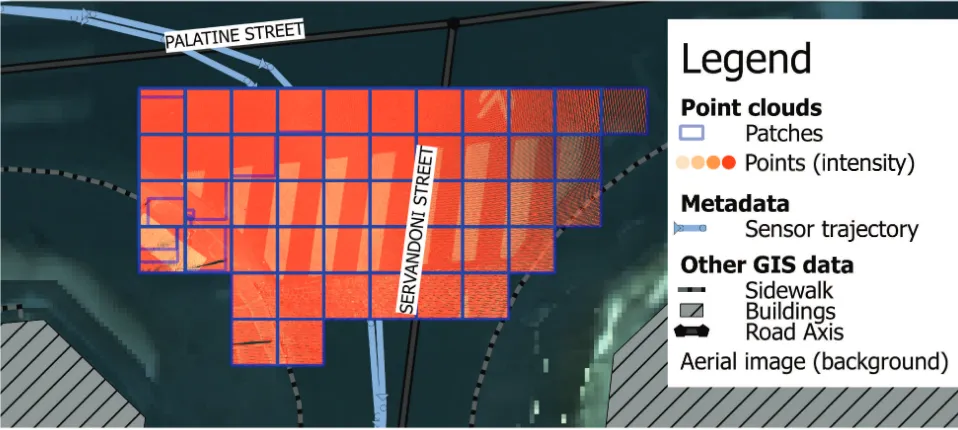
Conjoint use with other GIS data We commonly used vector data with point clouds for various research projects. Here, the scenario is to provide points for a pedestrian crossing detection al-gorithm, at a given intersection of the road network (see Figure5). To demonstrate the possibilities, we use the following:
• Corrected version of ODParis9building layer (350krows)
• Lidar sensor trajectory (42kpoints regrouped in 900 rows)
• Road network data of BDTopo10(32krows)
• Aerial photo of the area in a PostGIS raster table (110krows, each30×30pixels), base pixel of 10cm
We simultaneously filter the massive Paris point cloud to obtain patches that include the following:
• close to the intersection of street ’Palatine’ and ’Servandoni’ (≤10m+ road width)
• close to Lidar acquisition centre trajectory (≤3m)
• far from buildings (≥1m)
• with high density (≥1000 points/m3 )
• where the aerial view has a colour compatible with street markings (240≤mean intensity≤350)
The point cloud server finds all the patches concerned in 60ms
(with index and optimally written query) (see Figure5and Table 6).
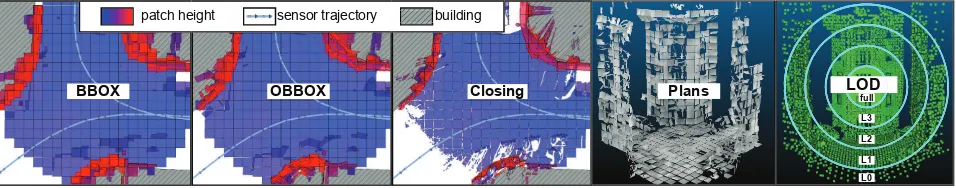
Point cloud as a raster or vector We construct abstract repre-sentations of patches that are sufficient for one task, and are much more efficient than using the points, including the following:
• 2D bounding box (’bbox’) (default)
• oriented bounding box (’obbox’), light
• multi-polygon obtained by successive dilatation and erosion of points (’closing’), big to store, very accurate
9
http://opendata.paris.fr/page/home
10
http://professionnels.ign.fr/bdtopo
Table 7: Result of pedestrian crossing detection.
Scenario Recall Precision Diminution
Filtering 0.95 0.5 4.8×
Precision 0.16 1 100×
Table 8: Points output speed.
Dataset point speedk/s estimated limitation
Vosges 1100 write speed
Paris 200 read /uncompress
Stereo 550 read
These generalisations are about 0.5% of the compressed patch size. We also tested 3D generalisations, either by extracting primitives or using LOD.Lafarge et al.(2013) showed that the urban point clouds can be accurately represented by primitives. For instance, a dozen plans accurately explains (≤1cm) 70 % of this scene (Figure9). We extensively tested an orthogonal approach, where instead of making a new object to generalise a group of points, we represent it by a subset of well chosen points of this group. The method and its applications (adaptive LOD, density analysis, and classification using density features) are explained in details in an article to be published.
Using trajectory with point clouds We imported the Paris tra-jectory data (successive position of the Lidar sensor every few
ms). In fact, using a constrained data model resulted in discover-ing errors in the raw trajectory data. Trajectory can be used for filtering point clouds (for instance,3.5).
We demonstrate the use of trajectory for processing in the follow-ing scenario. The goal is to localise all the pedestrian crossfollow-ings of the Paris dataset (few minutes). We (conceptually) walk along the trajectory, and every three metres we retrieve the patches closest to the trajectory. We use a crude marking-detection function on these patches (percent of points in given intensity range). Based on the score of the detection, we can favour recall or precision. The diminution factor illustrates how much less data we would need to process with the pedestrian crossing method that would follow detection (Table7).
3.6 Point Cloud Filtering
Filtering overview Overall, filtering is very fast on the point cloud server (about 100ms). Finding the points is almost always much faster than actually retrieving them.
Because of caching and the influence of how the query is written, we only provide order of magnitude here. Filtering patches using indexed function takes about10ms, even when using many con-ditions at the same time. This includes filtering with spatial (2D and 2D+Z), temporal, any attributes, density, volume, etc. This also includes using vector generalisation. Filtering with other GIS data (vector) is slower (10s), except when special care is taken to optimise the query (10ms). This includes using distance to other vector layers, using other vector layer attributes (height of build-ing), using time associated with vectors, etc. Lastly, very complex filtering may take from10sup to several minutes depending on the number of patches concerned.
3.7 Output
full
L3
L2
L1 L0
LOD
BBOX OBBOX Closing
patch height sensor trajectoryryry buildingbb
Plans
Figure 9: Bounding Box, Oriented BBox, spatial closing. Closing on 3D plan detection. Level Of Details.
PLY File As a Service (PLYFAS) ’server writes’ We create a service that writes ASCII .ply files at a given network place. The functions (API) have options to perform all kinds of filtering. We exported several files from the Paris dataset, with various filtering options and LOD. The global output time observed is around 15k
points/sper worker with a scaling of up to seven workers.
Client reads data: Streaming to browser We performed a test of point cloud streaming to a WebGL application, using a Node.js server as the ’man in the middle’. The browser is set to a geographical position, and then requests the points around this position to the Node.js server. The Node.js server connects to the point cloud database to request the points. The point cloud server uses indexes to find patches and extract points that are then streamed to Node.js server through cursor use. The Node.js server compresses the point stream and sends it to the web browser. The web browser parses the stream, puts the points into buffers, sends the points to the graphic card and display them through shaders. We observed a reduced throughput ( 20kpoints/s) because data is inefficiently transmitted as text, and is serialised/deserialised multiple times.
3.8 Processing
We demonstrate how easy it is to create new in-base processing methods. As such the methods are only cited to illustrate this. Some details may be found inCura(2014).
In-base processing Fast prototyping is vital for wider point cloud use. We demonstrate the potential of using high level lan-guages within the database to write simple processing methods. The experiment is not to create state-of-the-art processing meth-ods, but to measure what a Python/R beginner can do in two weeks (designing methods and implementing).
• * clustering points using Minimum Spanning Tree
• * clustering points with DBSCAN (Ester et al.,1996)
• * extracting primitives (plans and cylinder)
• * extracting a verticality index (using Independent Compo-nent Analysis)
• # detecting fac¸ade footprint
• # detecting cornerstones
• # detecting road markings
(*: directly working on patches, can be used out of the box on all point clouds; #: working on rasterised point clouds, need to use a point cloud to raster conversion method first)
We also used the server for complex out-of-base processing (clas-sifications).
4. DISCUSSIONS
Storage in base Currently point cloud types are strongly con-strained, thus adding or removing attributes is not immediate.
Inheritance between point types would solve this. Our point cloud server is based on only one computer. To scale over the 10 trillion-points range, we would need to use supplementary PostgreSQL sharding and clustering capabilities.
Input Examining (Martinez-Rubi et al.(2014), Table 2) shows that data loading could be much faster. Most notably, directly reading the raw sensor data and streaming it to the database using PostgreSQL binary format would be much more efficient. We emphasise that a relatively recent initiative, PDAL11has gained maturity, and would be the ideal candidate to solve these two limitations.
The PostgreSQL rule system would be the perfect candidate to use thousands of point clouds together. Metadata can be stored in our server, but a standard minimal data model would be necessary to facilitate exchanges, similar in spirit to the INSPIRE12European directive.
Conjointly using vectors, rasters and point clouds offers a new world of possibilities. We face data fusion issues, like difference in precision, generalisation, fuzziness, etc. Moreover, vector, raster and point cloud data may be acquired at different dates.
Filtering point clouds The point cloud server offers a powerful filtering structure, especially when using other GIS data. It would be possible to go much further towards complex filtering, by performing algebra between several rasters, using attributes of vectors to filter patches, etc.
Our entire strategy relies on filtering patches first, then filtering points. In cases when the patch filtering condition does not filter much, the system is much less interesting.
Output The point cloud server can output data in many ways and thus be easily integrated into any work-flow. We, however, feel that the current speed (100kpoints/s, around 2MByte/s) is too low. It could be easily accelerated using binary outputs and by decompressing patches directly on clients.
Perhaps the true evolution of the point cloud server would be to stop delivering points, and instead deliver a service that could be queried through standard mechanisms. For instance, the trans-actional Web Feature Service (WFS-t) format could be used to send points out of the box, simply using a geo-server between the client and the point cloud server. This could be a revolution in point cloud availability, similar to what happened to geo-raster data (e.g., google map WFS).
Processing In-base processing offers many opportunities be-cause it is close to the data and can be written with many program-ming languages. Yet, it is also intricately limited to one thread and the amount of memory allowed for PostgreSQL. The execution is also within one transaction. It may also be hard to control the execution-flow, during the execution. However, the Python access
11
http://www.pdal.io/
12
both from within and outside the database shows the possibility to write more ambitious processing methods with several parts executing in parallel as well as communicating, dealing properly with errors, etc.
Perspective for applications Patches and their generalisations are perfect candidates to perform fast and efficient registration (cloud-to-cloud, cloud-to-raster, etc.). Indeed, the classical solu-tion for registering a massive point cloud is to sub-sample it. Using extracted primitives would be better. Having all the meta-data, the trajectory (or camera position matrices), and the raw data, it would be possible to change the trajectory (matrices) and regenerate the point cloud with updated coordinates, all of this from within the database. Processing of point clouds would extract landmarks, which could be matched with a landmark database. It would be possible to mix PostGIS Topology (2D partition of the space) for graph queries.
5. CONCLUSION
In this paper, we presented a complete point cloud server system based on groups of points (patches). Using these patches as gen-eralisations, we fulfil all point cloud user needs (loading, storing, filtering, exporting and processing). The system is fully open source and thus easily extensible and customisable using many programming languages (C, C++, Python, R, etc.). Our system opens new possibilities because of intricate synergy with other geo-spatial data. Lastly, we proved through real-life uses that this system works with various point cloud types (Lidar, stereo-vision), not only for storing point clouds, but also for processing. As per-spective, we could explore in-base re-registration from trajectory and raw data, in-base cloud-to-cloud registration, in-base classi-fication, and point streaming, as well as scaling to thousands of billions of points.
6. ACKNOWLEDGEMENTS
The authors would like to thank reviewers for their suggestions, and colleagues for ideas and help, in particular G. Le Meur. This work was supported in part by an ANRT grant (20130042).
References
Chum, O. and Matas, J., 2002. Randomized RANSAC with td, d test. In: Proc. British Machine Vision Conference, Vol. 2, pp. 448–457.3
Cura, R., 2014. A postgres server for point clouds storage and processing.https://github.com/Remi-C/Postgres_
Day_2014_10_RemiC/tree/master/presentation.8
Edelsbrunner, H., Kirkpatrick, D. and Seidel, R., 1983. On the shape of a set of points in the plane. IEEE Trans. Inf. Theory 29(4), pp. 551–559.3
Ester, M., Kriegel, H.-p., S, J. and Xu, X., 1996. A density-based algorithm for discovering clusters in large spatial databases with noise. AAAI Press, pp. 226–231. 8
Hofle, B., 2007. Detection and utilization of the information po-tential of airborne laser scanning point cloud and intensity data by developing a management and analysis system. PhD the-sis, Institute of Photogrammetry and Remote Sensing, Vienna University of Technology.1,3
Hug, C., Krzystek, P. and Fuchs, W., 2004. Advanced lidar data processing with LasTools. In: The International Archives of Photogrammetry, Remote Sensing and Spatial Information Sci-ences, pp. 12–23.1
IQmulus, 2014. IQmulus & TerraMobilita contest.http://data.
ign.fr/benchmarks/UrbanAnalysis/.5
Kiruthika, J. and Khaddaj, S., 2014. Performance issues and query optimization in big multidimensional data. In: 2014 13th International Symposium on Distributed Computing and Applications to Business, Engineering and Science (DCABES), pp. 24–28.3
Lafarge, F., Keriven, R., Br´edif, M. and Hoang-Hiep Vu, 2013. A hybrid multiview stereo algorithm for modeling urban scenes. IEEE Trans. Pattern Anal. Mach. Intell. 35(1), pp. 5–17.2,7 Lewis, P., Mc Elhinney, C. P. and McCarthy, T., 2012. LiDAR
data management pipeline; from spatial database population to web-application visualization. In: Proceedings of the 3rd In-ternational Conference on Computing for Geospatial Research and Applications, p. 16.1,3
Martinez-Rubi, O., Kersten, M. L., Goncalves, R. and Ivanova, M., 2014. A column-store meets the point clouds. FOSS4G-Eur. Acad. Track.2,8
Martinez-Rubi, O., van Oosterom, P., Gonc¸alves, R., Tijssen, T., Ivanova, M., Kersten, M. L. and Alvanaki, F., 2015. Benchmark-ing and improvBenchmark-ing point cloud data management in MonetDB. SIGSPATIAL Spec. 6(2), pp. 11–18.2
Otepka, J., Ghuffar, S., Waldhauser, C., Hochreiter, R. and Pfeifer, N., 2013. Georeferenced point clouds: A survey of features and point cloud management. The International Archives of Pho-togrammetry, Remote Sensing and Spatial Information Sciences 2(4), pp. 1038–1065.1
Otepka, J., Mandlburger, G. and Karel, W., 2012. The OPALS data manager—efficient data management for processing large airborne laser scanning projects. The International Archives of Photogrammetry, Remote Sensing and Spatial Information Sciences 25, pp. 153–159.1
pgPointCloud, R., 2014. pgPointCloud.https://github.com/
pgpointcloud/pointcloud.2
PostGIS, d. t., 2014. PostGIS.www.postgis.org/.2,3 PostgreSQL, d. t., 2014. PostgreSQL.www.postgresql.org/.
2
Richter, R. and D¨ollner, J., 2014. Concepts and techniques for in-tegration, analysis and visualization of massive 3d point clouds. Comput. Environ. Urban Syst. 45, pp. 114–124.1
Rieg, L., Wichmann, V., Rutzinger, M., Sailer, R., Geist, T. and St¨otter, J., 2014. Data infrastructure for multitemporal airborne LiDAR point cloud analysis – examples from physical geogra-phy in high mountain environments. Computers, Environment and Urban Systems 45, pp. 137–146.1
Sahr, K., 2011. Hexagonal discrete global grid systems for geospa-tial computing. Arch. Photogramm. Cartogr. Remote Sens. 22, pp. 363–376.7
van Oosterom, P., Martinez-Rubi, O., Ivanova, M., Horhammer, M., Geringer, D., Ravada, S., Tijssen, T., Kodde, M. and Gonc¸alves, R., 2015. Massive point cloud data management: Design, implementation and execution of a point cloud bench-mark. Comput. Graph. 49(Special Section on Processing Large Geospatial Data), pp. 92–125.2
Wang, F., Aji, A. and Vo, H., 2014. High performance spatial queries for spatial big data: from medical imaging to GIS. SIGSPATIAL Spec. 6(3), pp. 11–18.2