BENCHMARKING RANGE-BASED AND IMAGE-BASED TECHNIQUES FOR
DIGITIZING A GLAZED EARTHENWARE FRIEZE
G. Tucci* , V. Bonora, A. Conti, L. Fiorini
GECO Lab., University of Florence - DICEA Dept., Via P.A. Micheli, 8, Florence [email protected]
KEY WORDS: Laser scanning, Photogrammetry,Comparison, Point Cloud, 3D models
ABSTRACT:
3D high resolution models can be produced both using range-based and image-based techniques. In this work, we evaluate the performance of the Photoscan commercial software in a challenging project: the digitization of an earthenware frieze of about 36 m in length. In order to choose the most effective technique and to define the best workflow for on-the-field data acquisition and the subsequent data elaboration, some tests were performed on a portion of the frieze. We discuss the results and compare the models resulting from different workflows with a reference data set taken from the scan data.
1. RESEARCH AIM
In this work we intend to evaluate the performances of range- and image-based systems in order to produce highly detailed 3D models for use by restorers and other heritage experts to map their diagnostic analysis and record their interventions on them (Tucci et al. 2015) and make a 3D print for a permanent exhibition. The artefact for digitization is a frieze; its dimensions suggest that it be considered an architectural survey, but closer evaluation highlights that this project requires a greater level of detail.
Before starting the (still ongoing) digitization process, we made some tests on a portion of the frieze in order to choose the most effective technique, and to plan the best further workflow for data acquisition and elaboration. We present some data evaluation results, relating both to laser scanner and photogrammetric surveys. Considering the aim of the project, our main focus was not on accuracy (even though we present some considerations in 6.1) but we preferred to analyse more qualitative aspects.
2. INTRODUCTION
“Sampling-based” forms of description have been widely used in the past for DTM production with photogrammetric techniques. Since moving from analytical to digital photogrammetry, the assisted stereo-plotting of points regularly spaced in x and y has become an automatic procedure thanks to the development of stereo-matching algorithms (Ackermann 1994). At first, algorithms applying feature-based strategies were developed, in order to provide correspondences with a high level of certainty and to limit computational resources (Foerstner 1986). The matching algorithms now implemented in software tools for image-based 3D model generation are based on stereo-matching or multi-view approaches and allow a dense point cloud to be obtained from a dataset of unordered images (Remondino et al. 2014).
At the same time, laser scanning is a consolidated technique for sourcing dense point clouds. Obviously both techniques have pros and cons and it is important to compare not only the results (in terms of accuracy or more subjective points of view) but to also consider the recording/processing time ratio, the cost of the equipment, and the possibility of using the same instrument to document objects of different sizes and with different levels of detail (Guarnieri et al. 2010).
Nowadays, it is common to refer to models with a considerably different resolution (i.e. the mean distance between closest points) as “dense point clouds”: if we are to consider a terrain model from elaboration of aerial images, for example, a dense point cloud could have a 0.5 m resolution, while for a close-range project in the architectural or archaeological field it is not unusual to be dealing with centimetric to sub-millimetric resolutions.
3. A GLAZED EARTHENWARE FRIEZE: A CHALLENGING ARTEFACT TO DIGITIZE
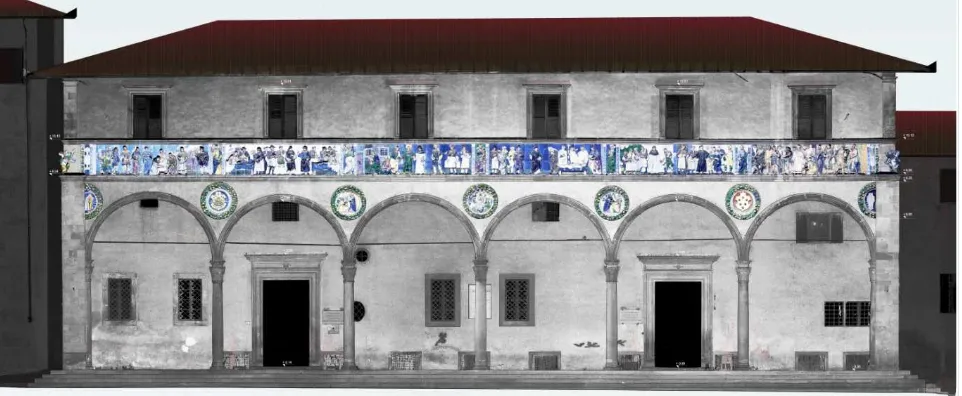
The Ospedale del Ceppo in Pistoia, founded in 1277, was embellished around 1512 by a porch reminiscent of the Loggia degli Innocenti in Florence. The three sides of this loggia were decorated with a series of glazed earthenware artworks which make this monument one of the largest and most significant examples of this technique. The components of the frieze are attributed to various artists (Marquand 1918, Tigri 1833). Around 1510-15, Benedetto Buglioni was commissioned to make a coat of arms. Most of the great frieze (43 m x 1,5 m) on the south and west façades is attributed to Santi Buglioni (Benedetto’s nephew). In an original mix of realistic details and subtle theological references, the charitable works carried out by the hospital are depicted as a genuine representation of the Seven Works of Mercy. The scenes are separated by allegories of the virtues (Prudence, Faith, Charity, Hope and Justice), and a Siren supports the hospital crest at each corner. Filippo di Lorenzo Paladini is thought be the author of the last scene, made around 1585 with a different style and technique (cold-painted unglazed earthenware). The medallions in the spandrels of the arches of the loggia depict garlands containing scenes of the life of the Virgin or coats of arms and are attributed to Giovanni della Robbia. However, a closer examination shows that some coats of arms could have been altered later.
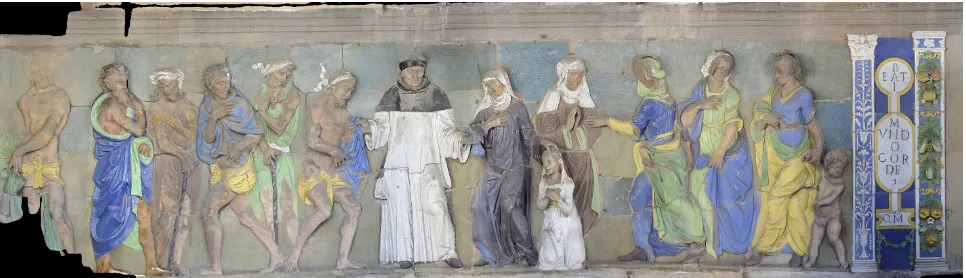
The tests presented in the paper were carried out on the “Clothing the naked and taking care of widows and orphans” scene by Santi Buglioni. The artwork, located on the W façade, is mostly in glazed earthenware, with the exception of the bare skin of the characters, which is made from unglazed terracotta with traces of cold painting. The glazed surfaces are very reflective and alternate large light and black (or dark) areas with few or very small features, such as cracks and defects. So, both range-based and image-based acquisition of this artwork results challenging.
4. RESEARCH METHODOLOGY PIPELINE
1. Project planning 2. Laser scanning survey 3. Photogrammetric survey 4. Photogrammetric data evaluation 5. 3D model comparison and assessment
6. Workflow optimization for continuing the digitization project
5. PROJECT PLANNING
The surface of the high relief appeared a challenge right from the beginning of the project since it was deemed problematic both with the laser scanner – due to the glazed surface coat – and with photogrammetric systems based on matching algorithms – due to the quite uniform texture and the lack of features (Lichti 2002; Guidi et al, 2009; Godin et al., 2001; Nicolae et al. 2014).
Therefore, the aim of the first studies on the frieze was to test different techniques – both range- and image-based – in order to evaluate their usefulness in the project to digitize the whole artwork. Logistical aspects conditioned the work on the field since the frieze is about 10 metres above than the ground level and scaffolding has been erected for restoration work.
Moreover, some architectural drawings of the façades were urgently required, therefore we prepared some orthoimages from scan data at 1:50 scale, integrated with architectural details in AutoCAD (Figure 1).
5.1 Preliminary steps
5.1.1 Laser scanning: choice of the equipment: A time-of-flight and a phase-shift laser scanner were available for the test: a C10 by Leica Geosystems and a 5010C by Zoller + Fröhlich. Some additional tests were performed later, by scanning on the scaffolding at a close distance using a Leica Geosystems HDS6000 phase-shift TLS.
5.1.2 Photogrammetry: camera/lens choice and calibration: We planned to take the photos with an SLR camera (D700 by Nikon); considering the space available in front of the frieze on the scaffolding, and in order to fully exploit the sensor resolution we planned to use a 50 mm lens. As a preliminary operation we calibrated the camera+lens, using the multi-sheet procedure provided by PhotoModeler (EOS Systems). This software uses a standard lens distortion formulation with four parameters which is a subsample of the parameter set introduced by (Brown, 1971); in order to meet the PhotoScan requirements, we transformed the unbalanced radial lens distortion to a balanced form (Wiggenhagen, 2002).
5.1.3 Software choice: The laser scanning data were processed using Cyclone (by Leica Geosystems) and JRC Reconstructor (by Gexcel). The Photoscan commercial software (by Agisoft) was used to data process the photogrammetric project. Mesh models were elaborated using MeshLab (ISTI-CNR), and model comparisons were made using CloudCompare.
6. LASER SCANNING SURVEY
6.1 Preliminary considerations on expected accuracy
Assuming that the accuracy of a laser scanner is composed of a combination of errors in distance and angle measurements, the effect is distance-related. Since the scan positions were quite orthogonal to the façade, we can consider that the measured point accuracy on the frieze mean plane is mainly related to the angular component. By disregarding accuracy in distance and assuming a scan distance of about 20 m from the object and referring to the technical data summarized in Table 2, we expected to reach an accuracy of:
- Laser scanner C10: ± 6 mm (as declared in the technical datasheet for a range of 1 to 50 m)
- Laser scanner Z+F 5010C: <± 3 mm
In order to set the higher scan resolution while at the same time avoiding oversampling we scanned:
- with C10, at a resolution of 7 mm @20 m
- with 5010C, at a resolution of 3 mm @20 m (preselected “Ultra high” resolution).
Figure 1. The main façade of the Ospedale del Ceppo, with the earthenware frieze
Table 2. Laser scanners technical data
6.2 Work on the field
In a first survey campaign, all the loggia façades were acquired in four scans made with a ToF Leica Geosystems C10 laser scanner: Figure 1 shows some graphical output. In the later campaign, a Z+F 5010C phase-shift scanner was used and eight scans were acquired, each one aiming to record three arches of the façade, to acquire a higher-resolution digital model of the frieze. In both cases, an average distance of about 20 m was chosen, in order to balance accuracy+level of detail requirements and favour a quite complete documentation. In fact, in some parts of the frieze the depicted figures are highly three-dimensional and they cause some gaps in data in the scans, which were necessarily acquired from the ground. The resulting overlapping between adjacent scans ensures a quite complete documentation.
6.3 Data elaboration
All the scan data were aligned in a local reference system: an initial solution results from manually selecting pairs of natural points, then optimization based on ICP algorithm was performed using Cyclone software. The further elaborations performed using Cyclone are: a) manual segmentation of the frieze data with respect to the complete model (some of the scans were acquired with a 360° field of view, others with a pre-selected window); b) manual data cleaning in order to remove the scaffolding and the wooden boards that partially hid the frieze.
For a visual comparison, meshes were created from the point clouds acquired from each scanner. As all models proved to be unsatisfying for the aim of the project (to make a copy of a part of the frieze with CNC or additive manufacturing techniques), we preferred to plan a photogrammetric survey. In any case we decided to use the point model obtained with the 5010C scanner as a reference system: a set of ground control points (GCPs) and check points (CPs) were extracted from single aligned scans (visualizing the intensity value in a scale of greys) and used for image orientation and subsequent checks (see also Stavropoulou et al. 2014).
7. PHOTOGRAMMETRIC SURVEY
7.1 Preliminary considerations
General issues arising in our photogrammetric project relate to poor textures, repetitive patterns, shadows, multi-layered and transparent objects, radiometric artefacts such as specular reflections, partial occlusions and brusque discontinuities. The main part of the frieze is south-facing, therefore in generally unfavourable lighting conditions; as the test described here concerns the west façade, photos were shot under natural light, avoiding direct sunlight. For the time being, we have not dealt
with the matters of colour fidelity or image enhancement (Ballabeni et al. 2015, Apollonio et al. 2014).
7.2 Work on the field
The average distance between the subject and the camera was about 1,80 m. The focus of the lens was fixed; the ISO setting was changed in the 400-1000 range depending on the quite variable light conditions, the aperture was fixed at f11. The camera network shown in Figure 3 consists of a series of normal and convergent images.
Figure 3. Test area camera network
7.3 Data elaboration
The orientation process computes the extrinsic parameters of the camera. In fact the intrinsic parameters were fixed thanks to the previous calibration. The features were first detected and then matched across the image dataset. For close-range projects no pair-preselection strategy is available (such as for small-scale projects, where GPS data can be available), which means that a long computation time is required.
The photos were oriented with the constraints provided by 11 GCPs deriving from the higher resolution scan model in order to scale and reference the photogrammetric model in the same reference system; nine more points were used to check the results.
The tie points generated by a matching process were visualized as a “sparse cloud” (of about 13.000 points). Starting from the sparse point cloud, Photoscan’s matching tools generated a dense point cloud of about 7 million points.
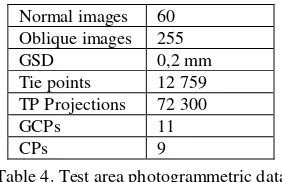
Normal images 60 Oblique images 255
GSD 0,2 mm
Tie points 12 759 TP Projections 72 300
GCPs 11
CPs 9
Table 4. Test area photogrammetric data
8. PHOTOGRAMMETRIC OUTCOME ASSESSMENT
8.1 Image quality
The Photoscan software supplies a parameter for an automatic assessment of image quality. Considering that hundreds of photos have to be managed in a project, it would be very helpful to have a way to easily and quickly find blurred images. Unfortunately, the “Image Quality” parameter only provides information on the sharpest border detected on the image; furthermore, it relates to the entire photo, while it may be that only a part of it is out of focus - e.g. due to high f-stop setting. It is therefore only useful for finding images which are obviously blurred.
8.2 Meshing algorithms
In order to define the best workflow it is sometimes useful to convert data and process them using different software, since they may each be more efficient in performing different tasks. In order to test Photoscan’s capacities, we chose to mesh the same set of data using Meshlab too. While no information is available in the Photoscan commercial software about the implemented algorithms and their settings, the Meshlab open source software provides good references for them. Meshlab also has different algorithms for generating meshes from 3D points, among which the Poisson reconstruction algorithm. It has been progressively optimized and also a recent improved version has been developed (Kazhadan 2013). In different software implementing that algorithm some parameters can be set up: in Meshlab it is possible to define Octree Depth, Solver Divide and Sample per Node.
The log provided by Photoscan shows that the meshing process is based on an octree approach (“depth parameter” is set at 13 by default) and performing a consistent decimation. In fact, a mesh model of about 7 million triangles (referred as PS in Table 6)was obtained starting from a dense cloud of about 32 million points.
The dense cloud was then meshed in different ways:
1) a 64-million-face model was achieved through a Poisson reconstruction algorithm implemented in Meslab (Kazhdan et al, 2006), later reduced (using the Quadric Edge Collapse Decimation filter) to the same size as the Photoscan model (the final model is referred to ML01 in Table 6);
2) by carring out a Poisson Disk Sampling (Corsini et al., 2012) in advance until a point cloud was obtained that is half the size of the Photoscan model; in this way the mesh obtained is about the same size (referred as ML02 in Table 6).
Mesh Models
Artefacts Noisy areas localization
Smooth # points
PS - = - 6 570 k
ML01 + = - 8 005 k
ML02 - = + 5 783 k
Table 6. Assessment of surface models meshed using Photoscan (PS) and Meshlab (ML01 and ML02)
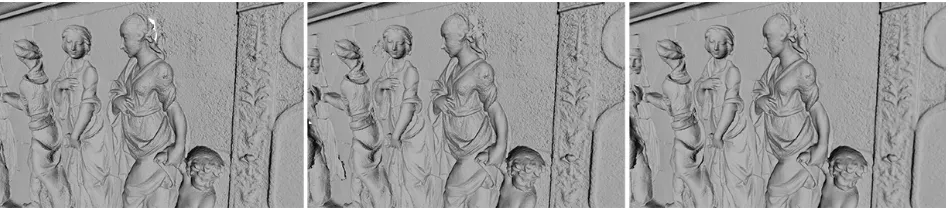
Some subjective evaluations are summarized in Table 6: - the PS and ML02 models look alike, therefore it is possible
to suppose that Photoscan uses a similar meshing algorithm to the one implemented by Meshlab, even though the resulting model is perhaps optimized by some filters that aim to remove the large triangles (which are still present in the Meshlab models, see over the figure’s heads).
- the noise in the point data set seems to affect both tools in the same way: by looking closely at the figures’ dresses and
the background panels it is possible to recognize a corresponding spiky effect in all the models.
- the three models are quite similarly smoothed - ML2 is slightly more smoothed.
9. 3D MODEL COMPARISON AND ASSESSMENT
9.1 Photogrammetry vs laser scanning
3D scanning and photogrammetry can produce qualitatively comparable results, but combining or comparing the data quantitatively is not easy. The data resulting from the most “mature” technology is usually taken as a reference: in the past, while aiming to test laser scanner instruments, several researchers evaluated range data using photogrammetric results (Velios and Harrison 2002, Guidi et al. 2004, Tucci et al. 2004, Remondino et al. 2005). More recently range data has been assumed as the reference (estimating its accuracy more on the basis of empirical experiences than on metric tests): Dellepiane et al. 2012; Bolognesi et al. 2015, Lerma and Muir 2014, Koutzoudis et al. 2013.
The aim of our work is to assess the suitability of the photogrammetric outcome. There is not the ground truth required to make accuracy tests: if we want to evaluate a photogrammetric system performance, sufficiently good reference data is required (three to ten times more accurate). But considering the high level of detail required by the project and the dimensions of the object it is very difficult to obtain an accurate and reliable model while avoiding accuracy loss due to the alignment process (Beraldin 2004, Gruen 2012).
We carried out two scans of the frieze, with different instruments; the comparison between the single scans shows that the datasets are congruent (see Figure 7).
Figure 7. Comparison (based on signed distances) between scan models obtained with the C10 and 5010C
Therefore we assumed the higher resolution scan as reference data. All the comparisons made between models were computed using CloudCompare and the results are shown in colour-coded distance maps. As a “correspondence metric” we used the distances between two point clouds computed directly by the Figure 5. Comparison between meshing systems: (from left to right) model made using Photoscan, Meshlab (decimated after
meshing), and Meshlab (decimated before meshing)
M3C2 CloudCompare plugin (Lague et al. 2013). This algorithm gives an accurate measurement of the orthogonal distance between two point clouds, avoiding meshing and reducing the influence of surface roughness.
The bundle adjustment theory has been around for a long time: while disregarding the different solutions implemented in a number of software programs, the principle of bundle block adjustment is based on the collinearity principle and it is used for calculating the orientation parameters and generating a sparse 3D point cloud of a scene.
Photoscan software works as a “black box” since few references are provided on the implemented algorithms. Hereafter we present the workflow and provide some details step by step, according to the available documentation (Agisoft LLC 2014) and to our experience.
- Photo alignment: this step is performed using image data alone. Without geometric control information it is possible to reconstruct the 3D scene, but on an unknown scale, and with unknown translation and rotation with respect to the target coordinate system.
- After the GCP insertion, a seven parameter transformation is performed and the point model is referred to the required coordinate system.
- An optimization tool is then used to adjust estimated point coordinates and camera parameters, thus minimizing the sum of reprojection errors (i.e. the differences between the measured and the back-projected image points).
9.2 Dense point cloud comparison
All the comparisons presented are computed on raw data, that is to say on point clouds, in order to avoid the intermediate step of meshing, which can add computational complexity and introduce data interpolation.
When the bundle block process is only based on a free network (without any additional constraints) and GCPs are only used for a later transformation, the inner accuracy of the image block might be critical from a geometrical point of view, and the GCP based transformation does not change the inner geometry. (Remondino et al. 2012)
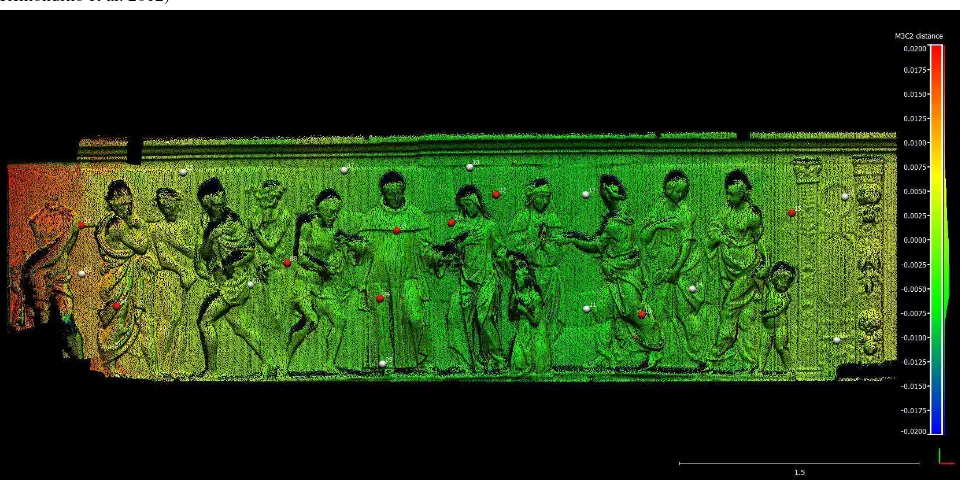
Figure 8. Comparison between the (reference) scan data and the photogrammetric dense cloud – GCPs are only used for
referencing the model – Step 1
9.2.1 Step 1: The image network of our test project integrated an open sequence of quite normal images (that might be considered weak geometry) with numerous other convergent images (Figure 3). It is well known that convergent images strengthen the network geometry (Nocerino et al. 2014); in our case they are also indispensable for documenting the foreshortened parts. Even if we combined 60 normal images and 255 convergent ones, the shape and dimension of the object affects the results. By comparing the model obtained with the scan data, a non-linear deformation is evident (see Figure 8). The shape of the test area is for the most part long and quite flat: 5,5 m x 1,5 m (high) x 0,3 m (max. depth) and the photogrammetric results are bent with respect to scan data (the maximum distances are about ± 2 cm).
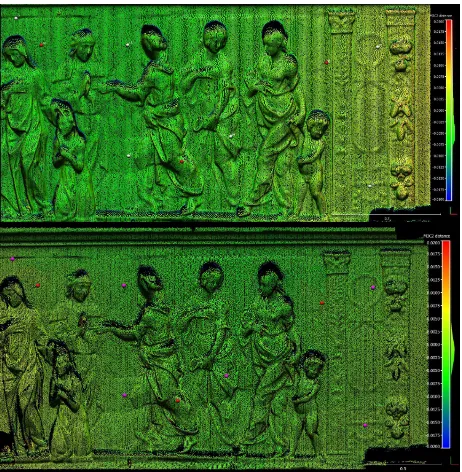
9.2.2 Step 2: The Photoscan “Optimize” tool minimizes the differences between the measured GCPs and the back-projected image points after the alignment phase. We kept camera parameters fixed based on the previous calibration. We expected to obtain an undistorted model, but the non-linear deformation went back only partially (see Figure 9): it is almost completely recovered in the middle part but still evident at the either end.
Figure 9. Comparison between the (reference) scan data and the photogrammetric dense cloud – GCPs are used in an optimization process (GCPs in white, CPs in red) - Step 2
Figure 10. The same part of the frieze as resulting from the alignment process of a complete dataset (object size approx. 6 m) and from the alignment of a sub-set of images, relating to a
smaller portion of the object (approx. 2 m) – Step 3
9.2.3 Step 3: Since the results are affected by the shape of the object and the (related) camera network, we subdivided the project into smaller parts. An object with more homogeneous dimensions and a corresponding more suitable camera network help to avoid deformations: Figure 10 both shows respectively the same part of the frieze as resulting from the alignment process of a complete dataset (object size approx. 6 m) and from the alignment of a sub-set of images, related to a smaller portion of the object (approx. 2 m). In this model there is a minimal amount of bending (about ± 2 mm) in the more external parts only.
9.2.4 Step 4: In a general workflow, Photoscan expects to optimize approximate inner camera parameters (from EXIF data) with a self-calibration process or to use fixed values from a previous calibration.
Figure 11. The outcome of the auto-calibration project demonstrates a very good conformity with the scan data
assumed as the reference – Step 4
As we stated in 5.1.2, we made a calibration project on a 3D test field and shot oblique and rotated images in order to decouple the parameters. The principal distance, the coordinates of principal point, and radial distortion parameters were computed using PhotoModeler software. As final step we recomputed the bundle adjustment with self-calibration. The distances between the outcome model and our reference data are small and evenly distributed (see Figure 11), but over-parametrization seems to occur.
Control Points Check points RMSE
[mm]
RMSE [pix]
RMSE [mm]
RMSE [pix]
STEP1 9.07 1.60 9.87 1.34
STEP2 7.73 0.09 9.64 0.13
STEP3 6.00 0.15 4.98 0.15
STEP4 5.37 0.08 7.07 0.12
Table 12. Metrics provided by Photoscan
More tests on this topic are underway because Photoscan does not provide any useful metrics for evaluating the estimation of the camera model, such as the accuracy of the estimated parameters, and the correlations among the elements of the inner and external orientation.
For the ongoing alignment phase we broke down the frieze into sub-projects and tested bundle adjustment with self-calibration for each of them: Table 13 shows that the inner parameters are not stable and some coupling values are evident, even though all the images were obviously taken with the same camera/lens.
Table 13. Camera inner parameters computed by self-calibration in different sub-projects. Even if all photos have been taken with the same camera/lens settings, parameters significantly change respect to pre-calibrated values and in different sub-projects.
10. FINAL REMARKS
Nowadays 3D high-resolution models can be produced both using range-based and image-based techniques (El Hakim et al. 2003). The paper presents the preliminary studies carried out for the digitization of the earthenware frieze of the Ospedale del Ceppo in Pistoia (Italy), which is a challenging case study due to the materials and surface characteristics (Figure 14). Some tests with different laser scanners and a photogrammetric project are described. Since we repeated the scans twice independently and with different instruments, achieving equivalent models (regardless of the level of detail), a scan data set was taken as a reference. Several parameters can affect the results and it is tricky to plan the optimal workflow. The results obtained by the Photoscan commercial software are discussed. Despite a camera network defined by a mix of normal and convergent images, the object’s shape (longer than it is wide) affects the result, producing a slightly bent model. As is well known, GCPs are used to reference the model during bundle adjustment, but in this case they are not able to completely balance out that deformation. Since it will not be possible to straighten the camera network due to scaffolding restricting the shooting positions, the results found suggest subdividing the frieze into smaller parts; moreover the number of GCPs should be reduced. The first results obtained by introducing self-calibration optimization show an undistorted model, according to the reference scan data. A closer examination of the camera self-calibration process available in Photoscan is needed, since it seems to get better results but it might present some problems of over-parametrization.
ACKNOWLEDGEMENTS
This work was funded by the “Il fregio robbiano dell’Ospedale del Ceppo: documentazione metrica per il progetto di conservazione” agreement between the Azienda U.S.L di Pistoia and the University of Florence – Department of Civil and Environmental Engineering – DICEA. The authors are really thankful to arch. Valerio Tesi (Soprintendenza per i Beni Architettonici, Paesaggistici, Storici, Artistici ed Etnoantropologici per le province di Firenze, Prato e Pistoia) and ing. Fabrizio D’Arrigo (Azienda USL3 Pistoia),
REFERENCES
Ackermann, F., 1994. Digital elevation models – techniques and application, quality standards, development. International Archives of Photogrammetry and Remote Sensing, 30, 421-432
Agisoft LLC, 2014. Agisoft PhotoScan User Manual. Professional Edition, Version 1.1. http://www.agisoft.com/pdf/ photoscan-pro_1_1_en.pdf (02 April 2015)
Apollonio, F.I., Ballabeni, M., Gaiani, M., 2014. Color enhanced pipelines for reality-based 3D modeling of on site medium sized archeological artifacts. Virtual archaeology review, 5(10), 59-76.
Ballabeni, A., Apollonio, F.I., Gaiani, M., Remondino, F., 2015. Advances in image pre-processing to improve automated 3 D reconstruction, ISPRS-International Archives of the Photogrammetry, Remote Sensing and Spatial Information Sciences, 1, 315-323
Beraldin, J.A., 2004. Integration of laser scanning and close range photogrammetry – the last decade and beyond. Proceedings of XXth ISPRS Congress, pp.972-983
Bolognesi, M., Furini, A., Russo, V., Pellegrinelli, A., Russo, P. 2015. Testing the low-cost rpas potential in 3D cultural heritage reconstruction, ISPRS-International Archives of the Photogrammetry, Remote Sensing and Spatial Information Sciences, 1, 229-235.
Brown, D. C., 1971. Close-Range Camera Calibration, Photogrammetric Engineering, 37(8), 855-866.
Corsini M., Cignoni P., Scopigno R., 2012. Efficient and flexible sampling with Blue Noise Properties of triangular meshes, IEEE Transactions on Visualization and Computer Graphics 18(6), 914-924
Dellepiane, M., Dell’Unto N., Callieri M., Lindgrenc, S., Scopigno R., 2012. Archaeological excavation monitoring using dense stereo matching techniques, Journal of Cultural Heritage, 14(3), 201-210
El Hakim, S.F., Beraldin. J.A., Picard, M., Vettore, A., 2003. Effective 3d modelling of heritage sites, 3D Digital Imaging and Modeling, 3DIM Proceedings.
Foerstner, W., 1986. A feature based correspondence algorithm for image matching, International Archives of Photogrammetry and Remote Sensing, 26(3), 150-166
Godin, G., Beraldin, J.-A., Rioux, M., Levoy, M. Cournoyer, L., 2001. An assessment of laser range measurement of marble surfaces. In: Proceedings of the 5th Conference on Optical 3-D Measurement Techniques. Vienna, Austria 49-56.
Figure 14. Ortho-image of the “Clothing the naked and taking care of widows and orphans” test area
Gruen, A. 2012. Development and Status of Image Matching in Photogrammetry. Photogrammetric Record, 27(137), 36-57.
Guarnieri, A., Pirotti, F., Vettore, A., 2010. Cultural heritage interactive 3D models on the web: an approach using open source and free software. Journal of Cultural Heritage, 11, 350–353.
Guidi, G., Beraldin, J.A., Atzeni, C., 2004. High accuracy 3D modelling of cultural heritage: the digitizing of Donatello’s “Maddalena”, IEEE Transaction on image processing, 13(3), 370-380
Guidi, G., Remondino, F., Russo, M. Spinetti, A., 2009, Range sensors on marble surfaces: Quantitative evaluation of artifacts. Proceedings of the Society of Photo-Optical Instrumentation Engineers 7447,03-12.
Kazhdan M., Bolitho M., Hoppe H., 2006, Poisson surface reconstruction. In: Proceedings of the fourth Eurographics symposium on Geometry processing, 61-70.
Kazhdan, M., Hoppe, H. 2013. Screened poisson surface reconstruction. ACM Transactions on Graphics (TOG), 32(3), 29.
Koutsoudis A., Vidmar, V., Arnaoutoglou, F., 2013. Performance evaluation of a multi-image 3D reconstruction software on a low-feature artefact, Journal of Archaeological Science, 40(12), 4450-4456
Lague D., Brodu N., Leroux J., 2013. Accurate 3D comparison of complex topography with terrestrial laser scanner : application to the Rangitikei canyon (N-Z), ISPRS Journal of photogrammetry and remote sensing, 82, 10-26
Lerma, J.L., Muir, C., 2014. Evaluating the 3D documentation of an early Christian upright stone with carvings from Scotland with multiples images, Journal of Archaeological Science, 06/2014; 46.
Lichti, D. D., Harvey, B. R., 2002. The effects of reflecting surface properties on time-of-flight laser scanner measurements. In Proceedings of 95th CIG Annual Geomatics Conference.
Marquand, A., 1918. Unpublished Documents Relating to the Ceppo Hospital at Pistoia. American Journal of Archaeology, 22(4), 361-377.
Nicolae, C. Nocerino, E., Menna, F., Remondino, F., 2014. Photogrammetry applied to problematic artefacts, ISPRS-International Archives of the Photogrammetry, Remote Sensing and Spatial Information Sciences,1, 451-456.
Nocerino, E.; Menna, F.; Remondino, F., 2014. Accuracy of typical photogrammetric networks in cultural heritage 3D modeling projects, ISPRS-International Archives of the Photogrammetry, Remote Sensing and Spatial Information Sciences, 1, 465-472.
Remondino, F., Guarnieri, .A., Vettore, A., 2005. 3D modeling of close-range objects: photogrammetry or laser scanning?, Proc. SPIE 5665, Videometrics VIII, 216
Remondino, F., Pizzo, S. D., Kersten, T. P., Troisi, S. 2012. Low-Cost and Open-Source Solutions for Automated Image
Orientation – A Critical Overview. In: Ioannides M. et al (eds.) Progress in cultural heritage preservation - 4th International Conference, EuroMed 2012 . Springer Berlin Heidelberg, 40-54
Remondino, F., Spera, M. G., Nocerino, E., Menna, F., Nex, F., 2014. State of the art in high density image matching. The Photogrammetric Record, 29(146), 144-166.
Stavropoulou, G., Tzovla, G., Georgopoulos, A., 2014. Can 3D Point Clouds Replace GCPs?. ISPRS Annals of Photogrammetry, Remote Sensing and Spatial Information Sciences, 1, 347-354.
Tigri, G., 1833. De' plastici dell'Ospedale di Pistoia. Giachetti, Prato
Tucci, G., Bonora, V., Sacerdote , F., Costantino, F., Ostuni, D., 2004. From the acquisition to the representation: quality evaluation of a close range model, ISPRS-International Archives of the Photogrammetry, Remote Sensing and Spatial Information Sciences, 35(B5), 1682-1750, 591-596.
Tucci, G., Conti, A., Fiorini, L., 2015. The Mock-up of the" Ratto Delle Sabine" by Giambologna: Making and Utilization of a 3D Model. ICONARP International journal of architecture and planning, 2(2), 73-83.
Velios, A., Harrison, J. P., 2002. Laser scanning and digital close range photogrammetry for capturing 3-d archaeological objects: a comparison of quality and practicality, In: Burenhult G., (Ed.) Archaological Informatics: Pushing the Envelope, CAA 2001 BAR International Series 1016 Archeopress Oxford, 205-211.
Wiggenhagen, M., 2002. Calibration of digital consumer cameras for photogrammetric applications. International Archives of Photogrammetry Remote Sensing and Spatial Information Sciences, 34(3/B), 301-304.
Agisoft, Photoscan 1.1.4, http://www.agisoft.com/
Cloud Compare 2.6.1, http://www.danielgm.net/cc/
EOS Systems, Photomodeler 3.0 http://www.photomodeler.com/
Gexcel, JRC 3d Reconstructor 3.0 http://www.gexcel.it/
ISTI-CNR, MeshLab 1.3.3 developed with the support of the 3D-CoForm project, http://meshlab.sourceforge.net/
Leica Geosystems, Cyclone 9.0.2 http://hds.leica-geosystems.com/en/Leica-Cyclone_6515.htm