OUT OF THE ARCHAEOLOGIST'S DESK DRAWER:
COMMUNICATING ARCHAEOLOGICAL DATA ONLINE
Dante ABATE¹ - Massimiliano DAVID²
¹3D GraphLab ENEA UTICT, Bologna, Italy - [email protected], http://www.afs.enea.it/project/graphlab/index.shtml
² University of Bologna, Department of History and Cultures, Bologna, Italy - [email protected]
Commission VI, WG VI/4
KEY WORDS: Laser Scanning, Photogrammetry, High Resolution Images, 3D, Archaeology, Web, Communication
ABSTRACT:
During archaeological field work a huge amount of data is collected, processed and elaborated for further studies and scientific publications. However, access and communication of linked data; associated tools for interrogation, analysis and sharing are often limited at the first stage of the archaeological research, mainly due to issues related to IPR. Information is often released months if not years after the fieldwork. Nowadays great deal of archaeological data is ‘born digital’ in the field or lab. This means databases, pictures and 3D models of finds and excavation contexts could be available for public communication and sharing. Researchers usually restrict access to their data to a small group of people. It follows that data sharing is not so widespread among archaeologists, and dissemination of research is still mostly based on traditional pre-digital means like scientific papers, journal articles and books. This project has implemented a web approach for sharing and communication purposes, exploiting mainly open source technologies which allow a high level of interactivity. The case study presented is the newly Mithraeum excavated in Ostia Antica archaeological site in the framework of the Ostia Marina Project.
1. INTRODUCTION
Dissemination and communication of archaeological data online through the web is today possible thanks to many platforms for
data sharing and 3D visualization.
However, this practice is prevented mainly by the issues related to Intellectual Property Rights (IPR), which discourage archaeologists to publish and share data collected on site and elaborated after time consuming process. Three dimensional models are often presented as mute objects with some traditional metadata attached as name, location, dating and a brief description.
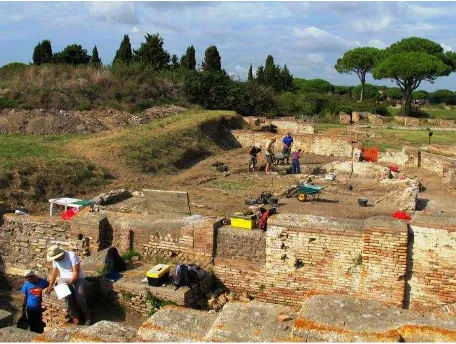
This project proposes a mashup methodology to visualize and interact online with 3D photorealistic models, high definition images, CAD geometry and traditional metadata file (audio, video, text for public disclosure) exploiting open source customizable applications. The case study is represented by a recent discovery done at the archaeological site of Ostia Antica, Italy (Fig. 1).
Fig. 1. Excavation Campaign 2014, Ostia Antica, Italy
During the excavation campaign 2014, led by the University of Bologna, a room, lately identified as a Mithraeum, was brought to light. Due to its rich decoration, it was decided by the scientific committee to perform a full documentation exploiting image and range based techniques.
2. RELATED WORKS
Thanks to the latest technological developments in hardware and software level, nowadays it is quite promising the possibility to visualize remotely 3D digital models linked to external databases for analyses and educational purposes in archaeology. So far the presence of 3D models on the web is not very frequent, despite the availability of some standards and the increasing developments of libraries (C3DL, OpenSceneGraph, X3DOM, etc.), API (WebGL, O3D etc.), plug-in applications (OSG4Web, Java3D, etc.), game engines (Unity3D, 3DVia, etc.) and languages and technologies (VRML, X3D, PDF3D, etc.) (Manfredini et al., 2012). Probably the most well-know and performing web-based rendering approach for 3D models (terrain and man-made structures) and HD images is provided by GoogleEarth.
The main problem is probably the bandwidth of the network, although even the protection of online shared and rendered 3D models, High Resolution Orthophoto, CAD geometries is still an open issue. Indeed, sharing online digital archives of Cultural Heritage presents new challenges for the protection of intellectual property rights (IPR). Different approaches (Koller et al., 2004; Uccheddu et al., 2004; Zhu et al., 2008; Zagrouba et al., 2009) were proposed to protect piracy, copies and misuse – still allowing an interactive sharing – but the topic is still under investigation.
In the past years the scientific community focused on the visualization, in real-time and possibly via web of 3D models and associated metadata in the heritage sector.
Thus, many remote rendering platforms and plug-in have been developed with different rendering approaches.
Unity Web Player, which allows interactive 3D content to be displayed in an internet browser with the installation of a special plug-in. Unity is developed in C/C++ languages and relies on Direct3D, OpenGL, OpenGL ES and proprietary API, depending on the programming platform. This software has already been used in the archaeological domain, for instance (Agugiaro et al., 2011).
Sketchfab is a complete service aimed at facilitating the quick and easy sharing of models on the web. It is free for non-commercial use, but an upgrade to its ‘Pro’ version with a monthly subscription fee is required for those hoping to publish larger, more complicated content (Barrettara 2014).
The SAVE (Serving and Archiving Virtual Environments) project (Frischer, 2006) aims to create an on-line, peer-reviewed journal where authors can publish 3D digital models of Cultural Heritage sites and monuments. Its goal is to offer scholars in the field of virtual archaeology and architectural history the opportunity to publish on the internet 3D digital reconstruction of artefacts, monuments and settlements as fully interactive 3D models. These data are associated to some documentation giving transparency to the end-user about the hypothesis of reconstruction of the major elements of the digital model. The Venus 3D model publishing system is an interactive publishing technology for large 3D models (millions of polygons) on the web exploiting an image based approach (Crable 2012). A decimated version of the high-resolution model is downloaded to the client device for user manipulation. When the model is not being manipulated a high-resolution rendering of the 3D model is retrieved from the server and displayed. Currently it’s available for web standard browsers which support WebGL and for Mac mobile devices (Apple iPhone/iTouch and iPad).
The 3D-COFORM project aims to advance the state-of-the-art in 3D-digitization and to make 3D-documentation of cultural and other material objects an everyday practice (Pitzalis et al., 2011). The project begun in 2008 has realized a Repository Infrastructure (RI) designed and implemented as a sustainable, distributed repository for a massive quantity of large digital objects and their metadata.
HPC infrastructures have been used for multi-user access to a repository of 3D models and metadata exploiting different applications according with different goals, freeing the end user for specific hardware and software resources during the interaction and visualization of remote data. a 3D model whose resolution remains constant during the navigation protecting the intellectual property rights (Abate et al., 2011, 2012; Jiḿnez Fernandez-Palacios et al. 2013).
The ARIADNE project (Advanced Research Infrastructure for Archaeological Dataset Networking in Europe) is structured in repositories or databases, institutional repositories (research centres, museums and other), data centres, subject and domain repositories (Aspöck et al., 2014). The visualization system is based on an open source tool which will be discussed later on in this paper.
3. THE MITHRAEUM AND THE THREE DIMENSIONAL SURVEY CAMPAIGN
The excavation campaign at Ostia Antica archaeological site promoted by the Department of History and Cultures of the University of Bologna, in the framework of the Ostia Marina Project, has brought to light new Roman and late Roman buildings. The first investigations started in 2007. Since then, buildings completely unknown have been identified (David et al., 2012; 2013; .2014; Poccardi 2006).
Among them we can draw the attention to the “Mithraeum of multicoloured marbles” (David et al., 2015).
This new find insists on the regio IV, insula IX of the site, nearby the via Marciana, a suburban area known as Porta Marina. The room, named by the scientific committee as, for the elements which enrich the floor, presents an irregular trapezoidal shape with an apse ending in a small niche (Fig. 2). It has been dated to a period around the second half of the forth century A.D. All the walls present a fresco decoration which simulates ancient marble. The centre of the room is characterized by a pit, probably used for water procurement for the performance of rites belonging to the cult of Mithra. A white marble cylinder, removed and secured during the excavation process was originally placed above it. The room is 8.80 m long and 2.90 m wide in the middle axes. Its depth, under the current ground level, is 1.45 m.
Fig. 2. Mithraeum of Multicoloured Marbles, Ostia Antica, Italy
The Mithraeum was digitized by the 3D GraphLab team of the ENEA Research Centre of Bologna, exploiting a double approach. A Terrestrial Laser Scanning (TLS) survey was performed in order to acquire all the geometrical information concerning the room and create a morphological database of the structure. At the same time a photogrammetric survey was carried out. The camera network was designed in order to optimize the subsequent phases of 3D modelling, photo-texturing and high resolution orthophoto production of the four walls and of the floor.
3.1 Laser Scanner Survey and Data Post Processing
A high definition Laser Scanner survey creates a 3D model (point cloud) where the object’s shapes and dimensions are described by millions of points (El Hakim et al., 2008; Remondino 2011). This well-known technology is able to acquire a large amount of three dimensional data and therefore able to describe the object and its main metrical features, freezing its morphological memory at the time of the survey.
The TLS survey took place during September 2014 (Fig. 3). The Laser Scanner was mounted over a tripod and powered by an electric generator since the electricity wasn’t available in the archaeological area.
Fig. 3. TLS Scan Station, Ostia Antica, Italy
To digitize the entire structure 12 point clouds were acquired. Ten stations were realized with the scanner placed on the actual ground level whilst two of them were performed inside the room on the original ground floor. The final database consists of ca. 8 million points.
After the data cleaning and merging process the point cloud was reduced to 5.5 million points. A resolution of 1cm x 1cm was set for each scan station, which allows representation of the main features of the complex in CAD drawings with an estimated scale of 1:50.
The only gaps in the 3D final point cloud were represented by the pit for the water supply and a square hole in one of the corners which have too narrow angles to be acquired by the laser beam (Fig. 4).
Fig. 4. Mithraeum of Multicoloured Marbles, Final Point Cloud
The point cloud data have been elaborated in order to extract sections, with the main aim to produce:
- traditional 2D CAD drawings (plan; vertical and longitudinal sections);
- polygonal mesh to create interactive photorealistic 3D models for communication purposes;
- images from different point of views.
The software Cyclone has been used to create appropriate reference planes and cut planes to describe the geometric features of the Mithraeum. Exploiting the plug-in Cloudworx for AutoCAD, the points were processed into polyline and saved in dwg and dxf file formats.
The point cloud was also used to create a high resolution mesh model for virtual interaction and visualization.
The 3D model was imported into the open source software Meshlab. In order to obtain a polygonal surface the normal for each 3D point was computed exploiting the appropriate filter. The dataset was then saved in a BNPTS file format for surface reconstruction exploiting the Multilevel Streaming for Out-of-Core Surface Reconstruction to overcome the issues related to the database dimension and to avoid the risk of running out of memory during computation due to the octree value (Bolitho et al., 2007).
3.2 Photogrammetric Survey and Data Post Processing
Today digital photogrammetry can be a feasible and flexible solution and a quasi-standard procedure may be found to suggest general best practices for systematic 3D surveys (Remondino et al., 2014).
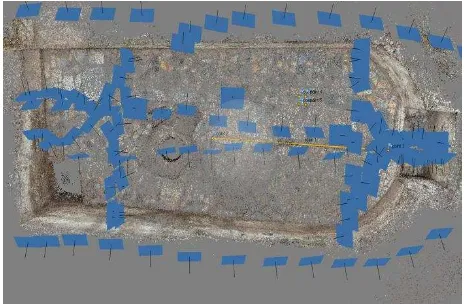
For the presented case study, the main purpose of the photogrammetric survey was to acquire geometric and semantic data for the 3D modelling, photo-texturing and high resolution orthophoto production (Fig.5).
Fig. 5. Photogrammetric Camera Network
The camera used for the survey was a Canon Eos 600D featuring
a 18.0 effective megapixel CMOS sensor(4.3 m pixel size).
Given the requirements of the final orthophotos and the environmental condition of the Mitreum a photographic scale of 1:80 was selected. With such scale, the ground sample distance (GSD) of the images was about 0.34 mm. The distance camera-to-object was about 1.6 m. The camera’s autofocus was disabled and the lens focusing ring fixed with a piece of insulating tape to avoid accidental changes of interior orientation parameters during the photogrammetric survey. In order to maximize the rapidity of the photogrammetric acquisition and achieve high ISPRS Annals of the Photogrammetry, Remote Sensing and Spatial Information Sciences, Volume II-5/W3, 2015
accuracy results, an automatic photogrammetric approach including self-calibration was planned. The images were automatically processed using Agisoft Photoscan. The extracted tie points were filtered to keep only well distributed reliable points and avoid reprojection errors. A dense point cloud and a mesh model were finally created. The model was hence scaled according to measures obtained from the high resolution laser scanner point cloud.
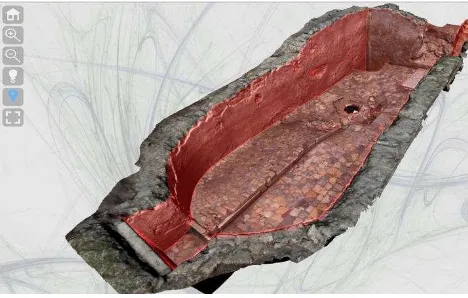
After an alignment process between the laser scanning 3D mesh model and the photogrammetric 3D mesh model, performed with the open source software cloudcompare, which features a scale adjustment coupled with the ICP algorithm, the high resolution 3D model obtained from laser scanner data was imported into Agisoft Photoscan. Textures were then applied due to the known camera orientation parameters previously computed (Fig. 6). Orthophoto of the 4 walls and of the floor of the Mithraeum were realized with a resolution of 3 mm/pixel.
Fig. 6. Mithraeum of Multicoloured Marbles, 3D Texturized Model
4. ARCHAEOLOGICAL DATA COMMUNICATION
AND SHARING STRATEGY
Archaeologists and professionals working in Cultural Heritage after time consuming surveys in the field and post processing tasks in the lab, as those shown above, usually restrict access to their data to a small group of people. It follows that data sharing and dissemination of research is still mostly based on traditional medium like scientific papers, journal articles and books after publication.
4.1 3D Model Visualization
In order to visualize interactive 3D models enriched with scientific and traditional metadata, the 3D Hop (Heritage Online Presenter) was chosen (Di Benedetto et al., 2014). This system, developed in the framework of the EC NoE project "V-MUST.NET - Virtual Museum Transnational Network" by the Visual Computing Laboratory - ISTI – CNR, is an open source tool for the visualization of very large 3D models directly inside HTML pages. It is released under the GPL license (Callieri et al., 2008).
3D Hop is a multiplatform system and a cross-browser application which can be customizable for different uses and purposes (Potenziani et al., 2015).
Although 3D Hop supports ply file (geometry and per vertex color info) as single resolution model, it is possible to convert it into a Nexus file format (nxs) which allows the streaming of multiresolution 3D meshes over HTTP without sharing original data. Converted files remain stored on owner’s server preserving IPR (Cignoni et al., 2005).
In the framework of the EU-INFRA Ariadne project, as mentioned before, a media service has been created based on the
3D Hop publication system. However the models displayed allow today only the visualization of 3D objects without the availability of some extra resource. This is also the policy of the approach proposed by Sketchfab.
Often, indeed 3D models displayed online appear as fascinating, but mute objects, which don’t communicate much information besides aesthetic values. The aim of this study was to present the 3D data as talking models, allowing to extract as much information as possible (Balsa Rodriguez 2015).
The Model of the Mithraeum was converted into nxs file format and embedded in html code available through a dedicated web page:
http://www.afs.enea.it/project/graphlab/ostia_marina/mithraeum .html.
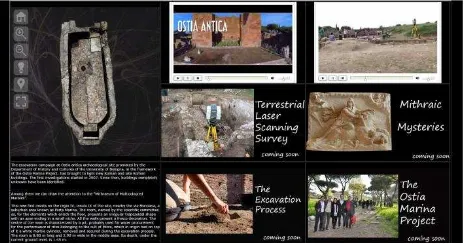
One of the most useful features of the 3D Hop system is the possibility to place hotspots directly on the 3D geometry and link them to external resources. The proposed approach relies indeed on different layers of information and metadata all available through the interaction with the 3D geometry (Fig. 7).
Fig. 7. Visualization Framework
The first layer of information is represented by traditional metadata such as text files, images and media (audio-video files) which intend to reach an audience of specialist and non specialist users. The user can visualize indeed external thematic web resources (e.g wikipedia); images of the excavation; video of the 3D survey; information about the archaeological site and its history; excavation reports and virtual restoration hypothesis material. This data will be displayed in a contextual menu allowing a user friendly interaction or clicking directly on the 3D model hotspots (Fig. 8).
Fig. 8. Traditional Metadata Web Page
The second layer of information is dedicated to the on line visualization of High Resolution orthophoto realized with photogrammetric techniques. The final images in tiff format consisted of an average dimension 400 MB per image (longer walls and the floor) and 200 MB (shorter walls).
To allow the visualization online and for IPR protection, it was decided to use the HDview free plug-in developed by Microsoft ISPRS Annals of the Photogrammetry, Remote Sensing and Spatial Information Sciences, Volume II-5/W3, 2015
Research. This plug-in basically subdivides the high resolution orthoimages into a set of tiles stored in subfolders which are visualized on the web browser according with the user input. The client machine, hence download only the data needed to create the current view, disregarding portions of the image outside the field of view.
Clicking on each of the sensitive areas (Fig. 9), the high resolution orthophoto is displayed (Fig. 10).
Fig. 9. 3D Model Hotspots, High Resolution Images
The first time the user visits a page with HD View content the system will require to install the HD View plugin. Unfortunately, nowadays HDview plugin works on Windows OS only. The third layer of information gives access to the geometrical features of the Mithraeum. During the laser scanner data post processing, many sections of the point cloud were extracted and exported along different axes in dwg and dxf file format. Activating the Mithraeum 3D model hotspots (Fig. 11a), the user
can visualize directly in three dimensions where the section of interest is located. By clicking on the selected item it is possible to download the 3D geometry. Since this level of interaction assumes a real transfer of data, according with the owner policy, this action can be secured with a password (Fig. 11b).
Since one of the main goal of the application is to communicate archaeological data, share the content and allow users to interact with it, an intuitive tool has been realized in order to allow the extraction of geometrical features upon request (Fig. 12). Sections and plans of the Mithraeum today available are indeed chosen by the archaeologists directly involved in the Ostia Marina Project. Hovewer, other specialist may need to explore the other features of the site and keen to analyze different elements not directly available in the 3D model.
Exploiting a jQuery plugin it has been possible to create a canvas upon which visitors can draw. This visual request can be sent to the model owner who can extract and deliver back the geometry. This easy to use interface exploits html5 canvas and support multiple browsers. This approach results extremely intuitive and clear in order to communicate and share data in a collaborative environment.
Due to the features of the Mithraeum only slices of point clouds are made available. However, where decorations or valuable parts of the environment are present, they could be made accessible for download in various 3D file formats.
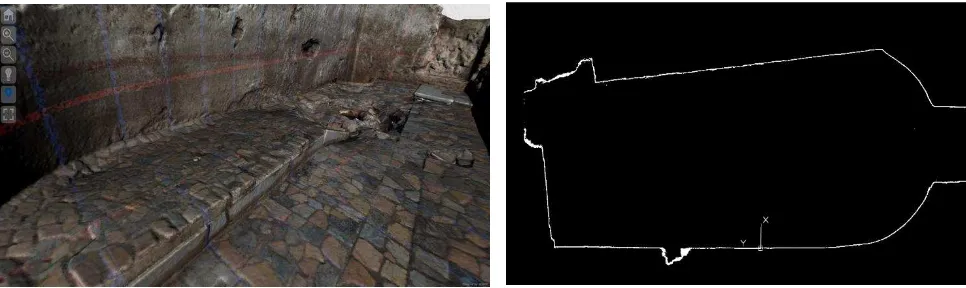
Fig. 10. 3D High Resolution Orthophoto
Figure 11. 3D Model Hotspots, Geometric Features Extraction (a), Plan, Point Cloud Section (b)
5. CONCLUSIONS
The article reported a study to provide an efficient, intuitive, and interactive strategy for communicating and sharing archaeological data online in the early stages after the excavation campaign.
Terrestrial Laser Scanning and Photogrammetric surveys were realized by the 3D GraphLab team of the ENEA Research Centre of Bologna, with the main aim to digitize the Mithraeum placed in the limit of the regio IV, insula IX of Ostia Antica archaeological site recently revealed by the archaeologists of the University of Bologna. Data were acquired and post processed until 3D models and high resolution images were created. 3D virtual models, enriched by the possibility to extract geometric data; visualize high resolution images and traditional metada, have been presented, not neglecting the Intellectual Property Rights protection.
Open source tools have been exploited in order to make the methodology repeatable or applicable to existing platform which use the same technology.
Fig. 12. Drawable Canvas
ACKNOWLEDGEMENTS
The authors would like to thank the members of the Ostia Marina Project archaeological team and Mr. Graziano Furini of the ENEA Research Centre of Bologna for the logistic support provided during the three dimensional field survey.
REFERENCES
Abate, D., Furini, G., Migliori, S., Pierattini, S., 2011. Multiple visualization web approach for Cultural Heritage objects. In: Journal Geoinformatics FCE CTU, Volume 7, Dec.
Abate, D., Migliori, S., Pierattini, S., Jiménez Fenández-Palacios, B., Rizzi, A., Remondino, F., 2012. Remote rendering and visualization of large textured 3D models. In: Proc. 18th IEEE Int. Conf. Virtual Systems and MultiMedia (VSMM) , pp. 399 – 404.
Agugiaro, G., Remondino, F., Girardi, G., von Schwerin, J., Richards-Rissetto H., De Amicis, R., 2011. Queryarch3D : Querying and visualising 3D models of a Maya archaeological site in a Web-based interface. In: Proceedings of XIII CIPA Symposium - Prague, Czech Republic - 12/16 September 2011.
Aspöck, E., Geser, G., 2014. What is an archaeological research infrastructure and why do we need it? Aims and challenges of ARIADNE. In: CHNT 18, 2013 – Proceedings.
Balsa Rodriguez, M., Agus, M., Bettio, F., Marton, F., Gobbetti, E., 2015. Digital Mont’e Prama: 3D cultural heritage presentations in museums and anywhere. In: Digital Heritage 2015 – Proceedings (to appear).
Barrettara M., 2014. New methods for sharing and exhibiting 3D archaeology. In: The Post Hole Issue 31, pp. 8-13.
Bolitho, M., Kazhdan, M., Burns, R., Hoppe, H., 2007. Multilevel Streaming for Out-of-Core Surface Reconstruction. In: Eurographics Symposium on Geometry Processing, pp. 69-78.
Callieri, M., Ponchio, F., Cignoni, P., Scopigno, R., 2008. Virtual Inspector: a flexible visualizer for dense 3D scanned models. In: IEEE Computer Graphics and Applications, IEEE Press, January/February 2008, pp. 44-55.
Cignoni, P., Ganovelli, F., Gobbetti, E., Marton, F., Ponchio, F., Scopigno R., 2005. Batched Multi Triangulation. In: Proceedings IEEE Visualization, page 207-214.
Crable C., 2012. Venus: A Unique Fast, Effective And Safe Publishing System For High-Resolution 3d Digital Models. In: Progress in Cultural Heritage PreservationLecture Notes in Computer Science Volume 7616, 2012, pp 644-653.
David, M., De Togni, S., 2012. "Pavimenta struere". Archeometria e tecnologia di un pavimento a mosaico di epoca imperiale romana dagli scavi del Progetto Ostia Marina. In: Proceedings of XVII Colloquium of Associazione Italiana per lo Studio e la Conservazione del Mosaico, pp. 241 – 248.
David, M., Pellegrino, A., De Togni, S., Turci, M., 2013. Scene di vita quotidiana sulla spiaggia di Ostia prima e dopo Adriano. Indizi archeologici dal progetto Ostia Marina. In: Roma, Tevere, litorale. 3000 anni di storia, le sfide del futuro, pp. 1 – 10. David, M., Pellegrino, A., De Togni, S., Ferrandis Montesinos, J., Turci, M., 2014. Un nuovo mosaico pavimentale adrianeo dalle Terme del Sileno di Ostia. Anticipazioni in corso di scavo. In: Proceedings of XIX Colloquium of Associazione italiana per lo studio e la conservazione del mosaico, pp. 337 – 343. David, M., Abate, D., Pellegrino, A., Lombardo, D., Melega, A., De Togni, S., Graziano, S., 2015. Il pavimento del nuovo mitreo dei marmi colorati a Ostia Antica. Proceedings of the XXI Colloquium of Associazione Italiana per lo Studio e la Conservazione del Mosaico (AISCOM), 19-21 March 2015, Reggio Emilia, Italy (in printing).
Di Benedetto, M., Ponchio, F., Malomo, L., Callieri, M., Dellepiane, M., Cignoni, P., Scopigno, R., 2014. Web and Mobile Visualization for Cultural Heritage. In: 3D Research Challenges in Cultural Heritage, Lecture Notes in Computer Science, Vol. 8355.
El-Hakim, S., Beraldin, J.-A., Remondino, F., Picard, M., Cournoyer, L., Baltsavias, M., 2008. Using terrestrial laser scanning and digital images for the 3D modelling of the Erechteion, Acropolis of Athens. In: Proc. of “Digital Media and its Applications in Cultural Heritage” (DMACH), pp. 3-16, Amman, Jordan.
Jiḿnez Fernandez-Palacios, B., Remondino, F., Stefani, C., Lombardo, J. , De Luca, L., 2013. Web visualization of complex reality-based 3D models with NUBES. In: Digital Heritage International Congress (DigitalHeritage), pp. 701-704.
Frischer B., 2006. New directions for cultural virtual reality: a global strategy for archiving, serving and exhibiting 3D computer models of heritage sites. In: Proceedings of the conference Virtual Retrospect 2005 (Bordeaux), pp. 168-175.
Koller, D., Tutitzin, M., Levoy, M., Tarini, M., Croccia, G., Cignoni M., Scopigno, R., 2004. Protected interactive 3D graphics via remote rendering. In: Proceedings of ACM SIGGRAPH, pp. 695-703.
Manferdini, A.M., Remondino, F. 2012. A review of realitybased 3D model generation, segmentation and web-based visualization methods. In: Int. Journal of Heritage in the Digital Era, Vol.1(1), pp. 103-124.
Pitzalis, D., Kaminski, J., Niccolucci, F., 2011. 3D-COFORM: Making 3D documentation an everyday choice for the cultural heritage sector. In: Virtual Archaeology Review, Vol. 2, Nº. 4, pp.145-146.
Poccardi, G., 2006. Les bains de la ville d’Ostie a l’epoque tardo -antique (fin IIIe - debut VIe siecle). In: Les cites de l’Italie tardo -antique (IVe - VIe siecle), pp 167-186.
Potenziani, M., Callieri, M., Dellepiane, M., Corsini, M., Ponchio, F., Scopigno, R., 2015. 3DHOP: 3D Heritage Online Presenter. In: Computers & Graphics, 2015 - In press
Remondino, F., 2011. Heritage Recording and 3D Modeling with Photogrammetry and 3D Scanning. In: Remote Sensing, 3(6), pp. 1104-1138.
Remondino, F., Spera, M.G., Nocerino, E., Menna, F., Nex, F., 2014. State of the art in high density image matching. In: The Photogrammetric Record, Vol. 29(146), pp. 144-166.
Uccheddu, F., Corsini, M., Barni, M., 2004. Wavelet based blind watermarking of 3D models. In: Proc. ACM Multimedia and Security Workshop, pp. 143-154.
Zagrouba, E., Jabra, S.B. 2009. A new approach of mesh watermarking Based on maximally stable meshes detection. In: Proceedings of the 3rd International Conference on New Technologies, Mobility and Security (NTMS), pp.1-5.
Zhu, J., Bakdash, J.Z., Koller, D., Banton, T., Proffitt, D.R., Humphreys, G., 2008. Quantifying usability in secure graphics: assessing the user costs of protecting 3D content. In: Proc. Of the Symposium on applied Perception in Graphics and Visualization (APGV).