2D HYPERSPECTRAL FRAME IMAGER CAMERA DATA IN PHOTOGRAMMETRIC
MOSAICKING
A. Mäkeläinen a *, H. Saari b, I. Hippi a, J. Sarkeala a, J. Soukkamäki c a MosaicMill Ltd. - (antti.makelainen, ismo.hippi, janne.sarkeala)@mosaicmill.com
b
VTT, Technical Research Center of Finland – [email protected] c Rikola Ltd. - [email protected]
KEY WORDS: Hyperspectral imaging, Hyperspectral frame camera, Remote sensing, Orthomosaicking, Camera calibration, Vegetation indices, Photogrammetric processing, Bundle block adjustment, UAV
ABSTRACT:
A new 2D hyperspectral frame camera system has been developed by VTT (Technical Research Center of Finland) and Rikola Ltd. It contains frame based and very light camera with RGB-NIR sensor and it is suitable for light weight and cost effective UAV planes. MosaicMill Ltd. has converted the camera data into proper format for photogrammetric processing, and camera’s geometrical accuracy and stability are evaluated to guarantee required accuracies for end user applications. MosaicMill Ltd. has also applied its’ EnsoMOSAIC technology to process hyperspectral data into orthomosaics.
This article describes the main steps and results on applying hyperspectral sensor in orthomosaicking. The most promising results as well as challenges in agriculture and forestry are also described.
1. INTRODUCTION
Our enthusiasm to write this article is based in combining two different themes in remote sensing: Firstly, a new pioneering hyperspectral camera to collect frame based image data with tens of bandwidth sequences. And secondly, the latest photogrammetric methods for aerial image data to rectify and process data into orthomosaics and 3D models. Our project is to combine our know-how in both fields. MosaicMill Ltd. has developed photogrammetric image processing software EnsoMOSAIC while camera development has been in charge of Rikola Ltd. and VTT.
The technical specifications and principles of the new frame based hyperspectral camera are introduced in the beginning of the article. Then there is a short description of hyperspectral data features and data preprocessing steps. The whole photogrammetric process with EnsoMOSAIC software is explained to create final orthomosaics and 3D models. In the end there is a review of vegetation indices that are applicable with hyperspectral data.
2. 2D HYPERSPECTRAL CAMERA
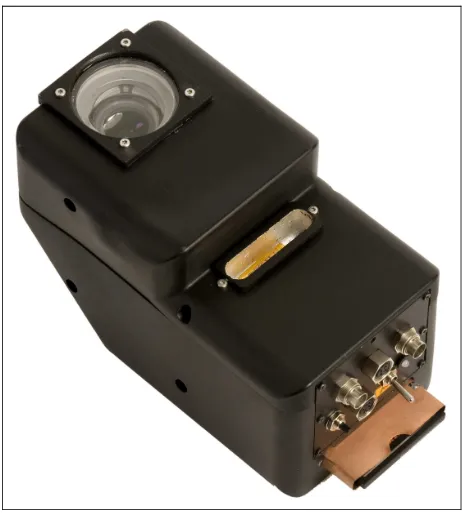
VTT has developed light weight Hyperspectral imaging technology based on Piezo-Actuated Fabry-Perot Interferometers since 2007. The first experiments with a UAV were performed in 2009. This article describes camera prototype of year 2012 (Figure 1). The camera development is continuing and Rikola Ltd. is introducing a new commercial model in 2013. The wavelength selective component in the
hyperspectral camera is a Fabry-Perot interferometer FPI which is formed with two semi-transparent mirrors placed face to face. The use of multiple orders of the FPI is matched to different sensitivities of the RGB pixels of the image sensor.
2.1 Principles and Specifications of Hyperspectral Camera
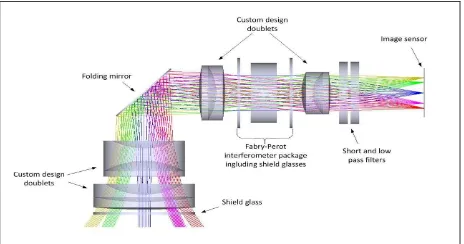
A prototype of year 2012 imager uses a CMV4000 4.2 Megapixel CMOS image sensor from CMOSIS. The sensor has 5.5 µm x 5.5 µm pixels with global electronic shutter. The analog to digital conversion (ADC) of the image sensor is operated in 12 bit mode. The developing project revealed requirements to speed up exposuring time and to improve signal to noise ratio (SNR). To improve the SNR the optical aperture of the Fabry-Perot interferometer was increased to 15.5 mm and the optics for the imager was completely redesigned to obtain a low F- number of 2.7.When the Fabry-Perot interferometer is placed in the lens system in such a way that the light goes collimated through it the transmitted spectral bands are a function of the interferometer air gap. By changing the air gap it is possible to acquire a new set of wavelengths for each image. With a sequence of images captured with different air gap values of the FPI it is possible to reconstruct the spectrum for each pixel in the image. With smaller air gap values it is also possible to capture images at one or two wavelength bands. The range of air gap in FPI is from 400nm to 1500nm, which shield glasses to enable hermetic packaging. Separate short pass and long pass filters are needed to cut out the unwanted transmission at unused orders of the Fabry-Perot interferometer (Figure 2).
Figure 2. Imaging optics of the FPI based hyperspectral imager.
2.2 Using of FPI Based on Hyperspectral Camera
The two mirrors create an optical resonator. Constructive interference allows certain wavelengths to be transmitted through the interferometer whereas other wavelengths are reflected. The parallelism and the distance between the interferometer mirrors need to be controlled with high accuracy. Each band is controlled with nanometer stability and repeatability to obtain the desired parallelism and air gap between the mirrors. To record a full spectrum from a target a sequence of images needs to be captured with a different air gap setting for each image. The air gap values used by the imager
are user selectable. This allows the user to select the recorded wavelength bands from 500nm to 900nm.
The data in the buffer memory is transferred to a CompactFlash memory card after the image capturing. Alternatively the data from the buffer memory can be read through the USB port when connected to a computer. The size of single image is 1024*640 pixels. Time information from the GPS receiver is recorded for each image burst. GPS location as well as the downwelling and upwelling irradiance sensor data is also recorded. The microcontroller can synchronize the start of an image burst to GPS time when operated in time interval based self-triggering mode.
3. CAMERA CALIBRATION 3.1 Geometrical stability and calibration
It is essential in high accurate photogrammetric work to solve out the parameters of internal orientation by calibrating the camera. Especially, it is highly recommended to calibrate the camera before any photogrammetric processing if it is known to be distorted. On the other hand it is important to know the stability of camera system. Stability can be examined by calibrating device several times in laboratory with similar camera settings as used in flight sessions.
We have been studying how the geometry of new Rikola camera behaves with different air gaps or wavelengths. The optical system of Rikola camera is quite compact due to its light weight and suitability to UAV use. It is very typical that there occur notable relative distortions within both radial and tangential parameters and offsetting of principal points.
However, in our studies the camera has been found to be stable enough for photogrammetric work in all the bandwidth range. The average distortion model with standard deviations for Rikola camera is calculated by RapidCal software and shown in Table 1.
parameter unit value st.dev= σ
Focal length pixel 1002,232 1,55 Principal point x* pixel 534,874 2,71 Principal point y* pixel 313,004 2,49 Affinity -1,622 0,50 Radial k1 -320,608 6,88
Tangential t1 3,565 0,59
Un-orthogonality -1,170 0,625 *origo at the upper left corner of image
Table 1. Distortion parameters by RapidCal (1024*640 image resolution).
The deviations σ are relatively small when looking at the vital parameters of focal length and principal point and first terms of distortion parameters although images are relatively high distorted. Big negative value of k1 term implicates very high pincushion distortion.
neither the air gap nor the wavelength causes significant variation into the geometrical stability for EnsoMOSAIC system.
The calculation method applied and parameters in Table 1 are based on common Brown's distortion model. Below is a formula of calculation method for converting ideal image coordinates to pixel coordinates with explanations.
Column = xi + x0 + dColumn Row = y0 – yi - dRow
where dColumn= k1xr2 + k2xr4 + k3xr6 + t12xy +
t2(r2+2x2),
dRow = ay + bx + k1yr2 + k2yr4 + k3yr6 +
t1(r2+2y2) + t22xy
xi and yi input coordinates (specified in pixel
units)
x = xi*general scaling (e.g. 0,001)
y = yi*general scaling
r = distance from principal point (x0,y0) = principal point
k1, k2, k3 = coefficients of radial symmetric
distortion
t1, t2 = coefficients of tangential (decentering)
distortion
a = affinity (aspect ratio) b = skew
Using of terms k2, k3 and t2 are optional. Radial (k1, k2, k3) and tangential (t1, t2) distortion parameters correlate very highly, thus their comparison is not viable.
3.2 Radiometric and spectral stability
Radiometric corrections can be applied within EnsoMOSAIC or in an independent preprocessing software. Adjusting sun corrections, vignetting, hot spots and bit depth can be done in various phases of the process. The radiometric stability of the camera is the biggest challenge in order to provide accurate data for natural resource applications and vegetation indices. Data quality varies in field surveys, e.g. lighting conditions within one block may change a lot. In cloudy conditions the Signal-to-Noise ratio SNR may be low. The sensor is stable and modeled, so it is possible to calculate spectral corrections by mathematical models such as BRDF (bidirectional reflectance distribution function), BSDF (bidirectional scattering distribution function) or any multiplication factor of indices if the reflectance of surface or the reference data is known. The spectral resolution of the prototype version is 10-40 nm. These shortcomings have been corrected in the production cameras by decreasing the sensor size and angle of view.
4. PREPROCESSING SENSOR DATA The Rikola hyperspectral camera captures data as binary data cube (image) with user-specified number of layers (bands). Each data cube contains the information of wavelengths of bands, radiometric pixel information per band and spatial pixel
distribution. The main purpose of data preprocessing is to modify the cameras raw data cube suitable for EnsoMOSAIC or any other aerial image processing software without losing information.
Figure 3 shows six RGB examples of the spectral camera´s 32-band data cube. Choosing of these 32-bands was not based on any specific statistical or causal model. The result of the preprocessing step is a set of hyperspectral data cubes with bands co-registered within each cube, typically in tiff format. Camera is able to collect up to 400 different bands per data cube, but it in practice the number of collected bands is lower according to application requirements. Reducing the number of bands and selecting the most appropriate band combination requires either the use of theory to identify those bands with causal relationships or rigorous statistical procedures to identify highest correlations between the variable of interest or bands (Treitz et al. 2010).
5. PHOTOGRAMMETRIC PROCESSING OF DATA CUBES INTO ORTHOMOSAICS 5.1 Orthomosaicking by EnsoMOSAIC
In this chapter the processing work flow creating orthomosaics and 3D models by EnsoMOSAIC is introduced. The process is the same in case of hyperspectral data cubes as for normal RGB or CIR images. Here the words “image” and “data cube” are used as synonyms.
5.2. Input data and image pyramids: EnsoMOSAIC is designed to create orthomosaics of a block of images with initial positioning information. Overlap between successive images (forward overlap) should be at least 65 percent and between lines (side overlap) at least 35 percent. During the flight GPS data has to be stored either within the data cubes or into different flight log file. Input filtering is applied to convert Figure 3. Example of hyperspectral data cube visualized by RGB combinations. From upper left to lower right the wavelengths are:
positioning data into required input format. Then, image pyramids are calculated for automatic aerial triangulation and for fast image display.
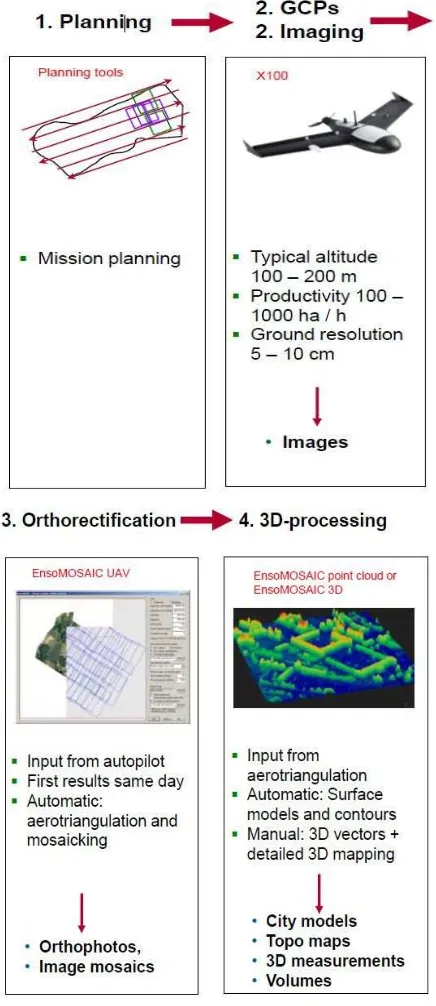
Figure 4. Work flow with UAV platform (point cloud and 3D optional)
5.3. Aerial triangulation and image rectification: EnsoMOSAIC process is very automatic. The graph of processing flow is shown in Figure 4. Aerial triangulation and bundle block adjustment are carried out combined within the same automatic run. Bundle block adjustment (BBA) is an
iterative mathematical process to solve the orientation of the images and the location of the perspective centers simultaneously for a large image block. Mathematically the perspective condition means solving of a large set of linearized equations by applying a statistical least squares method. To solve the equation set successfully prerequisites a high redundancy in the system; i.e. the number of coordinate measurements on images must be far greater than the number of unknown parameters to be solved (MosaicMill, 2013).
After the point measurement has been completed and external orientation solved, the image mosaic can be created. By rotating the images, every image is rectified to the ground coordinate system. Using the locations of the perspective centers of the images a target area on the ground specified by the user is filled with the rectified image data.
5.4. 3D analysis: EnsoMOSAIC creates a sparse Digital Elevation Model (DEM) which is intended for EnsoMOSAIC internal orthorectification. To create more detailed elevation models, exact external orientations calculated by EnsoMOSAIC BBA are used in EnsoMOSAIC 3D to calculate high density point clouds (x,y,z) and raster elevation models (MosaicMill, 2013).
Ground pixel size of hyperspectral camera data is typically in the range 5-10 cm. This resolution is adequate for determination of 3D surface model with 20-40 cm grid spacing which can be used to retrieve e.g. height of individual trees and crops (Saari 2012).
Targeting for the best accuracy of DEM it is not recommended to calculate the DEM with the hyperspectral data only due to its relatively low spatial accuracy. If the platform payload capacity allows, a standard RGB camera is recommended for simultaneous collecting of high-resolution data for elevations.
6. APPLICATION AREAS
Hyperspectral frame sensor opens new application areas for light weight UAV imaging. Pushbroom sensors have offered as wide band selection but that hardware has been too heavy for UAV applications.
This camera is set to the range of 500-900nm where leaf chlorophyll content is the primary factor that affects reflectance. Biophysical and chemical analysis using high spectral resolution remote sensing data include estimating chlorophyll content, leaf area index (LAI) of forest stands, identifying species or determining reflectance of forest canopies.
In agriculture this wavelength range is advantageous for crop indices like yield estimates, detection of crop diseases and flux indices.
Typically hyperspectral data is processed by combining individual bands with each others. The used methods are ratio based, distance based or orthogonal indices. The main idea of ratio based indices is that while a change in illumination may change in remote sensed response, most red/IR ratios should remain unchanged for a given surface regardless of terrain effects (Treitz et al. 2010).
Along with very common ratio based NDVI, the most common vegetation indices utilize information content of red and near-infrared canopy reflectance or radiance. As well many indices are sensor dependent coefficients. Some methods like Perpendicular Vegetation Index (PVI) and Weighted Difference Vegetation Index (WDVI) are very sensitive to atmospheric changes (Qi et al. 1999 & Clevers 1988). In UAV collected data they might be very useful as data collected from UAV does not necessarily require atmospheric corrections. Below, PVI is an example of orthogonal indice and WDVI a distance based indice.
PVI=sin(a)λNIR-cos(a)λred
WDVI=λNIR-g*λred
where g = slope of soil line
λ = value of wavelength (nm)
In ratio based indices known correction factors is designed to improve indices. Example for Soil adjusted Vegetation Indices (SAVI) is corrected by empirical adjustment factor L to minimize the effects of soil background or atmospheric variation. There are also indices with factor to modify model to be more sensitive with soil conditions e.g. moisture.
SAVI= (λNIR-λred)/(λNIR +λred+L )* (1+L)
where L = correction factor 0-1 (high-low vegetation cover)
There is also multiple narrow band versions of NDVI e.g. (Zarco-Tejada et al. 1999):
NDVI= (λ831-λ667)(λ831+λ667) or NDVI= (λ774-λ667)(λ774+λ667)
When applying narrow band indices you h ave to be very careful to be aware of the camera’s spectral accuracy and sensitivity. The use of narrow band indices like Greenness index (G) or Simple Ratio Vegetation Stress (SR) should be further studied to find the most potential and feasible application areas (Treitz et al. 2010).
Red-Edge Vegetation Stress Index (RSVI) is based on upper red edge geometry (Merton, 1998). These indices are for example as following:
G=λ544-λ677
SR=λ744/ λ677
RSVI=((λ715+λ720)/2)-λ733
7. CONCLUSIONS
We see the new hyperspectral frame camera system very suitable for precision agriculture; land use, vegetation and forestry surveys. Its accuracy is good and the camera provides an economical option for limited payload remote sensing, compared to other hyperspectral imagers. The device and the software are being continuously developed, and the goal is to reach appropriate technology level for narrow band indices and for high accuracy remote sensing both from spatial and radiometric point of view.
REFERENCES
Clevers, J.G., 1988. The derivation of a simplified reflectance model for the estimation of leaf area index, Remote Sensing of Environment, 35:53-70.
Merton, R. 1998, Monitoring community hysteresis using spectral shift analysis and red-edge vegatation stress index, Proceedings of the Seventh Annual JPL Airborne Earth Science Workshop, 12-16 January 1998, NASA, Jet Propulsion Laboratory, Pasadena, CA, USA.
Mäkynen, J., Holmlund, C., Saari, H., Ojala, K., Antila, T. 2010, ”Unmanned aerial vehicle (UAV) operated megapixel spectral camera”, Proc. SPIE 8186B.
Qi, J., Chehbouni, A., Huete, A.R., Kerr, Y.H., and Soroosshian, S. 1994. A modified soil adjusted vegetation index, Remote Sensing of Environment, 48:119-126.
Saari, H., Aallos, V., Akujärvi, A., Antila, T., Holmlund, C., Kantojärvi, U., Mäkynen, J. and Ollila, J., 2009, ”Novel Miniaturized Hyperspectral Sensor for UAV and Space Applications”, Proc. SPIE 7474.
Saari, H., Pellikka, I., Pesonen, L., Tuominen, S., Heikkilä, J., Holmlund, C., Mäkynen, J., Ojala, K. and Antila, T., 2011, ”Unmanned Aerial Vehicle (UAV) operated spectral camera system for forest and agriculture applications”, Proc. SPIE vol. 8174.
Saari, H, 2012, UASI Summer 2012 UAV flight campaign results for forest and agriculture applications, VTT.
Treitz, P.,Thomas, V, Zarco-Tejada, P. J, Gong, P, and Curran, P. J., 2010 “Hyperspectral Remote Sensing for Forestry, ASPRS , Monograph Series.
US Patent US 8,130,380 B2, Mar 6, 2012, Spectrometer and Interferometric Method, Heikki Saari, VTT
Zarco-Tejada, P.J., Miller, J.R., Mohammed, G.H., Noland,T .L. and Sampson, P.H., 1999. Canopy optical indices from infinite reflectance and canopy reflectance models for forest condition monitoring:Appilication to hyperspectral CASI data,