A NOVEL METHOD FOR CLOUD DETECTION IN MODIS IMAGERY
Y. Jouybari moghaddam, M.Aghamohamadnia
Remote Sensing Division, Surveying and Geomantic Engineering Department, University College of Engineering,
University of Tehran, Tehran, Iran
KEY WORDS: MODIS, Cloud, Snow, Semi - Cloud, Mean
ABSTRACT:
Data from the Moderate-Resolution Imaging Spectroradiometer (MODIS) are being widely used for quantitatively estimating parameters in the study of atmospheric and land surface processes. Cloud detection is a preliminarily important step in remotely sensed image processing for many applications. The main purpose of this paper is classification of MODIS image into four classes including cloudy, semi cloudy, snow and clear areas. In this article, we use a new method for MODIS cloud detection based on spatial analysis and generation four RGB images. Several MODIS data were applied to evaluate the performance of the new algorithm and the results show that the new algorithm was acceptable result.
1. INTRODUCTION
According to the American Meteorological Society’s Glossary of Meteorology, a cloud is “a visible aggregate of minute water droplets and/or ice particles in the atmosphere above the earth’s surface.”
Remote sensing has become a widely used technology of environmental monitoring and Earth observation. However, few remote sensing images in all clear sky are obtained from the spacecraft and satellite platform. They are contaminated by cloud more or less. Cloud becomes a big obstacle to retrieve the accurate land-surface bio-physical parameters by using satellite imagery. So cloud detection is a preliminarily important step in remotely sensed image processing for many applications, like agricultural, forest fire detection, environmental pollution and water-body monitoring and so on. At the same time, satellite remotely sensed data also offers a unique and useful way in determining cloud cover on a global and local scale. Because clouds play the crucial role in modulating the earth’s atmospheric radiation budget, it is important to detect accurately the distribution of cloud for any climate modelling effort (Z. Li et al, 2005). There have been many studies on cloud detecting and removing before. But most of them make use of visible/near-infrared spectral thresholds to detect cloud according to the characteristic of cloud with high reflectance and low temperature. To enhance the difference between cloud and land surface, people adopt many methods to remove cloud, such as homomorphic filter, template synthesis method et al. (J. Yang et al, 1997).
Although visible/near-infrared spectral threshold method is simple, it is difficult to differentiate cloud and land surface because of the similarity between them when the surface is covered with ice, snow and sand or when cloud is thin cirrus, stratus and small cumulus.
The Moderate Resolution Imaging Spectroradiometer (MODIS) is one of five instruments aboard the Terra Earth Observing System (EOS) platform launched in December 1999. After achieving final orbit, MODIS began earth observations in late February 2000 and has been acquiring data since that time. The instrument is also being flown on the Aqua spacecraft, launched in May 2002. Data from the MODIS on board the NASA EOS
Terra spacecraft is used to generate many geophysical products including snow extent and cloud properties (J. Cheng et al, 2010).
2. DATA SOURCES AND STUDY AREA
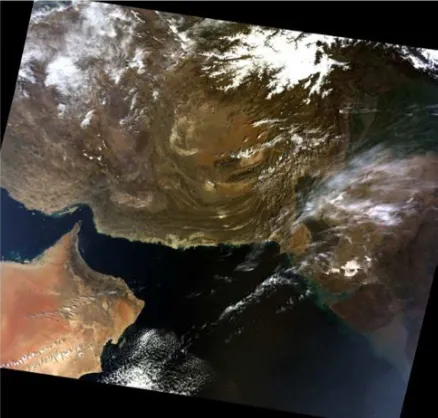
MODIS (Moderate Resolution Imaging Spectroradiometer) is of thirty-six bands within the spectral range from 0.4 to 14 micrometre, twenty visible/near-infrared bands and sixteen thermal infrared bands. MODIS data can be accepted twice a day, which is the ideal data source for resource and environment remote sensing monitoring in the regional scale (Y. Liu, Z. Yang,2001) .This study selects six bands, band 1 (0.620-0.670µm), band 2 (0.841-0.876µm), band 5 (1.230-1.250µm), band 6 (1.628-1.652µm), band 26 (1.36-1.39µm), band 31 (10.78-11.28µm). The study area includes parts of Iran, Afghanistan and Pakistan. Data also includes three class, snow, cloud and semi-cloud.
Figure 1. Test area (R: band 1, G: band 4, B: band 3) International Archives of the Photogrammetry, Remote Sensing and Spatial Information Sciences, Volume XL-1/W3, 2013
SMPR 2013, 5 – 8 October 2013, Tehran, Iran
3. METHOD
The method we use in this study is based on spatial analysis and generation of four RGB images. The main advantage of this method compared to the physical methods is that this is independent from spectral radiance and thresholds are Subjective. The result of the processwas shown at Figure 2.
3.1 Generation of RGB images
Clouds are generally characterized by higher reflectance and lower temperature than underlying earth surface. So it can be used to create RGB images from the visible and thermal bands of clouds identified. In this paper, we use the band 31 from thermal bands and select six bands from visible bands, band 1 (0.620-0.670µm), band 2 (0.841-0.876µm), band 5 (1.230-1.250µm), band 6 (1.628-1.652µm), band 26 (1.36-1.39µm) for
create RGB images. Bands 1 is suitable for detect clouds over land and band 2 is suitable for detect clouds over sea and the desert. We use band 5 and band 6 for distinguish snow from clouds.
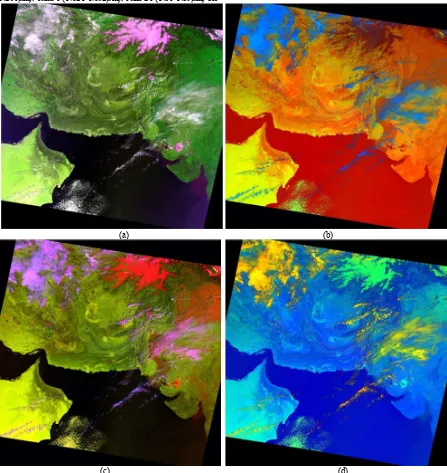
In this step we generated four RGB images. In the first image, combination of bands 5,1 and 3, in second image, the bands 26,2 and 31, in third image, the bands 31,6 and 26 and in fourth one, the aggregation of bands 2,6 and 26, with all 4 image component images respectively tagged as red, green and blue, were utilized. Then we summed up first and second images while subtracting them by third and fourth images. By this, what is obtained is an image with identified fully cloudy and snow covered regions.
(a) (b)
(c) (d)
Figure 2. a) Image1(R: band 5, G: band 1, B: band 3) b) Image3(R: band 31, G: band 6, B: band 26) c) image2(R: band 26, G: band 2, B: band 31) d) image4(R: band 2, G: band 6, B: band 26)
International Archives of the Photogrammetry, Remote Sensing and Spatial Information Sciences, Volume XL-1/W3, 2013 SMPR 2013, 5 – 8 October 2013, Tehran, Iran
3.2 Spatial analysis
In this step we use two rules:
1-Ratio perimeter to area: Considering that the images in snow covered areas of the sharper edges than the clouds area.so ratio perimeter to area can be effective in separating the two classes, snow and cloud.
2- Mean: The most basic of all image features is some measure of image amplitude in term of luminance, spectral value, or other units. One of the simple ways to extract statistical Features in an image is to use the first-order probability distribution of the amplitude of the quantized image. They are generally easy to compute and largely heuristic. The first order histogram estimate is:
( ) = ( )
b: is a gray level in an image.
M: represents the total number of pixels in a neighbourhood Window of specified size cantered around the pixel. N (b): is the number of pixels of gray value b in the window
The following measures (statistical parameters) have been extracted using first order Probability distribution (Pratt, 2001). Mean as the first feature is the average of pixel intensities within the image window.
= ( )
In this step we calculated the mean of two bands of MODIS; first band 31 and second band 1 then we subtracted mean of band 1 from mean of band 31 and segmented this result at the last. By this, what is obtained is an image with identified fully cloudy, semi cloudy and snow covered regions.
3.3 Final classification
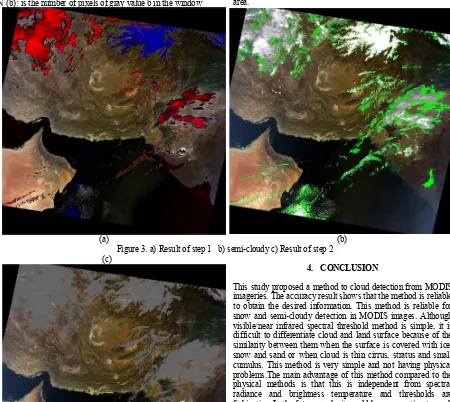
In this step, we subtracted the result of first step from second step to achieve the semi-cloud class. So the image is classified with four class including snow, cloud, semi-cloud and clear area.
(a) (b)
Figure 3. a) Result of step 1 b) semi-cloudy c) Result of step 2 (c)
4. CONCLUSION
This study proposed a method to cloud detection from MODIS imageries. The accuracy result shows that the method is reliable to obtain the desired information. This method is reliable for snow and semi-cloudy detection in MODIS images. Although visible/near infrared spectral threshold method is simple, it is difficult to differentiate cloud and land surface because of the similarity between them when the surface is covered with ice, snow and sand or when cloud is thin cirrus, stratus and small cumulus. This method is very simple and not having physical problems.The main advantage of this method compared to the physical methods is that this is independent from spectral radiance and brightness temperature and thresholds are Subjective. In the future works it would be a suggestion to work on other spatial index and texture analysis for cloud detection.
International Archives of the Photogrammetry, Remote Sensing and Spatial Information Sciences, Volume XL-1/W3, 2013 SMPR 2013, 5 – 8 October 2013, Tehran, Iran
5. REFERENCES
Z. Li, M. Crib, and F. L. Chang, et al. Evaluating the Moderate Resolution Imaging Spectroradiometer Cloud Detection Algorithm Using Whole-Sky Imager Cloud Cover Data at the Three Atmospheric Radiation Measurement Sites. Fifteenth ARM Science Team Meeting Proceedings, Daytona Beach, Florida, March 14-18, 2005
G. Lai, C. Liu, and X. GU, “Erdas Imagine-based Two Approach to Removing Cloud Cover from Remotely Sensed Image,” http://gisworld.363.net/Artic3.htm.
J. Yang, J. Shen, W. Mo, S. Chen, Y. Zhang, and S. Lin, “A Method for Detecting Cloud Pixels on NOAA-AVHRR Image Using Three dimension Statistic Graph and Set Discrimination,” Remote Sensing for Land & Resources (China), Vol. 34, pp. 54-59, 1997.
Y. Sheng, and Q. Xiao, “Water body Identification in Cloud Contaminated NOAA/AVHRR Image,” Remote Sensing of Environment (China), Vol. 9, pp. 247-255, 1994.
Z. Zhao, and C. Zhu, “Approach to Removing Cloud Cover from Satellite Imagery,” Remote Sensing of Environment (China), Vol. 11, pp. 195-199, 1996.
Y. Liu, Z. Yang, MODIS Remote Sensing Information Processing Theory and Algorithm, 1st ed, Vol. 1. Beijing: Science Press, 2001, pp.1-3.
J. Cheng, and S. Liang, et al. A Stepwise Refining logarithm of Temperature and Emissivity Separation for Hyper spectral Thermal Infrared Data. IEEE TRANSACTIONS ON GEOSCIENCE AND REMOTE SENSING, VOL. 48, NO. 3, MARCH 2010
International Archives of the Photogrammetry, Remote Sensing and Spatial Information Sciences, Volume XL-1/W3, 2013 SMPR 2013, 5 – 8 October 2013, Tehran, Iran