INVESTIGATING THE INFLUENCE OF TREE COVERAGE ON PROPERTY CRIME: A
CASE STUDY IN THE CITY OF VANCOUVER, BRITISH COLUMBIA, CANADA
Yifei Chena,*, Yuenan Lia, Jonathan Lia
a Mobile Sensing and Geodata Science Lab, Department of Geography and Environmental Management, University of Waterloo,
200 University Ave West, Waterloo, Ontario N2L 3G1, Canada – (y378chen, y745li, junli)@uwaterloo.ca
ThS 17 - Smart cities
KEY WORDS: Crime Mapping, LiDAR, GIS, Urban Vegetation, Spatial Lag, Geographically Weighted Regression
ABSTRACT:
With the development of Geographic Information Systems (GIS), crime mapping becomes an effective approach to investigate the spatial pattern of crime in a defined area. Understanding the relationship between crime and its surrounding environment can reveal possible strategies that can reduce crime in a neighbourhood. The relationship between vegetation density and crime has been under debate for a long time. This research is conducted to investigate the impacts of tree coverage on property crime in the City of Vancouver. High spatial resolution airborne LiDAR data collected in 2013 was used for the extraction of tree covered area for cross-sectional analysis. The independent variables were put into Ordinary Least-Squares (OLS) regression, Spatial Lag regression, and Geographically Weighted Regression (GWR) models to examine their influences on property crime rates. According to the results, the cross-sectional analysis demonstrated statistical evidences that property crime rates had negative correlations with tree coverage, with greater influences occurred around Downtown Vancouver.
1. INTRODUCTION
Urbanization as a global trend has driven urban sprawl in most metropolitan areas around the world. Thus, effective urban design strategies are required, aiming at providing citizens a prosperous, sustainable and safe living environment. To ensure the safety of the residents, crime prevention has always been a crucial part of urban planning. The study and analysis of crime mainly focus on two aspects, which are the person who commit crime and the place where crime occurs (Thangavelu et al., 2013). For the first aspect, the great complex and diverse nature of human thinking can be an obstacle for analysis and control. Thus, towards crime problems, geography researchers focus on when and where crime take place to discover crime patterns. Before the emergence and development of Geographic Information Systems (GIS) techniques, paper maps and coloured dots were used for crime analysis in the police departments (Thangavelu et al., 2013). However, when big data are used for spatiotemporal analysis and predictions, paper maps are not the best option. Therefore, researchers started using digital maps with spatial crime data to map out the crime incidents and to find the patterns of their distribution.
The crime pattern studies since mid-nineteenth century, whether using paper maps or digital ones, have revealed from the place perspective that, the criminal activity is highly patterned and thus predictable (Brantingham and Brantingham, 1981). In other words, crime incidents are not randomly spatially distributed, and crime “hot spots” do exist (e.g., Cozens et al., 2005). Researchers also found that the hot spots are stable over year (Weisburd et al., 2012), thus suggesting that we can deal with crime problems by concentrating on the identified hotspots, which are within a small number of places.
Based on the fact that the distribution of crime incidents follows a pattern, the concept of crime prevention through environmental design (CPTED) has been put forwarded since 1970s, asserting that “the proper design and effective use of the
built environment can lead to a reduction in the fear and incidence of crime, and an improvement in the quality of life” (Crowe, 2000). Discovering the characteristics of crime-concentrated places can support CPTED strategies planning.
barriers and road closures can be used as potential effective crime prevention techniques through the reduction of accessibility. In the statistical analysis performed by Copes (1999), road density, calculated by dividing the number of roads passing through by the area of the tract, demonstrates a direct influence to the increase of motor vehicle theft. The study conducted in the Kitchener-Waterloo region, Ontario, (Du, 2015) used road density as an explanatory variable in the crime regression models, and concluded a positive correlation between crime and road density. The presence of light in the nighttime reduces people’s fear of crime, as well as the possibility of criminals choosing the place to commit crime. A study in three crime hot spots in England demonstrated that the improvement in lighting reduces crime incidents in the area (Painter, 1996). Thangavelu et al. (2013) found rural crime occurs more frequently in areas with less street lights. On the other hand, prosperous regions provide more opportunities for property crime, and the number of street lights can serve as an indicator of urbanization level of an area (Fitterer et al., 2015). The criminology of place study in Seattle (Weisburd et al., 2012) indicated a positive relationship between lighting and crime. Riggs (2014) also suggested that street lights make it easier for criminals to see the contents of parked cars when stealing or to make sure there is no one around when breaking into a house. The influences of educational attainment, young population, and urban layout were also examined by researchers.
Among other potential influential factors, the relationship between vegetation density and crime has been under debate for a long time. Studies find that dense vegetation is usually used as shield by criminals when committing crime, so that vegetation is positively related to crime incidents (e.g., Kuo and Sullivan, 2001). On the other hand, some studies indicate that vegetation relates to the decrease of crime incidents, most likely because that the green spaces attract people to spend time outdoors and thus create nature surveillance around the area (Troy et al., 2012), and that vegetation’s mentally restorative effect may reduce violent crimes by restraining the psychological precursors to criminal acts (Wolfe and Mennis, 2012). There are limited studies conducted to discover the relationship between vegetation and crime in Canadian cities.
This study aimed to discover the statistical relationships between property crime and high-vegetation coverage. Non-violent property crime types, including break and entre, theft, and mischief, were analysed. The research questions of this paper are listed below: 1) Is property crime influenced by tree coverage? 2) How do the spatial distributions of different property crime types relate to high-vegetation coverage? 3) Do the influence of tree coverage on property crime vary spatially? If so, how? 4) How to predict potential crime “hot spots” and develop crime prevention strategies for these places based on the conclusions of the first three questions? The analysis results are able to help urban designers and city police: 1) to understand the spatial patterns of property crime incidents; 2) to understand the spatial influences of tree coverage on property crime; and 3) to support decision making in urban property crime prevention and reduction strategies.
2. LITERATURE REVIEW
Various studies have been done to examine the physical and social environment around the crime hotspots. In terms of physical surrounding environment, the presence of parking lots
and commercial buildings, facilities (bus stop, police station, street lighting, etc.), urban layout, and graffiti are found to be related to the concentration of crime. However, few studies looked at the effect of vegetation. In some of the studies, presence of vegetation was used as an indicator to classify the land use of the study area (e.g., Chen et al., 2004). According to Chen et al. (2004), the percent non-vegetated area was found able to increase the accuracy of prediction of crime hot spots, with a beta coefficient of 0.168, which suggested that non-vegetated area is directly related to the occurrence of crime.
A few studies concentrated on identifying the relationship between vegetation and crime, most of which were conducted in the United States. Bogar and Beyer (2015) reviewed 10 studies from 2001 to 2013 to understand the relationships among urban green space, violence, and crime in the US. The authors found that the study methodology varies and so were the results; thus, they suggested standardization in designs and measurements. Below are the most recent and related studies.
Gorham et al. (2009) studied 11 community gardens and their surrounding area in Houston, Taxas, comparing the numbers of crime incidents in the area surrounding the gardens and in areas randomly selected in the city. The linear regression results showed no significant difference between the numbers of property crimes in the community gardens’ surrounding area and other areas in the city. In other words, the studied community gardens in Houston do not have strong effect on property crime. Garvin et al. (2013) evaluated the influence of green space on crime by conducting an experiment in Philadelphia, Pennsylvania. Comparing the crime rate before and after the greening of chosen vacant lots, the results suggest a reduction in the total number of crime but not significantly related to greening. Moreover, the greening of vacant lands does significantly increase residents’ sense of security.
Troy et al. (2012) conducted a study in the greater Baltimore region, which includes Baltimore City and Baltimore County, Maryland. The study had taken into account the different effects of trees located in public or private land on crime. They found a reverse relationship between crime (robbery, burglary and shooting) rate and vegetation density. Roughly 20% decrease in crime is expected when there is 10% increase in tree cover. And there are evidence that the effect of tree canopy varies between public and private land. Planting trees in public lands can result in higher crime-reduction benefits. However, some area demonstrate direct relationship between trees and crime, probably because the trees are mostly unmanaged, providing concealment for criminals. Another study conducted in Philadelphia (Wolfe and Mennis, 2012) showed similar results, indicating that robberies, burglaries and assaults are inversely related to vegetation coverage. The authors also found that vegetation has a greater effect on assault than other crime types. However, thefts does not show significant association with vegetation coverage. According to Donovan and Prestemon (2012), in Portland, Oregon, the crown area of street trees demonstrates a negative effect on crime, while the number of trees in a house’s lot is associated with the increasing of crime occurrence. Eckerson (2013) conducted a similar study in Minneapolis, Minnesota. The results also indicate a negative correlation between crime and vegetation.
using the crime data from 2013 and applying OLS, Spatial Lag, and GWR models for different crime types. The result indicated a negative correlation between crime and vegetation density and the greater influence occurs in urban centre.
In summary, extensive research has been done on crime spatial analysis. However, there is not enough insight into how crime and vegetation are related. Research is inconsistently designed and focus on particular cities or regions, thus providing a limited perspective on the impacts of vegetation on crime. Moreover, the various research provide evidence that the effects of crime attractors can be different from region to region. To find and understand the influential factors of crime in an area, analysis needs to be conducted using local historical data.
3. METHODOLOGY
3.1 Study Area
The City of Vancouver is a coastal city in British Columbia, locating on the southwest corner of the province, with a size of 114 km2. Home to 603,502 residents in 2011, Vancouver is the eighth largest Canadian municipality, and the most populous city in Western Canada (City of Vancouver, 2015). Although voted as the most liveable city in the world, Vancouver has a high crime rate and a high Crime Severity Index (CSI) both among the top ten in the country (Perreault, 2013; Boyce et al., 2014). This has drew attention from the public and scientists. Various research have been done to support crime prevention planning, and the crime statistics showed a progress in the field, with the calls for service to the Vancouver Police Department (VPD) decreasing from the peak in 1996 to the lowest in 2006 (Curman et al., 2014). However, Vancouver still has a much higher property crime rate than the national average (Perreault, 2013), and the rate even increased in 2014 (Boyce, 2015). To enhance community awareness of crime, the VPD has recently launched a Web-GIS application named “GeoDash”, showing the crime incidents in the city and the map is updated every business day for Vancouver citizens to view the most up to date crime data (VPD, 2015). Previous studies in Vancouver provided insights on crime spatial concentration and crime
attractors in social context. Predictive crime model has also been developed. However, there is a lack of knowledge on the relationships between vegetation and crime, and between road network and crime in the area.
Figure 1 shows the study area and the local neighbourhood boundaries. The city was divided into dissemination areas, which is the unit of analysis of this study. Dissemination Area (DA) is the smallest standard geographic unit, usually with a population of 400 to 700 persons, in Canadian Census Program. The City of Vancouver has 995 DAs as of 2011, providing the regression analysis with a sample size N = 995.
3.2 Data and Geoprocessing
Vancouver property crime data was obtained from the City of Vancouver Open Data catalogue, which provides free access to the city’s datasets (City of Vancouver, 2016). The original tabular data dated back to 2003 was provided by VPD. Since they have published the GeoDash web application in 2015, the geocoded ESRI point shapefiles were also made available to the public from the Vancouver Open Data catalog. The datasets provide information including crime type, year, month, neighbourhood, and coordinate. In this study, BNE commercial and BNE residential/other were categorized as BNE, and theft from vehicle, theft of vehicle, and other theft were categorized as theft. Property crime includes theft, BNE, and mischief. Violent crime types, including homicide and other crime against person, were not included in the shapefiles for privacy protection. It should be noted that the data does not include all the cases reported to the police for privacy and investigation purposes, according to VPD. Moreover, the coordinates of the crime incidents were offset from the actual crime scenes, also for privacy reason. In addition, the recorded cases do not necessarily include all the criminal activities, since victims may choose not to report to the police (Luo, 2012). The 2013 crime rates of theft, BNE, and total property crime were the three outcome variables in this study, defined as the volume of crime in an area to the population of that area. In this study, they were expressed per 1,000 population per year.
High resolution tree crown area data was extracted from airborne LiDAR data of Vancouver, collected in February 2013. The datasets are in LAS file format and also openly available from the City of Vancouver Open Data catalogue, provided by their GIS and CADD services branch. Due to the large size of LiDAR point cloud, the dataset was divided into 168 tiles covering the jurisdiction of the city. The density of the LiDAR data is averagely 12 points/m², reaching the vertical accuracy of 18 cm and the horizontal accuracy of 36 cm, both with 95% confidence level. Points represent tree crowns were selected and aggregated into polygons. Accuracy assessment was conducted for the derived tree covered areas. Vancouver Orthophoto 2013 was used as the ground truth map and region of interest (ROI) was selected based on whether or not the area is covered by tree crowns. More than one million random pixels (7.5 cm x 7.5 cm) were selected to be compared with the tree canopy polygons extracted from LiDAR data, and another one million pixels were selected from the land area that was not covered by tree crowns. Since the extracted tree cover and the ROI files were both polygon shapefiles, areas of the polygons were calculated and an error matrix was built accordingly. This error matrix was used to estimate the user’s accuracy, producer’s accuracy, and overall accuracy of the tree canopy extraction.
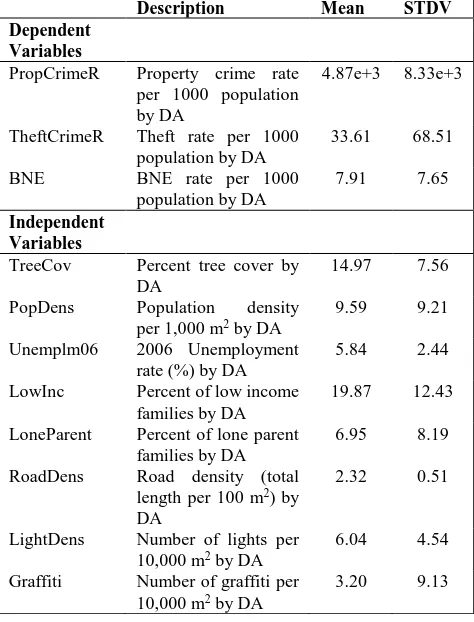
Description Mean STDV Dependent
Variables
PropCrimeR Property crime rate per 1000 population
RoadDens Road density (total length per 100 m2) by
The analysis included population density, unemployment rate, percent lone parent families, percent low income families, road density, number of street lights, and number of graffiti as ancillary data. The 2013 road network data was obtained from Statistic Canada and clipped to the study area. Census data of 2011 by dissemination area, including DA boundaries, was obtained from Statistics Canada, while point shapefiles presenting the most up-to-date locations of every street light and graffiti were provided by Vancouver Open Data catalog and
downloaded in 2015. The 2011 education and labour data by DA was missing and the 2006 census data was used instead. Table 2 shows the description and statistics of the variables.
3.3 Regression Models
The statistical relationships between crime and tree covered area can be assessed in GeoDa software using regression models. The OLS estimation was firstly applied to the examined crime types respectively, with all the dependent variables as covariates. However, according to previous crime studies, crime usually have positive spatial autocorrelation, and locations with high crime rates are usually clustered together. Using the OLS linear regression model which ignores the spatial autocorrelation of crime data can lead to erroneous results. Therefore, Lagrange multiplier (LM) tests were assessed to determine the best fit spatial regression model. It was done by comparing the standard and robust LM-Error and LM-Lag test values. Besides, an increase in the log likelihood of spatial regression model than that of the OLS model suggests an improvement of fit of the data (Anselin, 2004).
Spatial lag model, which is a spatial autoregressive model, “assumes spatial autoregressive process occurs only in the dependent variable” (Xie et al., 2015). It can be expressed in matrix notation as below (Xie et al., 2015; Bidanset and Lombard, 2014):
y = ρWy + Xβ + ε (1)
where, y is the dependent variable, X is a matrix of covariates, ρ and β are vectors of coefficients, ε is an error term, and W is the spatial weights matrix. Spatial error model assumes that spatial autoregressive process occurs only in the error term, and it can be expressed as below (Xie et al., 2015):
y = λWu + Xβ + ε (2)
al., 2005). A pseudo t value close to 0 indicates a low significance of the local coefficient.
4. RESULTS AND DISCUSSION
Percent tree covered area was the investigated explanatory variable in this study. Thus the accuracy of tree crown area extraction from LiDAR datasets directly influences the performances of the regression models based on it. Therefore, accuracy assessment was conducted using the 2013 orthophoto, and the result shows that the tree covered area extraction had a producer’s accuracy of 96.9% and a user’s accuracy of 99.9%. The overall accuracy of tree covered area extraction is 98.4%. In conclusion, the results indicated a high accuracy of tree covered area extracted from LiDAR datasets.
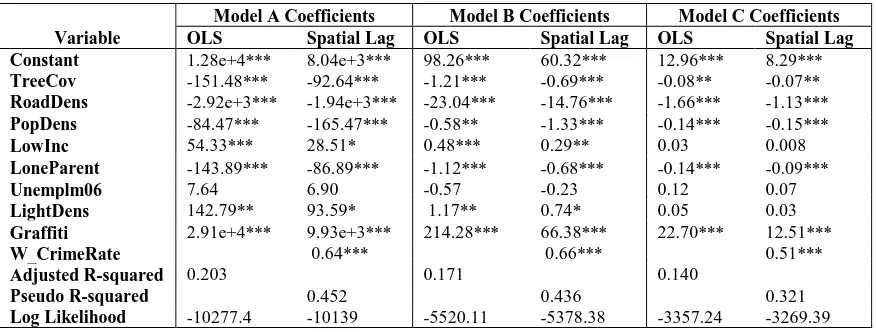
The OSL regression was first applied to the three models and the results are shown in Table 3. Percent tree coverage demonstrated significant (with 0.01 significance level) negative correlations with theft, BNE, and total property crime rates. However, according to the results, the adjusted R2 values of all the three models were notably low. Additionally, the LM-Error and LM-Lag statistics were both highly significant, suggesting a high possibility that spatially adjusted regressions would better fit the dataset. According to the LM test results, spatial lag had higher values which means spatial lag regression is more likely to be the best fit of the data. Therefore, spatial lag regression was then applied to each model, and the results are also shown in Table 3 to be compared with the OLS results. The results of spatial lag regression indicated a significant inverse relationship between the three outcome variables and road density. The negative correlations were also significant between property crime rate and percent tree cover, between theft and percent tree cover, and between BNE rate and percent tree cover (p<0.05).
Pseudo R2 of spatial lag regression result is not a real R2 and not comparable with the adjusted R2 of OLS regression, thus the performances of the regression models were estimated through the comparison of the likelihood. As noted before, log-likelihood is used to estimate the fit of the model with a higher value (less negative) indicating a better fit. The high significance of the spatially lagged dependent variable “W_CrimeRate” and the enhanced log-likelihood value both confirmed the better performance of the spatial lag models.
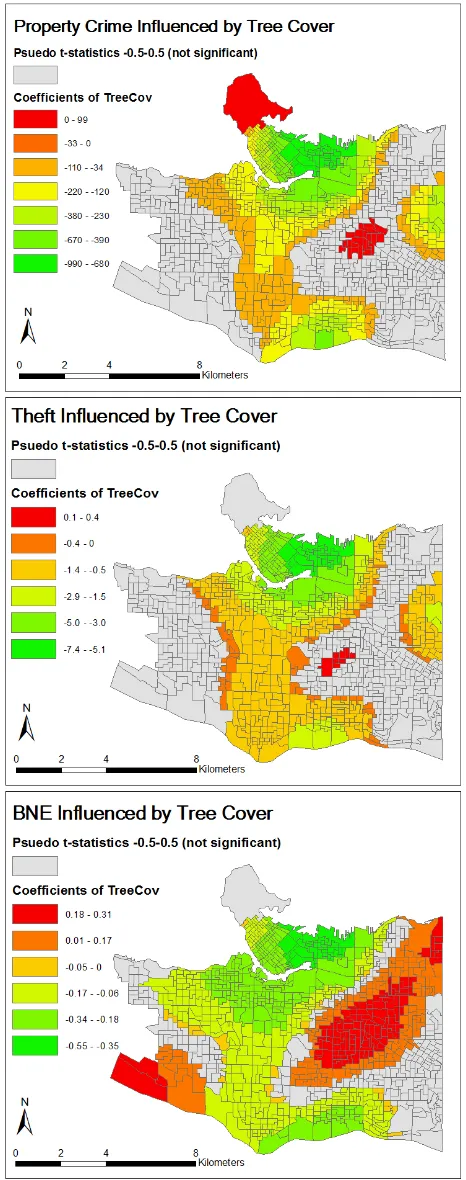
The next step involved applying GWR to the three models. Given the evidence that the independent variable unemployment rate did not show significant influence on crime, it was eliminated when applying GWR. Compared to the OLS regression results, GWR results, with lower AICc statistics and enhanced adjusted R2s, proved the significance of spatial non-stationarity of the crime-tree relationship. The output DA polygons from GWR tool had their local coefficients for the tested explanatory variables, and the variation of the local coefficients for percent tree covered area in each model were mapped respectively (see Figure 4). Pseudo t-statistics were calculated and the DAs which had pseudo t-statistics close to 0 were regarded to have non-significant regression results thus symbolized by colour grey in the maps. The significance thresholds were set as |t| > 0.5.
As shown in the property crime GWR map, coefficients of percent tree cover were becoming more negative in DAs that are closer to the downtown core of Vancouver, expressing greater effects on property crime rates in the downtown area and the Strathcona neighbourhood. On the other hand, Stanley Park and some residential DAs in the Kensington-Cedar Cottage neighbourhood showed a positive correlation between tree coverage and property crime rate, with a lower effect. The theft GWR maps showed similar trends of coefficients, with relatively smaller actual values. The BNE GWR map is different from those of property crime and theft. The negative effects from percent tree cover on BNE rate were still greater in downtown Vancouver and the Southern shoreline, but much more DAs had demonstrated positive effects that were significant. Due to the low crime rate of BNE, the magnitude of effects from tree coverage on BNE was much lower than that on theft and total property crime.
The regression results have provided solid evidence of the inverse relationship between trees and property crime rate in Vancouver City. Firstly, airborne LiDAR data served as a reliable source of deriving tree crown areas and their spatial distribution in the city, with an overall accuracy of 98.4%. Compared to Landsat imagery, LiDAR data provided details of tree crowns beside buildings and along city streets. Having set a parameter of 2 meters when applying aggregate points, the
Variable
Model A Coefficients Model B Coefficients Model C Coefficients OLS Spatial Lag OLS Spatial Lag OLS Spatial Lag Constant 1.28e+4*** 8.04e+3*** 98.26*** 60.32*** 12.96*** 8.29***
TreeCov -151.48*** -92.64*** -1.21*** -0.69*** -0.08** -0.07**
RoadDens -2.92e+3*** -1.94e+3*** -23.04*** -14.76*** -1.66*** -1.13***
PopDens -84.47*** -165.47*** -0.58** -1.33*** -0.14*** -0.15***
LowInc 54.33*** 28.51* 0.48*** 0.29** 0.03 0.008
LoneParent -143.89*** -86.89*** -1.12*** -0.68*** -0.14*** -0.09***
Unemplm06 7.64 6.90 -0.57 -0.23 0.12 0.07
LightDens 142.79** 93.59* 1.17** 0.74* 0.05 0.03
Graffiti 2.91e+4*** 9.93e+3*** 214.28*** 66.38*** 22.70*** 12.51***
W_CrimeRate 0.64*** 0.66*** 0.51***
Adjusted R-squared 0.203 0.171 0.140
Pseudo R-squared 0.452 0.436 0.321
Log Likelihood -10277.4 -10139 -5520.11 -5378.38 -3357.24 -3269.39
extracted tree crown polygons from LiDAR points can be considered as having a spatial resolution of 2 m x 2 m. In addition to the use of a small unit of analysis which was dissemination area, the high resolution and accuracy of tree covered area extraction and calculation led to the precision in estimating its relationship with property crime.
Spatial lag regression models proved the qualitative findings with significant negative coefficients in regression results. According to Table 3 with the spatial lag regression results, BNE had a less negative coefficient in spatial lag result, which means a small magnitude of influence from trees. Moreover, the explanatory power of the BNE model, denoted by pseudo R2, was smaller than the other two models. The first finding could be due to the fact that BNE has a smaller incident number than theft. The possible cause of the smaller explanatory power of the BNE model is that BNE rate is affected by other factor(s) which may have little influence on other property crime types. For example, the BNE rate is more likely related to the distribution of building types and numbers, as well as average income of the families, security facilities, etc.
GWR provided more information into the research questions. Most importantly, it demonstrated the spatial variation of the tree influencing property crime. Significant negative correlations exist in the central area of the city, and the magnitude of influence becomes greater in the downtown core of the city. However, unlike other DAs, Stanley Park DA and some of the Kensington-Cedar Cottage DAs demonstrated a positive correlation between property crime and trees.
According to the geoprocessing results, the Kensington-Cedar Cottage neighbourhood had a high tree coverage and a relatively high property crime rate in 2013. However, as one of the most ethnically diverse neighbourhood in east Vancouver, its high crime rate can be a result of a high social disorganization level rather than a high tree coverage of the neighbourhood. Stanley Park had a high property crime rate most likely because it is a tourist attraction, which makes it vulnerable to theft and mischief. Therefore, for these exceptions, high crime rates are explained by other factors rather than merely depending on trees and road network.
The standard residuals of the local regressions estimated using GWR were also reviewed. The under- and over-estimated results should be randomly scattered over the map, and clusters in the map indicate that there are factors that were not taken into the account in the model (ESRI, 2016). However, the high regression residuals were concentrated in the northern area of the city including Stanley Park and downtown area. Moreover, on exploring the local R2 values of GWR results of property crime model, it is noticed that local R2 values below 0.2 were clustered in the Renfrew-Collingwood and Kerrisdale neighbourhood. These are also the results of variations in the social aspect among different neighbourhoods. Other important factors other than the included variables may be involved.
The findings have inspired the strategies planning on urban design for property crime prevention. The inverse correlation between tree coverage and property crime suggests that the Greenest City Action Plan carried on in Vancouver (City of Vancouver, 2011) can not only create beautiful views and clean air, but also reduce city property crime rate and provide a safe living environment for residents. In addition, downtown core of the city is usually a place with high crime rate. According to the
GWR maps, since the tree coverage has greater influence on property crime in downtown Vancouver, tree planting projects should be carried on in the downtown core commercial areas in order to reduce property crime rate.
There are several limitations of this study. First of all, the study area was limited to the city of Vancouver, and some of the results are representative within the city (e.g. the spatial variation of influence of trees on crime). The study of the greater Vancouver area would possibly reveal more patterns and information. Also, similar research should be conducted in other municipalities in Canada to verify the hypotheses.
Furthermore, due to the restriction of violent crime data usage, this study did not include the analysis of violent crime data. However, as noted before, Vancouver also has a high Crime Severity Index (CSI) taking into account the seriousness of crime incidents as well, and violent crime consequences are usually more serious than property crime. Furthermore, vegetation and trees are likely to prevent violent crime by mentally restorative effects that restraining the psychological precursors to crime acts. Thus theoretically it has greater influence on crime types involving violence. The result of another study in Philadelphia (Wolfe and Mennis, 2012) indicated that burglaries and robberies, which are both violent crime, have a significant inverse relationship with trees while theft does not. Therefore, future work may be conducted to investigate the influence of vegetation and road network on violent crime as well. The newly launched GeoDash web application enables the collection of homicide and crime against person incidents data.
Lastly, the use of LiDAR dataset in this study was limited to the extraction of classified tree points. The average height of high vegetation can be derived from the dataset and used as another explanatory variables to investigate if crime rate is related to tree height. In addition, such high-spatial resolution LiDAR data with three-dimensional information has the potential for the construction of 3D models for further development of crime prevention applications.
5. CONCLUSIONS
This study contributes to the Canadian literature on crime prevention through environmental design (CPTED) by investigating the influences of tree coverage on property crime in the city of Vancouver, British Columbia. The key findings of this study are that, property crime and its two main categories, namely theft and break and enter (BNE) have significant inverse relationships with percent tree coverage. Moreover, the influence varies spatially, with the greater influences concentrated in Downtown Vancouver and its surrounding neighbourhoods. These notable findings provide supports for decision making in urban planning. Planting trees and developing new urban parks can reduce property crime in Vancouver, especially in its downtown core. And allocating police force in neighbourhoods with low tree coverage can be an effective way of saving police resources while also keeping the city safe. Green vegetation can provide not only beautiful views, but also clean and fresh air, and well-developed road network can provide residents with convenience in life. The findings from this study also suggests that property crime reduction is a potential benefit of urban trees. In conclusion, urban planners and city police can work together in environmental sustainable development and crime reduction simultaneously.
REFERENCES
Andresen, M. A., 2006. A spatial analysis of crime in Vancouver, British Columbia: a synthesis of social disorganization and routine activity theory. The Canadian Geographer, 50(4), 487–502.
Anselin, L., 2004. Exploring spatial data with GeoDaTM: a workbook. Urbana, 51, p.61801.
Beavon, D. J., Brantingham, P. L. and Brantingham, P. J., 1994. The influence of street networks on the patterning of property offenses. Crime Prevention Studies, 2, pp.115-148.
Bidanset, P. E., and Lombard, J. R., 2014. Evaluating spatial model accuracy in mass real estate appraisal : A comparison of geographically weighted regression and the spatial lag model. Cityscape: A Journal of Policy Development and Research, 16(3), 169–182.
Brantingham, P. J. and Brantingham, P. L. eds., 1981. Environmental Criminology (pp. 27-54). Beverly Hills, CA: Sage Publications.
Bogar, S. and Beyer, K. M., 2015. Green space, violence, and crime: A systematic review. Trauma, Violence, & Abuse. 17(2): 160-71.
Boyce, J., Cotter, A., and Perreault, S., 2014. Police-reported crime statistics in Canada, 2013. Retrieved from http://www.statcan.gc.ca/pub/85-002-x/2014001/article/14040-eng.htm
Chen, D., Weeks, J. V, and Kaiser Jr. J. V., 2004. Remote sensing and spatial statistics as tools in crime analysis. Geographic Information Systems and Crime Analysis, (1), 270– 292.
City of Vancouver, 2015. Our city. Retrieved from http://vancouver.ca/news-calendar/our-city.aspx
City of Vancouver, 2016. Kensington-Cedar Cottage. About Vancouver – Areas of the City. Retrieved from
http://vancouver.ca/news-calendar/kensington-cedar-cottage.aspx
Clear, T. R., Rose, D. R., Waring, E. and Scully, K., 2003. Coercive mobility and crime: A preliminary examination of concentrated incarceration and social disorganization. Justice Quarterly, 20(1), pp.33-64.
Copes, H., 1999. Routine activities and motor vehicle theft: A crime specific approach. Journal of Crime and Justice, 22(2), pp.125-146.
Cozens, P. M., Saville, G., and Hillier, D., 2005. Crime prevention through environmental design (CPTED): a review and modern bibliography. Property Management, 23(5), 328– 356.
Crowe, T. D., 2000. Crime Prevention through Environmental Design: Applications of Architectural Design and Space Management Concepts. Butterworth-Heinemann.
Du, Y., 2015. How Do Vegetation Density and Transportation Network Density Affect Crime across An Urban Central-Peripheral Gradient: A Case Study in Kitchener-Waterloo, Ontario, Master Research Paper, University of Waterloo.
Eckerson, A. W., 2013. Understanding the relationship between tree canopy and crime in Minneapolis, Minnesota using geographically weighted regression. Papers in Resource Analysis, 15. Retrieved from http://www.gis.smumn.edu/ GradProjects/EckersonA.pdf
ESRI, 2016. Interpreting GWR results. ArcGIS for Desktop Support. Retrieved from http://desktop.arcgis.com/en/arcmap /latest/tools/spatial-statistics-toolbox/interpreting-gwr-results. htm
Fitterer, J., Nelson, T.A. and Nathoo, F., 2015. Predictive crime mapping. Police Practice and Research, 16(2), pp.121-135.
Garvin, E. C., Cannuscio, C. C., and Branas, C. C., 2013. Greening vacant lots to reduce violent crime: a randomised controlled trial. Injury Prevention, 19(3), 198–203.
Gorham, M. R., Waliczek, T. M., Snelgrove, A., and Zajicek, J. M., 2009. The impact of community gardens on numbers of property crimes in Urban Houston. HortTechnology, 19(2), 291–296.
Kuo, F. E. and Sullivan, W. C., 2001. Environment and Crime in the Inner City. Environment and Behavior, 33(3), 343–367. Nakaya, T., Fotheringham, A. S., Brunsdon, C. and Charlton, M., 2005. Geographically weighted Poisson regression for disease association mapping. Statistics in Medicine, 24(17), 2695 - 2717.
Thangavelu, A., Sathyaraj, S. R., and Balasubramanian, S., 2013. Assessment of spatial distribution of rural crime mapping in India : A GIS perspective. International Journal of Advanced Remote Sensing and GIS, 2(1), 70–85.
Painter, K., 1996. The influence of street lighting improvements on crime, fear and pedestrian street use, after dark. Landscape and Urban Planning, 35(2), pp.193-201.
Patino, J. E., Duque, J. C., Pardo-Pascual, J. E., and Ruiz, L. A., 2014. Using remote sensing to assess the relationship between crime and the urban layout. Applied Geography, 55, 48–60. Riggs, M., 2014. Street lights and crime: A seemingly endless debate. CityLab. Retrieved from http://www. citylab.com/ housing/2014/02/street-lights-and-crime-seemingly-endless-debate/8359/
Shaw, C. R. and McKay, H. D., 1942. Juvenile Delinquency and Urban Areas. Chicago: University of Chicago Press.
Troy, A., Morgan Grove, J., and O’Neil-Dunne, J., 2012. The relationship between tree canopy and crime rates across an urban-rural gradient in the greater Baltimore region. Landscape and Urban Planning, 106(3), 262–270.
Wang, F. and Minor, W. W., 2002. Where the jobs are: employment access and crime patterns in Cleveland. Annals of the Association of American Geographers, 92(3), pp.435-450.
Weisburd, D. L., Groff, E. R. and Yang, S. M., 2012. The Criminology of Place: Street Segments and Our Understanding of the Crime Problem. Oxford University Press.
Wolfe, M. K. and Mennis, J., 2012. Does vegetation encourage or suppress urban crime? Evidence from Philadelphia, PA. Landscape and Urban Planning, 108(2-4), 112–122.