ANALYSIS OF THE PIT REMOVAL METHODS IN DIGITAL TERRAIN MODELS
OF VARIOUS RESOLUTIONS
S. Šamanović(a), D. Medak(b), D. Gajski(a)
(a) Faculty of Geodesy, Institute of Cartography and Photogrammetry, Kačićeva 26, Zagreb, Croatia -
(ssamanovic, dgajski)@geof.hr
(b) Faculty of Geodesy, Institute of Geomatics, Kačićeva 26, Zagreb, Hrvatska - [email protected]
Commision II, WG II/3
KEY WORDS: Pit removal, DTM, photogrammetry, carving method, filling method, geomorphometry, hydrology
ABSTRACT:
Digital terrain model (DTM) is the base for calculation of the surface runoff under the influence of the gravity (gravity flow) in hydrological analysis. It is important to produce hydrologically corrected DTM with the removed natural and artificial depressions to avoid numerical problems in algorithms of the gravity flow. The pit removal procedure changes geomorphometry of the DTM. GIS software packages use pit removal algorithm independently of geomorphmetric features of the analyzed area. In need of minimally modified DTM after the pit removal areas, the carving method (deepen drainage routes) and the filling method (fill sink) were analyzed on three different geomorphometric areas (bare mountain range, hilly wooded area and the plain area intersected with the network of the drainage canals). The recommendation is given for the choice of geomorphometric least changing DTM algorithm. The input data are raster data of elevation points created by stereoscopic photogrammetry method in 5x5 and 25x25 meter resolution. Differences have been noticed during the process of creating raster data. The recommendation is given for the choice of the most acceptable method for each type of area on the basis of comparison of the original elevation points with the elevation points in created DTM.
1.
INTRODUCTIONDigital terrain model (DTM) is the base for the spatial analysis and data modeling. The need for quick and efficient analysis of spatial data, simple and comprehensible exchange of a large number of information within professions involved in geospatial analysis, the development of the computer science and the application of new technologies in collecting spatial data imposed the need for defining the quality input data that are customized to the needs of the users.
The paper presents the differences in the application of two methods of calculating DTM on three geomorphometrically different landscapes in two resolutions (25x25, and 5x5 meters).
For unhindered performance of a hydrological analysis it is necessary to have a model without depressions. The pit removal changes the geomorphometry of the DTM, however the implemented algorithms in GIS softwares do not remove depressions based on the geomorphometry of the researched area but it depends on the algorithms implemented in the program. An essential prerequisite for relevant and high-quality hydrological analysis (direction of the gravity flow or calculations of the catchment area) are the accurate input data. This paper researches two basic methods for the pit removal (filling and carving or breaching) depending on geomorphometry and resolution of researched area.
2. PREVIOUS RESEARCH
In geomorphology the depression means indent of the Earth`s surface regardless its occurrence, size and shape, it is a part of the land surface or the sea bed and it is located under level of the surrounding area due to tectonic movements, descending
of the longer fault lines, epeirogenic movement (Cvitanović,
2002).
Runoff algorithms define the path along which gravity flow will move from the chosen cell to one or more adjacent cells where selection of the algorithm influences on the calculation of hydrological parameters. We distinguish two basic algorithms for the gravity flow. Single flow direction (D8, Rho8, KRA) in which the water is concentrated in center of the cell (O’Callaghan and Mark, 1984; Fairfield and Leymarie, 1991; Lea, 1992), and multiple flow direction (D∞, Fd8, DEMON) in which water overlaps evenly the whole cell (Goodchild, 2013; Wilson and others, 2008; Tarboton, 1997).
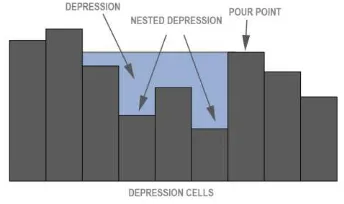
In order to enable the calculation of the gravity flow every analyzed cell of the DTM must have adjacent lower cell towards which the runoff is possible. This requirement is necessary for calculation of the gravity flow.
Figure 1. Terrain with the depressions (Bartak, 2009)
the total DTM area). Depression includes all the cells of its demarcation which altitude is less than altitude of the point of overflow (figure 1).
There are five potential approaches to define if depression is artificial or actual: ground inspection, examining the source data, classification approaches, knowledge-based approaches and modeling approaches (Lindsay and Creed 2006). Out of these five methods only the method of ground inspection certainly confirms the existence of the topographic pit. The process of defining the actual topographic pits is complicated and long term. Within the GIS software, the process of non-selective removal of both, actual and artificial depressions, is being carried out, whereas inaccurate digital model is created. As the most depressions ultimately outflows to the drainage basin, such corrected model, regardless its inaccuracy, is used in further hydrological analysis.
There are two basic methods for pit removals: filling and carving or breaching.
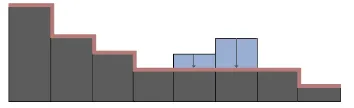
Figure 2. The pit removal by filling method (Bartak, 2009)
The filling method is created from De-pitting method based on the filling of one cell surrounded by adjacent cells with higher altitude. This method of removing of individual depression cells facilitated the process of pit removal with more complex methods (O’Callaghan and Mark 1984). The filling method consists of increasing up the altitude of DTM cells on the altitude of the lowest adjacent cell (figure 2) and which enables runoff (Grimaldi and others 2007). The filling rises till the point of overflow, and the result of that are cells which values are always the same or higher than values of DTM. The procedure is being repeated until all depressions are filled, that is until all cells are adjecent in the course of overflow. Despite being the most spread and the simplest method it causes significant change of digital model (Jenson and Domingue 1988).
The caving method solves the problem of depressions by creating the overflow path, that is lowering high DTM cells by carving canals (figure 3).
Figure 3. The pit removal by carving method (Bartak, 2009)
The algorithms create passage from depression by finding the lowest adjacent cell, and in case of more cells of the same height the shortest path is taken in to consideration. The cells in depressions are conducted to the nearest cell with the lowest height or till the edge of the model. The first step consists of finding the path that defines the course out of the depression. This path is also called the direction of the runoff, and the cells throughout this path are the part of runoff basin. The modules for the pit removal use PFS algorithm in order to find the way out of the depression. The algorithm repeats this
procedure from the point of origin using the adjusted elevation by creating the canal with continuous defined slope.
3. DATA SELECTION
All the necessary data for reconstruction of the aerial survey and the results of the triangulation are obtained from the State Geodetic Administration. The images were made with analogue areal cameras at the scale of 1:20 000. They were scaned with the resolution of 21 µm, in TIFF format, and the size of individual photographs (format 23x23 cm) is 11200x11200 pixels. The whole researched area was not surveyed at the same time, so the data for various areas have different characteristics (color – black/white image, different cameras).
For the needs of this research three areas of the Republic of Croatia were singled out, the mountain range Biokovo, the mountain Papuk and lowland in the municipality Nijemci, sized approximately 5000x4000 meters that is 2000 hectare. They were chosen due to the differences in their geological characteristics, relief, as in hydrological and hydrogeological characteristics.
The coastal mountain range Biokovo separates the Adriatic coast from Dalmatian hinterland. With the exchange of ice age and warmer periods, erosion and corrosion, karst was created, what made its morphomollogy specific, characterized by porosity rocks and groundwater (Benac 2003).
Papuk is the longest mountain located in the north-east part of Croatia, with the slightly sloping relief and complex geological structure. Surface forms that characterize Papuk are cracks, funnel-shaped holes, small caves, sinkholes, water sources and torrents created by the influence of the circulation of water sources and precipitation waters. underground and surface watershed, which results in drainage basin of rivers Sava and Drava as a singular hydraulic system.
4. DATA COLLECTION AND ANALYSIS
AREA NUMBER OF MEASURED POINTS
NUMBER OF POINTS FOR COMPARATION
INTERPOLATION METHOD
CORRELATION METHOD
BIOKOVO 5 38961 36403 0,94 1,58
BIOKOVO 25 15520 4,59 4,92
PAPUK 5 20692 19711 0,37 1,00
PAPUK 25 9847 1,55 1,83
NIJEMCI 5 8652 7832 0,34 0,34
NIJEMCI 25 5439 0,53 0,54
Table 1: Relative accuracy of each model
5.
THE RESULTS OF THE PIT
REMOVAL
The pit removal was made by the program SAGA, and out of offered modules the two characteristic ones were chosen. For the pit removal by carving method, the method developed by Conrad (Hengl and others 2010) was used (DEEPEN DRAINAGE ROUTES, SINK DRAINAGE ROUTE DETECTION). For the pit removal by filling method (FILL
SINK), the method developed by Planchon i Darboux was used (Hengl and others 2010).
Analysis were made in two steps. The first faze was geomorphometrical analysis (better visualization), and the second faze was statistical analysis of the area. For the better insides between the differences in data values with pits and the data values without pits, views by analytical hillshading and by contours were created. All analyses were made on both models and in both resolutions. The figure 4, 5 and 6 shows analysis on the parts of the model created by the method of image correlation.
Figure 4. Relief with contour lines, Biokovo DTM5 (left - a), after the pit removal by carving method (middle - b) and after the pit removal by filling method (right - c)
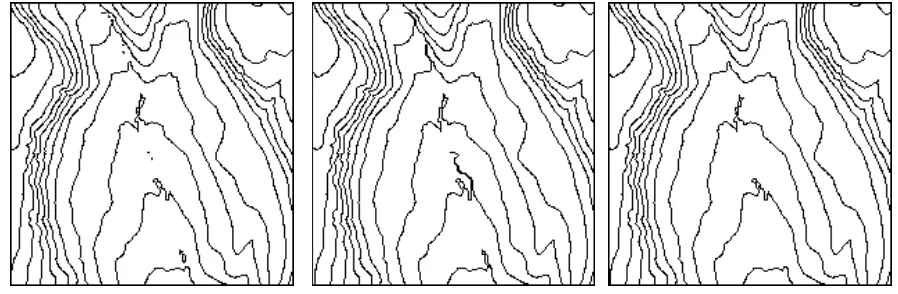
Figure 6. Relief with contour lines, Nijemci DTM5 (left- a), after the pit removal by carving method (middle - b) and after the pit removal by filling method (right - c)
The geomorphometric analysis for certain areas (Biokovo, Nijemci) gave us unequivocal interpretation of the right choice of the pit removal method, but for the area of Papuk we were unable to say with certainty which method is less affecting the terrain morphometry. In order to confirm the method for
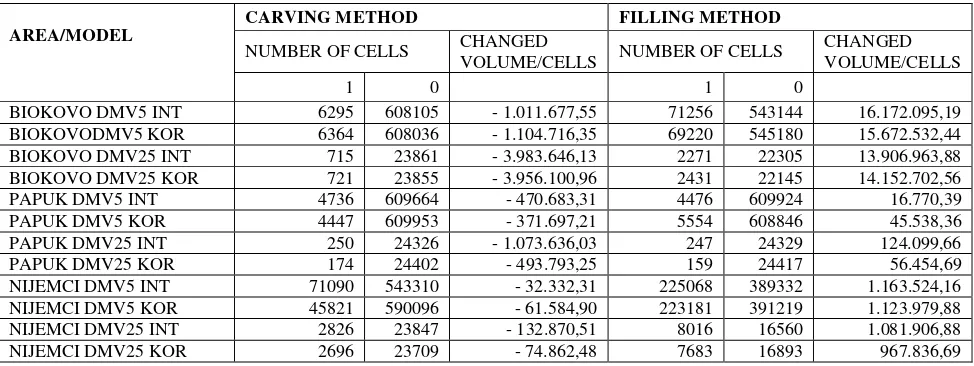
Biokovo and Nijemci, as well as correctly defining the optimal method for Papuk, the calculation of changeable cells and the calculation of the total variable volume of the researched area were made for both methods (table 2).
AREA/MODEL
CARVING METHOD FILLING METHOD
NUMBER OF CELLS CHANGED
VOLUME/CELLS NUMBER OF CELLS
CHANGED VOLUME/CELLS
1 0 1 0
BIOKOVO DMV5 INT 6295 608105 - 1.011.677,55 71256 543144 16.172.095,19 BIOKOVODMV5 KOR 6364 608036 - 1.104.716,35 69220 545180 15.672.532,44 BIOKOVO DMV25 INT 715 23861 - 3.983.646,13 2271 22305 13.906.963,88 BIOKOVO DMV25 KOR 721 23855 - 3.956.100,96 2431 22145 14.152.702,56 PAPUK DMV5 INT 4736 609664 - 470.683,31 4476 609924 16.770,39 PAPUK DMV5 KOR 4447 609953 - 371.697,21 5554 608846 45.538,36 PAPUK DMV25 INT 250 24326 - 1.073.636,03 247 24329 124.099,66 PAPUK DMV25 KOR 174 24402 - 493.793,25 159 24417 56.454,69 NIJEMCI DMV5 INT 71090 543310 - 32.332,31 225068 389332 1.163.524,16 NIJEMCI DMV5 KOR 45821 590096 - 61.584,90 223181 391219 1.123.979,88 NIJEMCI DMV25 INT 2826 23847 - 132.870,51 8016 16560 1.081.906,88 NIJEMCI DMV25 KOR 2696 23709 - 74.862,48 7683 16893 967.836,69
Table 2: The number of changed cells (values1) and total changed volume in cubic meter after the pit removal by carving method and filling method
6. CONCLUSION
For each area, Biokovo (funnel-shaped holes, cracks), Papuk (covered with forests), Nijemci (lowland, drainage canals) the model created by interpolation is improved with break lines and shape lines added to the elevation points raster.
In case of the terrain with large altitude differences on a small area (Biokovo), the different perspectives on the stereo models are being made, so the recognition of identical points by the image correlation is unreliable which results in more quality model created by interpolation. The model of Papuk area created by interpolation is given as a better choice because the model created by correlation is more difficult to perform on the ground regarding to the forest cover. For the area of Nijemci, the standard deviation values are equal for both methods, but regarding to the automatization and speed of performing the model created by the method of image correlation is chosen.
Both views, the one with the analytical hillshading and the one with contour lines (figure 4a), on the area of Biokovo shows extremely sloping terrain with a large number of depressions. After the pit removal, by use of the carving method (figure 4b) we see the differences in terrain topography only on the areas of the drainage canals which leads the water out of the depressions, whereat the elevation of all the contour lines were held. The filling method (figure 4c) significantly changes the terrain by filling the depressions till the point of overflow, transforming the large part of the area in to the flat surface.
presentation on the area of Papuk, where the number of depressions is low, we cannot say with certainty which method is more reliable.
Both views, the one with the analytical hillshading and the one with contour lines (figure 6a), on the area of Nijemci, (equidistance of 0.5 meters due to the small altitude difference), shows the flat terrain with a large number of canals and depressions. The part of the canal also acts as a depression so they were considered in calculation.
Figure 6b and 6c shows the terrain after the pit removal by two methods. It is noticeable that the view of the relief shows significantly less change of topography after the use of the carving method. The filling method fills the canals treating them as depressions. Often it is difficult to define which depressions show the real features of the terrain, and which were caused by a computer error of incorrect DTM calculation. This type of the terrain makes discernment easier. For smaller depressions within the drainage canal we are created drainage canals, while the filling method significantly changes the topography of the whole area.
Though the geomorphometric methods give us the basic guidelines for choosing the right method, statistical analysis with certainty define it (table 2).
The carving method applied on the area of Biokovo changes the elevations on a significantly smaller number of cells. The volume change is smaller on all the models with pits removed by carving method. These results show us that the carving method applied on the areas with a large number of depressions and altitude differences changes the geomorphometry less.
The geomorphometrical analysis applied on the area of Papuk were inconclusive about the advantage between the two methods. The calculations of the changed cells for both methods are approximately the same. Only the calculation of the changed volume of all the models of the Papuk area indicates on the better results of the pit removal by the filling method.
The geomorphometrical analysis applied on the area of Nijemci shows the advantage of one method over the other which confirms a large number of changed cells. The calculations of total changed volume confirm the advantage of the carving method by intersecting of a large number of canals and small altitude differences.
Considering all the results indicates the importance of choosing the right method for collecting the data for DTM, as well as choosing the right method for the pit removal regarding to the geomorphometrical characteristics of the landscape.
7. ACKNOWLEDGMENTS
This research was carried out under the project 1924 -
AFORENSA (Advanced Forest Ecosystem Services
Assessment) supported by the Croatian Science Foundation.
8. REFERENCES
Bartak, V., 2009.: How to extract river networks and catchment boundaries from DEM: a review of digital terrain analysis techniques. Journal of Landscape Studies 2, str. 57-68
Benac, Č., 2003. Rječnik geoloških pojmova. Građevinski fakultet sveučilišta u Rijeci, Rijeka
Cvitanović, A., 2002. Geografski rječnik. Hrvatsko geografsko društvo Zadar, Filozofski fakultet, Maticahrvatska, Zadiz d.o.o.
Fairfield, J., Leymarie, P., 1991. Drainage networks from grid digital elevation models. Water Resources Research Vol 27, 5, str. 709-717
Goodchild, M. F., 2013. Geospatial analysis. 4th Edition, University College London i UC Santa Barbara
Grimaldi, S., Nardi, F., Di Benedetto, F., Istanbulluoglu, E., Bras, R. L., 2007. A physically-based method for removing pits in digital elevation models. Advances in Water Resources, Vol. 30, Iss. 10, str. 2151-2158
Hengl, T., Heuvelink, G. B. M., Van Loon, E., 2010. On the uncertainty of stream networks derived from elevation data: the error propagation approach. Hydrology and Earth System Sciences 14, str. 1153–1165
Jenson, S., Domingue, J. O., 1988. Extracting topographic structure from digital elevation data for geographic information system analysis. Photogrammetric Engineering and Remote Sensing, Vol 54, Br. 11, str. 1593–1600
Jones, R., 2002. Algorithms for using a DEM for mapping catchment areas of stream sediment samples. Computers & Geosciences, Vol. 28, str. 1051–1060 depressions from digital elevation models: towards a minim impact approach. Hydrological Processes 19, str. 3113–3126
O’Callaghan, J.F., Mark, D. M., 1984. The extraction of drainagenetworks from digital elevation data. Computer Vision, Graphics, and Image Processing Vol 28, str. 323– 344.
Tarboton, D. G., 1997. A new method for the determination of flow directions and upslope areas in grid digitalelevation models. Water resources research Vol. 33, Br. 2, str. 309 – 319
Tarboton, D. G., Bras, R. L., Rodriguez-Iturbe, I., 1991. On the extraction of channel networks from digital elevation data. Hydrological Process Vol 5, 1, str. 81-100