High Internight Reliability of Computer-Measured
NREM Delta, Sigma, and Beta: Biological Implications
Xin Tan, Ian Glenn Campbell, Laura Palagini, and Irwin Feinberg
Background: Computer analysis of the sleep electroen-cephalogram (EEG) waveforms is widely employed, but there have been no systematic studies of its reliability. Methods: The most commonly used computer methods are power spectral analysis with the fast-Fourier transform (FFT) and period amplitude analysis (PAA) with zero cross or zero first derivative half-wave measurement. We applied all three computer methods to the digitized EEG of 16 normal subjects who underwent 5 consecutive nights of baseline (placebo) recording. We evaluated the internight reliability of three non–rapid eye movement (NREM) frequency bands of special importance to sleep research: delta (0.3–3 Hz), sigma (12–15 Hz), and beta (15–23 Hz). Results: Both FFT and the two methods of PAA gave excellent internight reliability for delta and sigma. Even a single night of recording correlated highly (r. .9) with the 5-night mean. Beta reliability was lower but still highly significant for both the PAA and the FFT measures. Conclusions: Computer-analyzed sleep EEG data are highly reliable. Period amplitude methods demonstrate that wave incidence and period as well as amplitude are reliable, indicating that the reliability of composite mea-sures (FFT power, PAA integrated amplitude) is not solely based on individual differences in EEG amplitude. The high internight stability of NREM delta indicates that it possesses traitlike characteristics and is relatively inde-pendent of day-to-day variations in state. Biol Psychia-try 2000;48:1010 –1019 © 2000 Society of Biological Psychiatry
Key Words: Sleep EEG, computer, reliability,
homeostasis
Introduction
T
he value of computer measurement of sleep electro-encephalogram (EEG) waveforms is now generally accepted. The two most widely employed methods areperiod amplitude analysis (PAA) with zero cross and zero derivative algorithms, and power spectral analysis (PSA) with the fast-Fourier transform (FFT). In spite of increas-ing use of these methods, there are few published data on their internight reliability or on the absolute magnitudes of the differences that occur across baseline nights. Such data could help formulate experimental designs, such as includ-ing estimates of experimental power and decisions on the number of baseline nights to record. Knowledge of the absolute magnitudes of internight variation under baseline conditions could also be useful for evaluating experimen-tal effects reported in the literature.
We are currently carrying out a large-scale investigation of the reliability of computer-measured sleep EEG under baseline conditions in young adults. Our analyses include a wide frequency range (0 –100 Hz) in both non–rapid eye movement (NREM) and REM sleep. Here we present initial results for three NREM frequency bands of partic-ular interest for the biology of sleep: delta (0.3–3 Hz), sigma (12–15 Hz), and beta (15–23 Hz). The delta band is of interest because of its close relation to maturation and aging (Feinberg et al 1967, 1981, 1990; Williams et al 1974) over the human life span and its central role in homeostatic models (Borbely 1982; Feinberg 1974). Sigma and beta are also of considerable interest. Orga-nized spindles in 12–15 Hz are a distinguishing hallmark of the NREM EEG. Next to delta, organized spindles are the waveforms that show greatest decline between young adulthood and normal old age (Guazzelli et al 1986). It is of further biological interest that sigma and beta power exhibit systematic dynamic relations to delta, relations that have spurred considerable research interest (Aeschbach et al 1997; Borbely 1998) since their initial descriptions by Uchida et al (1991).
Methods and Materials
Subjects
The data for these analyses were obtained in a study that compared the sleep EEG effects of threeg-aminobutyric acid– ergic hypnotics to placebo. The drugs were zolpidem (10 mg), triazolam (0.25 mg), and temazepam (15 mg), given a half hour before sleep in capsules identical to placebo. Preliminary reports
From the Department of Psychiatry, University of California, Davis (XT, IGC, IF), Psychiatry Clinic, University of Pisa, Pisa, Italy (LP), and Veterans Adminis-tration Northern California Health Care System, Martinez (IF).
Address reprint requests to Irwin Feinberg, M.D., University of California, VA/UCD Sleep Lab TB 148, Davis CA 95616.
Received October 18, 1999; revised February 22, 2000; accepted March 2, 2000.
© 2000 Society of Biological Psychiatry 0006-3223/00/$20.00
of the drug effects on NREM delta, sigma, and beta frequencies have been presented (Feinberg et al 1995a, 1995b). The study was comprised of four treatment arms with sleep laboratory recording on 5 consecutive nights. In each arm, subjects received one of the active drugs or placebo for the first 3 nights and then placebo for the final 2 nights. Therefore, in one treatment arm, subjects received placebo for 5 consecutive nights. These pla-cebo data were used for the reliability analyses. Subjects were students at University of California, Davis who gave informed consent and were paid for their participation. There were 10 male and six female subjects between the ages of 19 and 26 years (mean520.1, SD52.5). All were nonsmokers, within 25% of the desirable weight for their height (according to the Metropol-itan Life Insurance Table), and in excellent health according to medical and psychiatric evaluations and a laboratory screen. No subject used alcohol or other drugs of abuse during the study, and urine drug screens were routinely performed. Time in bed was meticulously controlled, with subjects in bed from 11:30PMto 7:00AMon each recording night and for the 3 nights at home that preceded the laboratory recordings. Daytime naps were prohib-ited. The protocol required 2 nights of polygraphic screening to rule out apnea and myoclonus and to establish that subjects had normal sleep latencies (SLs), total sleep time (TST), and stages 3– 4 sleep. Criteria for acceptance were SL mean for 2 nights,
20 min, TST mean for 2 nights of at least 400 min out of the 450-min recording period, and combined stages 3– 4 $ 15% TST.
Recording and Calibration
The C3-A2 EEG was recorded continuously with a Grass (Quincy, MA) Model 78 polygraph. A half-amplitude low-frequency filter was set at 0.3 Hz, and a high low-frequency filter at 0.1 kHz. The preamplifier output was digitized at 200 Hz. The digitized values were saved to optical disk and analyzed with PASS PLUS (Delta Software, St. Louis). Of particular impor-tance for quantitative EEG studies is careful calibration. PASS PLUS analyzed a calibrated 3.5-Hz, 200-mV peak-to-peak sine wave before each night’s recording and scaled the PAA and PSA measurements on each channel to this standard.
Analyses of Sleep EEG
Visual scoring was performed on the ink-written record as required by the research protocol. The scoring was done on 30-sec epochs without knowledge of drug condition (“blind”) by two raters, with discrepancies resolved by a third rater. Re-chtschaffen and Kales (1968) criteria for sleep stages were applied. Movement and other artifacts were also scored. Corre-spondence between the visual scoring of the ink-written record and the computer measures was accomplished with a computer-generated time code written on the polygraph record every 10 sec by the digital-to-analog converter (with PASS PLUS on-screen scoring, this correspondence is automatic). The computer data reported below are based on all visually categorized, artifact-free epochs of NREM scored as stages 2– 4 on each baseline (placebo) night. There were, on average, 598 NREM (stages 2– 4) epochs per night.
Computer Analyses
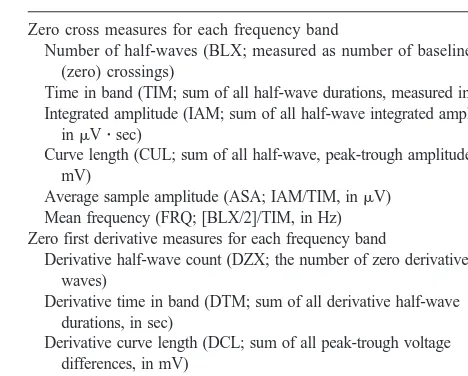
PAA WITH PASS PLUS. Two methods of detection and measurement are simultaneously applied by PASS PLUS period analysis: half-wave detection by successive crossings of zero voltage and by successive zero first derivative points. Zero cross (also called baseline crossing) analysis is more effective for slow frequencies. Zero derivative analysis is more suitable for fast EEG waves, which are often superimposed on slower activity and do not cross zero voltage. The algorithms for both PAA methods have been published, along with initial data on their reliability and the reproducibility of the absolute values obtained in similar groups (Feinberg et al 1978, 1980). Linear interpola-tion has been incorporated in PASS PLUS PAA algorithms since their inception. Such interpolation greatly improves resolution of wave periods (frequencies) without the processing and storage costs of high sample rates (“oversampling,” J.D. March, unpub-lished manuscript). Both the zero cross and the zero derivative PAA yield separate estimates for wave number, period, and amplitude. From these, several biologically meaningful ratios (e.g. amplitude/half-wave, mean frequency) can be computed. Since most laboratories that use PAA apply only zero cross algorithms, we report here the internight reliability data for zero cross measures for sigma and beta as well as for delta. (Normally our laboratory uses zero cross measures for delta and zero derivative measures for all higher frequencies, including sigma and beta.) The specific PAA measures and their definitions are shown in Table 1 (for details, see Feinberg et al 1978).
PSA WITH PASS PLUS. Fast-Fourier transform was per-formed on 30-sec epochs of 5.120-sec Welch tapered windows with 2.620-sec overlap. This yielded 12 windows per 30-sec epoch. The bands used in the analyses here were 0.3–3 Hz for delta, 12–15 Hz for sigma, and 15–23 Hz for beta. (The actual frequency bands differ slightly from these nominal values: delta is 0.29 –3.03; sigma is 12.01–14.94, and beta is 14.94 –22.95).
Fast-Fourier transform analysis yielded the classical measure of power inmV2
zsec for each frequency band.
Table 1. Period Amplitude Analysis Measures and Their Definitions
Zero cross measures for each frequency band
Number of half-waves (BLX; measured as number of baseline (zero) crossings)
Time in band (TIM; sum of all half-wave durations, measured in sec) Integrated amplitude (IAM; sum of all half-wave integrated amplitudes,
inmVzsec)
Curve length (CUL; sum of all half-wave, peak-trough amplitudes, in mV)
Average sample amplitude (ASA; IAM/TIM, inmV) Mean frequency (FRQ; [BLX/2]/TIM, in Hz) Zero first derivative measures for each frequency band
Derivative wave count (DZX; the number of zero derivative half-waves)
Derivative time in band (DTM; sum of all derivative half-wave durations, in sec)
Derivative curve length (DCL; sum of all peak-trough voltage differences, in mV)
Derivative frequency (DFQ; [DZX/2]/DTM, in Hz)
Internight Reliability of Sleep EEG BIOL PSYCHIATRY 1011
Results
Table 2 lists the group means and SEs for each night for each computer measure. These means were remarkably stable, being virtually identical on each of the 5 nights for both PAA and PSA measures; however, stability of group means across nights can mask large individual variations because subjects whose values are higher on one night could be offset by subjects whose values vary in the opposite direction. Table 3, which presents the average within-subject difference across successive nights, shows that this did not occur. Night–to-night individual differ-ences for each measure were quite small. There was no trend for mean internight differences per subject to in-crease or dein-crease across the 5 consecutive baseline nights.
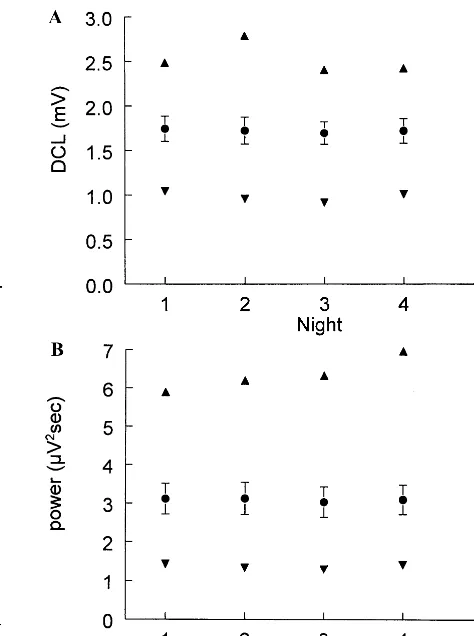
Figures 1 and 2 plot the values across 5 baseline nights for PAA integrated amplitude and FFT power in the delta and sigma bands for the subjects with the highest and lowest 5-night means. These subjects were chosen because they might be expected to show the greatest variation because of the tendency toward regression to the mean. In fact, the values for even these extreme subjects were quite stable across the 5 nights.
As would be expected from the remarkable stability of the group means and the small within-subject differences across nights, the reliability of these computer-measured EEG frequencies as estimated by Pearson correlation coefficients was quite high. These data are shown in Table 4, which presents the correlation coefficients for each measure across successive nights for delta, sigma, and beta computed for the average 30-sec epoch of NREM sleep. The five zero cross measures of delta showed consistently high internight correlations. There was no tendency for their correlation coefficients to increase or decrease across successive nights. Delta power with PSA showed a median internight correlation of .857, quite close to the .880 for delta integrated amplitude, the similar PAA measure.
Table 4 shows the internight reliability for sigma. Although our laboratory uses zero derivative PAA mea-sures for sigma, we also present the zero cross results, since most laboratories that use PAA apply only zero cross measurement. With the exception of derivative mean frequency, which had low and statistically insignificant correlations, both the zero cross and the zero derivative measures for sigma showed high internight correlations. The correlations for sigma FFT power, although not significantly greater than those for the corresponding PAA measures, were notably high, with a median of .977 and a narrow range of .965–.985.
Table 4 also shows that internight correlations for PAA measures of NREM beta EEG were also substantial. Somewhat surprisingly, the reliability for the beta zero
cross measures was about equal to that of the zero derivative measures. The median correlation of .706 for beta power with PSA was somewhat lower than its PAA equivalent (.822), although this difference was not statis-tically significant.
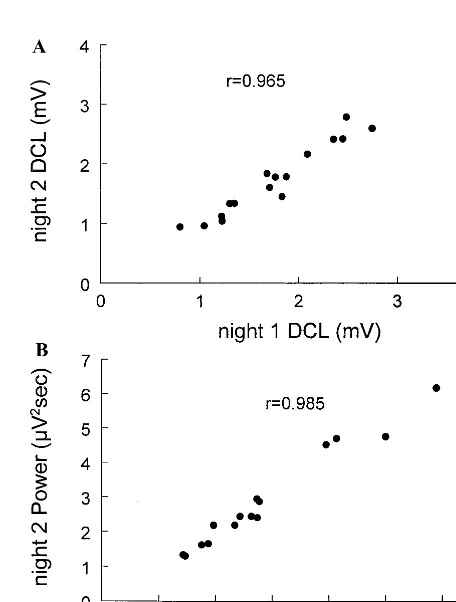
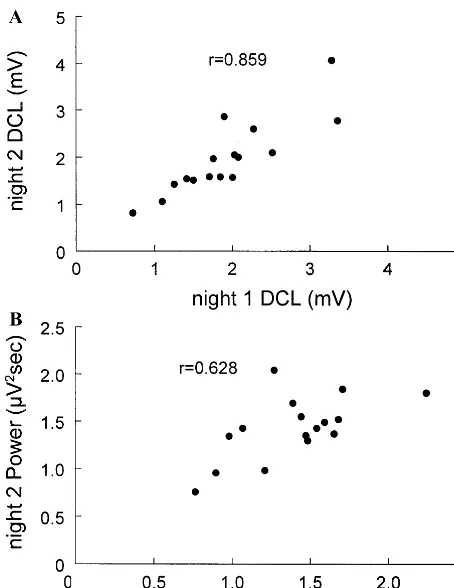
Figures 3–5 present night 1–night 2 scattergrams for integrated amplitude (PAA zero cross) and FFT power for delta, and derivative curve length (PAA zero first deriva-tive) and FFT power for sigma and beta bands. Nights 1 and 2 were chosen a priori because they might be expected to have the poorest correlations because of readaptation effects, and thereby more strongly challenge the reliability of the computer measures. Figures 3–5 demonstrate strong linear relationships and also show that the correlation coefficients do not depend upon outlying points. We also plotted scattergrams for all other correla-tions, and none depended upon outlying points. However, a markedly aberrant point dominated the night 1–night 2 correlation for derivative mean frequency, reducing its correlation coefficient to near zero (Table 4). With this point removed, the correlation increased from 2.093 to .787.
In designing sleep experiments, one important decision is the number of baseline nights to record. We assumed that, for most experiments, the largest practical number would be 5. We therefore tested the number of baseline nights required to obtain high correlations with the 5-night mean. These results are shown in Table 5. For delta and sigma FFT power and their PAA equivalents, any single night, including the first, provided a high correlation with the 5-night mean that was not appreciably increased by adding additional nights. For PAA measures of amplitude, incidence, and period, 2 baseline nights appeared to improve the correlation. Beta waveform measures ap-peared to require 2–3 nights for adequate correlations with the 5-night mean with both PSA and PAA.
Discussion
There are few published studies to which we can compare our findings. The most extensive previous reliability analyses of PAA zero cross measures were reported when we described the PAA algorithms (Feinberg et al 1978, 1980). In the first study, correlation coefficients for delta zero cross measures across 2 baseline nights for the average 20-sec epoch of NREM were high, ranging from a low of .86 to a high of .91 (N520). It was presumably this high reliability that allowed us to detect significant correlations of delta measures with age, even within the narrow range of 18 –23 years. In the second study, the first four cycles of an extended night and a recovery night were compared for zero cross measures up to 23 Hz. Despite the fact that correlations were computed across different
1012 BIOL PSYCHIATRY X. Tan et al
Table 2. Means (SEs) for Each of 5 Consecutive Baseline (Placebo) Nights for Period Amplitude Analysis (PAA) Zero Cross and Zero Derivative Measures and Fast-Fourier Transform (FFT) Power
BLX TIM IAM CUL ASA FRQ POW DZX DTM DCL DFQ
Delta (0.3–3 Hz)
N1 49.5 (1.0) 14.8 (0.40) 343 (18.1) 6.96 (0.27) 23.1 (0.85) 1.68 (0.02) 156 (13.9) N2 49.8 (1.1) 14.9 (0.40) 349 (17.5) 7.25 (0.28) 23.3 (0.83) 1.67 (0.02) 160 (13.4) N3 50.5 (0.9) 15.2 (0.35) 352 (19.2) 7.23 (0.34) 23.1 (0.95) 1.67 (0.02) 162 (15.7) N4 50.5 (1.3) 15.1 (0.46) 355 (15.9) 7.33 (0.26) 23.6 (0.74) 1.68 (0.02) 165 (12.3) N5 50.2 (1.1) 15.0 (0.39) 349 (15.5) 7.23 (0.28) 23.2 (0.75) 1.68 (0.02) 159 (11.8)
Sigma (12–15 Hz)
N1 27.9 (1.53) 1.04 (0.06) 6.63 (0.55) 0.65 (0.05) 6.27 (0.26) 13.43 (0.01) 3.11 (0.40) 82.7 (4.25) 3.12 (0.16) 1.74 (0.80) 13.24 (0.03) N2 27.6 (1.56) 1.03 (0.06) 6.69 (0.58) 0.67 (0.06) 6.37 (0.29) 13.44 (0.01) 3.13 (0.42) 80.6 (4.47) 3.04 (0.17) 1.72 (0.94) 13.26 (0.02) N3 26.9 (1.37) 1.00 (0.05) 6.39 (0.51) 0.64 (0.05) 6.27 (0.26) 13.43 (0.01) 3.04 (0.40) 80.4 (3.77) 3.04 (0.14) 1.69 (0.91) 13.23 (0.04) N4 27.3 (1.51) 1.01 (0.06) 6.55 (0.59) 0.66 (0.07) 6.30 (0.29) 13.45 (0.01) 3.11 (0.38) 80.2 (4.07) 3.01 (0.15) 1.72 (0.89) 13.30 (0.02) N5 27.3 (1.47) 1.02 (0.06) 6.47 (0.53) 0.64 (0.05) 6.25 (0.27) 13.44 (0.01) 3.12 (0.37) 81.4 (4.23) 3.07 (0.16) 1.72 (0.96) 13.26 (0.03)
Beta (15–23 Hz)
N1 47.1 (2.61) 1.27 (0.07) 6.13 (0.51) 0.82 (0.08) 4.74 (0.19) 18.47 (0.02) 1.40 (0.09) 122 (8.75) 3.31 (0.23) 1.92 (0.72) 18.5 (0.07) N2 46.5 (2.57) 1.26 (0.07) 6.17 (0.56) 0.83 (0.09) 4.79 (0.21) 18.47 (0.02) 1.43 (0.08) 123 (8.06) 3.33 (0.22) 1.97 (0.81) 18.4 (0.05) N3 45.5 (2.05) 1.23 (0.06) 5.87 (0.42) 0.79 (0.06) 4.70 (0.20) 18.46 (0.03) 1.37 (0.11) 123 (5.78) 3.32 (0.16) 1.91 (0.96) 18.5 (0.07) N4 45.7 (2.76) 1.24 (0.08) 6.03 (0.64) 0.81 (0.10) 4.73 (0.23) 18.46 (0.03) 1.43 (0.12) 125 (9.25) 3.41 (0.25) 2.01 (0.77) 18.3 (0.05) N5 46.1 (2.25) 1.25 (0.06) 5.91 (0.44) 0.79 (0.06) 4.66 (0.20) 18.46 (0.03) 1.40 (0.11) 126 (8.66) 3.43 (0.24) 1.97 (0.96) 18.4 (0.06)
All values are for the average artifact-free 30-sec epoch of non–rapid eye movement stages 2– 4 sleep. N516. PAA zero cross measures: BLX, no. of half-waves; TIM, time (sec) occupied by waves in frequency band; IAM, integrated amplitude (mVzsec) in frequency band; CUL, peak-trough amplitude (mV) of waves in frequency band; ASA, average sample amplitude (mV) of waves in frequency band; FRQ, mean frequency (Hz). POW, FFT-measured power (mV2
zsec). PAA zero derivative measures: DZX, half-waves; DTM, time; DCL, curve length; DFQ, mean frequency. Units are the same as those of zero cross measures.
Internight
Reliability
of
Sleep
EEG
1013
BIOL
PSYCHIATRY
2000;48:1010
Table 3. Means (SEs) of Individual Differences across Successive Nights for Period Amplitude Analysis (PAA) Zero Cross and Zero Derivative Measures and Fast-Fourier Transform (FFT) Power
BLX TIM IAM CUL ASA FRQ POW DZX DTM DCL DFQ
Delta (0.3–3 Hz)
N1–N2 1.15 (0.21) 0.49 (0.09) 24.4 (4.97) 0.57 (0.11) 1.23 (0.23) 0.03 (0.01) 20.9 (3.94) N2–N3 1.48 (0.31) 0.64 (0.14) 27.9 (4.99) 0.77 (0.14) 1.58 (0.25) 0.03 (0.01) 20.0 (4.31) N3–N4 1.95 (0.49) 0.71 (0.19) 34.1 (5.85) 0.81 (0.14) 1.94 (0.33) 0.03 (0.01) 25.4 (6.15) N4 –N5 1.62 (0.49) 0.61 (0.16) 25.6 (4.93) 0.40 (0.07) 1.32 (0.20) 0.03 (0.01) 22.4 (4.33) Mean of 5 nights 50.1 (0.99) 15.0 (0.38) 350.0 (16.5) 7.20 (0.26) 23.3 (0.78) 1.68 (0.02) 160.0 (12.8)
Sigma (12–15 Hz)
N1–N2 1.83 (0.52) 0.07 (0.02) 0.69 (0.18) 0.08 (0.02) 0.40 (0.08) 0.02 (0.01) 0.23 (0.04) 5.05 (1.53) 0.20 (0.06) 0.12 (0.03) 0.07 (0.03) N2–N3 1.72 (0.31) 0.06 (0.01) 0.64 (0.16) 0.08 (0.02) 0.43 (0.09) 0.02 (0.01) 0.27 (0.04) 6.03 (1.26) 0.23 (0.05) 0.19 (0.04) 0.09 (0.03) N3–N4 2.00 (0.50) 0.07 (0.02) 0.67 (0.23) 0.08 (0.03) 0.36 (0.09) 0.03 (0.01) 0.30 (0.06) 6.32 (1.22) 0.24 (0.05) 0.20 (0.04) 0.12 (0.03) N4 –N5 1.51 (0.39) 0.06 (0.01) 0.61 (0.20) 0.08 (0.03) 0.35 (0.09) 0.02 (0.01) 0.31 (0.06) 3.12 (0.58) 0.12 (0.02) 0.11 (0.02) 0.08 (0.02) Mean of 5 nights 27.3 (1.42) 1.02 (0.05) 6.55 (0.05) 0.65 (0.53) 6.29 (0.26) 13.4 (0.01) 3.10 (0.39) 81.0 (3.93) 3.06 (0.15) 1.72 (0.13) 13.3 (0.02)
Beta (15–23 Hz)
N1–N2 2.63 (0.60) 0.07 (0.02) 0.87 (0.21) 0.14 (0.04) 0.46 (0.10) 0.03 (0.01) 0.21 (0.06) 10.5 (2.77) 0.27 (0.08) 0.29 (0.07) 0.13 (0.04) N2–N3 2.82 (0.66) 0.08 (0.02) 0.87 (0.22) 0.15 (0.03) 0.49 (0.10) 0.03 (0.01) 0.29 (0.07) 18.1 (4.17) 0.47 (0.11) 0.40 (0.09) 0.15 (0.04) N3–N4 3.13 (1.06) 0.09 (0.03) 0.81 (0.30) 0.12 (0.05) 0.30 (0.08) 0.04 (0.01) 0.18 (0.06) 19.8 (4.51) 0.52 (0.12) 0.41 (0.11) 0.18 (0.06) N4 –N5 3.25 (0.97) 0.09 (0.03) 0.77 (0.29) 0.13 (0.05) 0.29 (0.08) 0.02 (0.01) 0.19 (0.05) 11.1 (2.59) 0.29 (0.07) 0.26 (0.09) 0.15 (0.04) Mean of 5 nights 46.2 (2.34) 1.25 (0.06) 6.02 (0.48) 0.81 (0.07) 4.72 (0.19) 18.5 (0.03) 1.41 (0.09) 124.0 (7.33) 3.36 (0.20) 1.96 (0.17) 18.4 (0.05)
All values are for the average artifact-free 30-sec epoch of non–rapid eye movement stages 2– 4 sleep. N516. PAA zero cross measures: BLX, no. of half-waves; TIM, time (sec) occupied by waves in frequency band; IAM, integrated amplitude (mVzsec) in frequency band; CUL, peak-trough amplitude (mV) of waves in frequency band; ASA, average sample amplitude (mV) of waves in frequency band; FRQ, mean frequency (Hz). POW, FFT-measured power (mV2
zsec). PAA zero derivative measures: DZX, half-waves; DTM, time; DCL, curve length; DFQ, mean frequency. Units are the same as those of zero cross measures.
1014
X.
Tan
et
al
BIOL
PSYCHIATRY
2000;48:1010
experimental conditions, the reliability coefficients were high and similar to those found here for the same mea-sures. In addition, these two studies demonstrated excel-lent reproducibility of the absolute delta values. We have been unable to find a systematic study of the reliability of FFT-measured sleep EEG; however, there are two studies that indirectly point to high reliability of NREM delta power. Larsen et al (1995) reported high reliability across 2 nights for computer-scored stage 4. Since these scores were based on FFT-measured delta (0.5– 4 Hz), they indicate that the computer measurements were themselves reliable across the 2 nights. Preud’homme and coworkers (1997) demonstrated that the decline in NREM delta (0.5–3 Hz) power across NREM periods on three succes-sive baseline nights was highly stable with both linear and exponential regressions. These observations suggest (but do not establish) that FFT power in each NREM period was also stable across these nights.
An unexpected result in Table 4 was that internight correlation coefficients for zero cross measures of sigma
and beta were about as high as those for the zero derivative measures. This result was unexpected because, as noted above, one would expect zero derivative analysis to estimate fast EEG more efficiently than zero cross meth-ods because these faster waves are frequently superim-posed on slower EEG. This result may be encouraging to those who use only zero cross PAA. It was also surprising that the zero cross correlations for mean frequency in both sigma and beta were consistently higher than the zero derivative correlations. The basis for this difference is not immediately obvious.
Mean frequency correlations were generally substan-tially lower than those for amplitude. This may be due to the fact that the average nightly difference per subject in mean frequency was extremely small (Table 3). By this measure, mean frequency measured within subjects was remarkably stable. We suggest that the internight correla-tions were relatively low because the extremely narrow spread of the frequency data allowed measurement error to exert a proportionately greater effect on subjects’ rank-Figure 1. (A) Mean6SE delta integrated amplitude (IAM) with
period amplitude analysis for each of 5 baseline nights. Also shown are the delta IAM for the subject (S 4) with the highest IAM and the subject (S 12) with the lowest IAM. (B) Delta fast-Fourier transform power in the same format as for IAM.●, mean;Œ, S 4;, S 12.
Figure 2. (A) Mean6SE sigma derivative curve length (DCL) with period amplitude analysis for each of 5 baseline nights. Also shown are the sigma DCL for the subject (S 14) with the highest DCL and the subject (S 12) with the lowest DCL.●, mean;Œ, S 14;, S 12. (B) Sigma fast-Fourier transform power in the same format as for DCL.●, mean;Œ, S 13;, S 1.
Internight Reliability of Sleep EEG BIOL PSYCHIATRY 1015
Figure 3. Scattergram for night 2 vs. night 1 values of delta (A) integrated amplitude (IAM) and (B) power. The high correlations do not depend on outlying points.
Figure 4. Scattergram for night 2 vs. night 1 values of sigma (A) derivative curve length (DCL) and (B) power. The high correla-tions do not depend on outlying points.
Table 4. Product Moment Correlations across Successive Baseline nights for Period Amplitude Analysis (PAA) Zero Cross and Zero Derivative Measures and Fast-Fourier Transform (FFT) Power
BLX TIM IAM CUL ASA FRQ POW DZX DTM DCL DFQ
Delta (0.3–3 Hz)
N1 vs. N2 .941 .930 .903 .826 .893 .890 .884 N2 vs. N3 .902 .861 .891 .712 .869 .834 .905 N3 vs. N4 .844 .826 .837 .669 .788 .828 .821 N4 vs. N5 .863 .878 .869 .902 .868 .889 .829 Median .883 .870 .880 .769 .869 .862 .857 Sigma (12–15 Hz)
N1 vs. N2 .898 .900 .904 .855 .897 .443 .985 .902 .892 .965 2.093a
N2 vs. N3 .947 .949 .933 .902 .875 .733 .982 .895 .891 .912 .485 N3 vs. N4 .883 .886 .877 .847 .899 .658 .971 .868 .861 .888 .342 N4 vs. N5 .932 .933 .905 .860 .905 .851 .965 .976 .975 .966 .488 Median .915 .917 .905 .858 .898 .696 .977 .899 .892 .939 .414 Beta (15–23 Hz)
N1 vs. N2 .941 .943 .837 .820 .711 .824 .628 .896 .887 .859 .651 N2 vs. N3 .940 .941 .844 .823 .698 .919 .484 .634 .664 .731 .650 N3 vs. N4 .888 .888 .846 .849 .876 .937 .784 .680 .713 .784 .458 N4 vs. N5 .889 .892 .859 .865 .891 .973 .815 .910 .920 .883 .546 Median .915 .917 .845 .836 .794 .928 .706 .788 .800 .822 .598
All values are for the average artifact-free 30-sec epoch of non–rapid eye movement stages 2– 4 sleep. N516; r5.482, p,.05; r5.606, p,.01. PAA zero cross measures: BLX, no. of half-waves; TIM, time (sec) occupied by waves in frequency band; IAM, integrated amplitude (mVzsec) in frequency band; CUL, peak-trough
amplitude (mV) of waves in frequency band; ASA, average sample amplitude (mV) of waves in frequency band; FRQ, mean frequency (Hz). POW, FFT-measured power
(mV2
zsec). PAA zero derivative measures: DZX, half-waves; DTM, time; DCL, curve length; DFQ, mean frequency. Units are the same as those of zero cross measures. aLow correlation due to single outlying point; with this point removed, r5.787.
1016 BIOL PSYCHIATRY X. Tan et al
ings. This could lower the correlation coefficients, even though the absolute values were quite close, as shown in Table 3.
The overall internight reliability of delta and sigma measures (apart from sigma mean frequency) is remark-ably high. Although beta also shows highly significant internight reliability, its internight correlation coefficients are consistently lower than those of delta and sigma. This difference holds for both PAA and PSA measures. It is not immediately obvious whether the somewhat lower corre-lations for beta are due to greater biological variability or greater measurement error for this frequency band. This result may also have been influenced by the fact that the beta band employed was much wider (9 Hz) than those of delta (2.7 Hz) and sigma (4 Hz).
With respect to the practical question of the number of nights required to establish an adequate experimental baseline for the different frequency bands, our data indi-cate that for delta and sigma power and their PAA equivalents a single night provides a sufficiently high correlation with the 5-night mean for most studies. For other PAA measures of amplitude and incidence in delta and sigma, 2 nights improve the correlation with the 5-night mean. For both PAA and PSA measures of beta, 2 baseline nights appear to be required and sufficient.
It has long been obvious that there are wide and consistent individual differences in the amplitude of hu-man EEGs. Factors that might produce these differences include variations in skull impedance, volume conduction, and brain size. These differences raise the question of whether the high reliabilities of delta, sigma, and beta power are wholly determined by individual differences in amplitude. Period amplitude analysis but not PSA can address this question. Period amplitude analysis demon-strates that wave incidence and period, as well as wave Figure 5. Scattergram for night 2 vs. night 1 values of beta (A)
derivative curve length (DCL) and (B) power. The high correla-tions do not depend on outlying points.
Table 5. Correlations with the 5-Night Mean for Night 1, the Means of Nights 1 and 2, the Means of Nights 1–3, etc. for Period Amplitude Analysis (PAA) Zero Cross and Zero Derivative Measures and Fast-Fourier Transform (FFT) Power
BLX TIM IAM CUL ASA FRQ POW DZX DTM DCL DFQ
Delta (0.3–3 Hz)
N1 vs. mean .952 .946 .976 .913 .957 .938 .975 Ave (N11N2) vs. mean .972 .972 .986 .955 .982 .968 .989 Ave (N11N21N3) vs. mean .981 .985 .992 .982 .993 .991 .992 Ave (N11N21N31N4) vs. mean .994 .995 .997 .996 .998 .998 .997 Sigma (12–15 Hz)
N1 vs. mean .927 .928 .925 .880 .938 .414 .985 .888 .880 .953 .414 Ave (N11N2) vs. mean .978 .979 .975 .964 .971 .838 .992 .962 .960 .977 .838 Ave (N11N21N3) vs. mean .986 .986 .987 .982 .991 .983 .997 .984 .983 .990 .938 Ave (N11N21N31N4) vs. mean .998 .998 .998 .997 .998 .979 1.000 .997 .997 .998 .979 Beta (15–23 Hz)
N1 vs. mean .945 .945 .855 .835 .828 .824 .801 .861 .851 .870 .824 Ave (N11N2) vs. mean .978 .978 .952 .942 .918 .925 .877 .939 .937 .955 .925 Ave (N11N21N3) vs. mean .987 .987 .981 .977 .980 .973 .979 .976 .976 .984 .973 Ave (N11N21N31N4) vs. mean .997 .997 .996 .996 .996 .986 .993 .993 .993 .995 .986
All values are for the average artifact-free 30-sec epoch of non–rapid eye movement stages 2– 4 sleep. N516; r5.482, p,.05; r5.606, p,.01. PAA zero cross measures: BLX, no. of half-waves; TIM, time (sec) occupied by waves in frequency band; IAM, integrated amplitude (mVzsec) in frequency band; CUL, peak-trough
amplitude (mV) of waves in frequency band; ASA, average sample amplitude (mV) of waves in frequency band; FRQ, mean frequency (Hz). POW, FFT-measured power
(mV2
zsec). PAA zero derivative measures: DZX, half-waves; DTM, time; DCL, curve length; DFQ, mean frequency. Units are the same as those of zero cross measures.
Internight Reliability of Sleep EEG BIOL PSYCHIATRY 1017
amplitudes, are highly reliable in the three frequency bands.
In a discussion of PAA versus PSA, Reynolds and Brunner (1995) stated: “If wave amplitude and incidence of EEG frequencies are expected to be differently affected by mental illness or external perturbation (challenges) PAA should be used.” But this begs the question of how one could know in advance whether to expect differential effects. Thus far, PAA has shown differential effects on human sleep EEG of age (Feinberg et al 1981, 1990), hypnotics (Feinberg et al 1979), naps (Feinberg et al 1985, 1992), and sleep deprivation (Feinberg et al 1987). In rats, differential effects on EEG amplitude and incidence are produced by sleep deprivation (Feinberg and Campbell 1993b), ambient light (Campbell and Feinberg 1993), and N-methyl-D-aspartate receptor blockade (Feinberg and Campbell 1993a). These observations indicate that PAA should be included in any study where the differential effects on the incidence and amplitude of EEG waves that alter spectral power might be theoretically or clinically important. The recent demonstration by Uchida et al (1999) that the PAA zero derivative analysis gives good agreement with FFT power in the faster frequencies adds confidence to its use for measuring amplitude and inci-dence of fast EEG. It is efficient to employ software such as PASS PLUS, which simultaneously applies validated PAA methods and standard FFT analysis to the same digitized data (for an example of the value of this combination in rat sleep, see Campbell and Feinberg 1999).
The almost perfect internight correlations for FFT power in the sigma band (median r 5 .977) merit comment. Assuming that this is not a chance result, one wonders whether these correlations are so high because there are marked and stable individual differences in organized spindle activity. Uchida et al (1991) suggested that spindles in normal young adults probably dominate FFT power in the sigma band, a hypothesis verified experimentally by Dijk et al (1993). Another factor con-tributing to the high reliability of spindles might be that they are particularly well suited for PSA measurement because their waveforms more closely approximate the Fourier assumptions of sinusoidal shape and (within our ;5-sec epoch length) stationarity.
One question raised by our findings is whether the stability of the NREM delta EEG across nights is consis-tent with its postulated role as a marker of sleep homeosta-sis. According to the homeostatic model as initially formulated (Feinberg 1974), NREM delta is a correlate of a process by which the brain reverses the “neurometa-bolic” effects of plastic waking processes. The “two process” homeostatic model (Borbely 1982) makes a similar inference, although less explicitly. In this
experi-ment we did not control subjects’ daytime activities, apart from time awake; however, it was anecdotally apparent that these activities could vary considerably over the 5 days of study. At times, subjects studied intensively for examinations until just before bedtime, and on other days they relaxed and watched television. Their physical activ-ities and participation in sports also varied from day to day. Nevertheless, delta was stable across nights and internight correlations were consistently high. This finding suggests that normal variations in daytime behavior of college students have little effect on NREM delta (or sigma and beta) so long as wake time is controlled. This result is more consistent with “traitlike” than “statelike” behavior.
This work was supported by a University of California, Davis Faculty Research Award (IF); by Lorex Pharmaceuticals; by the Department of Veterans Affairs; and by U.S. Public Health Service Grants No. R01MH50741 and No. R01MH57928.
References
Aeschbach D, Dijk DJ, Borbely A (1997): Dynamics of EEG spindle frequency activity during extended sleep in humans: Relationship to slow-wave activity and time of day. Brain Res 748:131–136.
Borbely A (1982): A two-process model of sleep regulation. Hum Neurobiol 1:195–204.
Borbely AA (1998): Processes underlying sleep regulation. Horm Res 49:114 –117.
Campbell IG, Feinberg I (1993): Dissociation of delta EEG amplitude and incidence in rat NREM sleep. Brain Res Bull 30:143–147.
Campbell IG, Feinberg I (1999): Comparison of MK-801 and sleep deprivation effects on NREM, REM, and waking spectra in the rat. Sleep 22:423– 432.
Dijk DJ, Hayes B, Czeisler CA (1993): Dynamics of electroen-cephalographic sleep spindles and slow wave activity in men: effect of sleep deprivation. Brain Res 626:190 –199. Feinberg I (1974): Changes in sleep cycle patterns with age.
J Psychiatr Res 10:283–306.
Feinberg I, Campbell IG (1993a): Ketamine administration during waking increases delta EEG intensity in rat sleep. Neuropsychopharmacology 9:41– 48.
Feinberg I, Campbell IG (1993b): Total sleep deprivation in the rat transiently abolishes the delta amplitude response to darkness: Implications for the mechanism of the “negative delta rebound”. J Neurophysiol 70:2695–2699.
Feinberg I, Fein G, Floyd TC (1980): Period and amplitude analysis of NREM EEG in sleep: Repeatability of results in young adults. Electroencephalogr Clin Neurophysiol 48:212– 221.
Feinberg I, Fein G, Floyd TC, Aminoff MJ (1981): Sleep EEG waveform profiles in young and elderly normal subjects. In: Perris C, Struwe G, Jansson B, editors. Biological Psychiatry. Amsterdam: Elsevier/North-Holland, 294 –297.
1018 BIOL PSYCHIATRY X. Tan et al
Feinberg I, Fein G, Walker JM, Price L, Floyd TC, March JD (1979): Flurazepam effects on sleep EEG: Visual, computer and cycle analysis. Arch Gen Psychiatry 36:95–102. Feinberg I, Floyd TC, March JD (1987): Effects of sleep loss on
delta (0.3-3 Hz) EEG and eye movement density: New observations and hypotheses. Electroencephalogr Clin Neu-rophysiol 67:217–221.
Feinberg I, Koresko RL, Heller N (1967): EEG sleep patterns as a function of normal and pathological aging in man. J Psy-chiatr Res 5:107–144.
Feinberg I, Maloney T, Campbell IG (1995a): Effects of zolpi-dem, triazolam, and temazepam on computer-measured EEG. Sleep Res 24:43.
Feinberg I, Maloney T, Campbell IG (1995b): Period-amplitude analysis (PAA) of amplitude and incidence of NREM EEG under zopidem (Z), triazolam (Tr) and temazepam (Te) for delta (0.3-3 Hz), sigma (12-15 Hz) and beta (15-23 Hz) frequencies. Sleep Res 24A:123.
Feinberg I, Maloney T, March JD (1992): Precise conservation of NREM Period 1 (NREMP1) delta across naps and noctur-nal sleep: Implications for REM latency and NREM/REM alternation. Sleep 15:400 – 403.
Feinberg I, March JD, Fein G, Floyd TC, Walker JM, Price L (1978): Period and amplitude analysis of 0.5-3 c/sec activity in NREM sleep of young adults. Electroencephalogr Clin Neurophysiol 44:202–213.
Feinberg I, March JD, Flach K, Maloney T, Chern W-J, Travis F (1990): Maturational changes in amplitude, incidence and cyclic pattern of the 0 to 3 Hz (Delta) electroencephalogram of human sleep. Brain Dysfunction 3:183–192.
Feinberg I, March JD, Floyd TC, Jimison R, Bossom-Demitrack L, Katz PH (1985): Homeostatic changes during post-nap
sleep maintain baseline levels of delta EEG. Electroencepha-logr Clin Neurophysiol 61:134 –137.
Guazzelli M, Feinberg I, Aminoff M, Fein G, Floyd TC, Maggini C (1986): Sleep spindles in normal elderly: comparison with young adult patterns and relation to nocturnal awakening, cognitive function and brain atrophy. Electroencephalogr Clin Neurophysiol 63:526 –539.
Larsen LH, Moe KE, Vitiello MV, Prinz PN (1995): A note on the night-to-night stability of stages 31 4 sleep in healthy older adults: A comparison of visual and spectral evaluations of stages 314 sleep. Sleep 18:7–10.
Preud’homme XA, Lanquart JP, Mendlewicz J, Linkowski P (1997): Distribution of delta activity across nonrapid eye movement sleep episodes in healthy young men. Sleep 20:313–320.
Rechtschaffen A, Kales A (1968): A Manual of Standardized Terminology, Techniques and Scoring Systems for Sleep Stages of Human Subjects. Washington, DC: U.S.Govern-ment Printing Office.
Reynolds CF 3rd, Brunner D (1995): Sleep microarchitecture in depression: Commentary. Biol Psychiatry 37:71.
Uchida S, Feinberg I, March JD, Atsumi Y, Maloney T (1999): A comparison of period amplitude analysis and FFT power spectral analysis of all-night human sleep EEG. Physiol Behav 67:121–131.
Uchida S, Maloney T, March JD, Azari R, Feinberg I (1991): Sigma (12-15 Hz) and delta (.3-3 Hz) EEG oscillate recipro-cally within NREM sleep. Brain Res Bull 27:93–96. Williams RL, Karacan I, Hursch CJ (1974):
Electroencephalog-raphy (EEG) of Human Sleep: Clinical Applications. New York: Wiley.
Internight Reliability of Sleep EEG BIOL PSYCHIATRY 1019