IMPROVED CLASSIFICATION OF MANGROVES HEALTH STATUS USING
HYPERSPECTRAL REMOTE SENSING DATA
R. Vidhya, D. Vijayasekaran*, M. Ahamed Farook, S.Jai, M. Rohini, A. Sinduja
Institute of Remote Sensing, Anna University, Chennai-600025 [email protected]
Commission VI, WG VI/4
KEY WORDS: Mangroves health, Hyperspectral, Band reduction, Soil adjusted vegetative indices, classification
ABSTRACT:
Mangrove ecosystem plays a crucial role in costal conservation and provides livelihood supports to humans. It is seriously affected by the various climatic and anthropogenic induced changes. The continuous monitoring is imperative to protect this fragile ecosystem. In this study, the mangrove area and health status has been extracted from Hyperspectral remote sensing data (EO-1Hyperion) using support vector machine classification (SVM). The principal component transformation (PCT) technique is used to perform the band reduction in Hyperspectral data. The soil adjusted vegetation Indices (SAVI) were used as additional parameters. The mangroves are classified into three classes degraded, healthy and sparse. The SVM classification is generated overall accuracy of 73% and kappa of 0.62. The classification results were compared with the results of spectral angle mapper classification (SAM). The SAVI also included in SVM classification and the accuracy found to be improved to 82%. The sparse and degraded mangrove classes were well separated. The results indicate that the mapping of mangrove health is accurate when the machine learning classifier like SVM combined with different indices derived from hyperspectral remote sensing data.
1. INTRODUCTION
Mangroves are the most productive ecosystem in the world. Which thrive on the transition zone between ocean and land area. They are habitat for many invertebrates, fish, amphibians, reptiles, birdsmany marine animals. These vital trees are found in 123 countries around globe and total cover about 152,000 square kilometres (Spalding, 2010). Mangroves are severely threatened by anthropogenic activities like timber extraction, illegal land reclamation, over fishing and solid waste dumping etc. Also, climatic factors like elevated CO2 levels are highly influence the growth and health of mangrove ecosystem. The infield quantification and monitoring of the mangrove area and health is involved in high cost of time and resources. The remote sensing technology will provide the data on different timestamps will be very useful in monitoring of mangrove health and area estimation. There are many researchers used remote sensing satellite imagery to map, monitor and quantify the mangrove ecosystem (Green et al. 1998, Sulong et al. 2002, Wang et al 2004). The accuracy of mapping the mangrove vegetation and health status is increased by the use of hyperspectral remote sensing image (Adam et al. 2009, Kuenzer et al. 2011). The limitations of hyperspectral remote sensing data are availability, small area coverage and high cost. The data is mainly collected using airborne sensors like AISA+, CASI, Hymap, AVIRS, Dedalus and one space borne sensor EO-1 Hyperion (Kuenzer et al. 2011). The high dimensionality of hyperspectral image creates difficulty in information extraction. The transformation from high dimensional space to low dimension space and without losing vital information is known as overcoming curse of dimensionality (Scott, 2008). The techniques involved in dimensionality reduction and feature extraction from hyperspectral image includes orthogonal subspace projection, which is used to produce the new sequence of image with signature of interest and the signal analysis technique like discrete wavelet transform is used for feature extraction (Harsanyi et al. 1994, Bruce et al. 2002). The most widely used dimensionality reduction method is the principal
components transform (PCT). It is applying the linear transformation that maximizes the data variance by transforming the image data to new subspace. The PCT is used to reconstruction of hyperspectral data and the transformed image is used for classification and target deduction (Jia and Richards, 1999, Farrell and Mersereau, 2005). In recent years, the support vector machine (SVM) classification is adequately used to classify the hyperspectral data (Merciar and Lennon, 2003, Melgani and Bruzzone, 2004, Camps-Valls and Bruzzone, 2005). The soil adjusted vegetation indices (SAVI) is developed by (Huete, 1988). In SAVI the soil adjustment factor is used to minimize the secondary backscattering effect of canopy-transmitted soil background reflected radiation. The inclusion of vegetation indices and textural parameters will increase the accuracy of land use /land cover classification and individual species mapping (Saha et al. 2001, Wang and Zhang, 2014). The present study focused to improve the accuracy of mapping mangrove health status. The PCT is used to reduce the high dimensionality of hyperspectral image. The SVM classification is applied on image spectra and including SAVI, normalized difference water index (NDWI) transformed image for classify the mangrove health. The classification accuracy of SVM is compared with conventional spectral angle mapper (SAM) classifier.
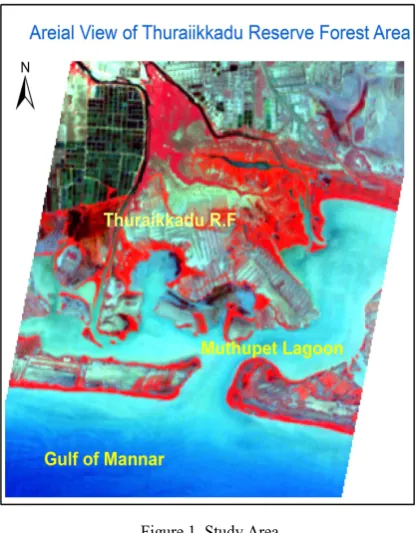
2. STUDY AREA AND SATELLITE DATA The Thuraikkadu Reserve forest area is situated at Tiruvarur District, Tamil Nadu. It lies between 10.4ºN and 79.5ºE. It is about 360 km away from Chennai. The mangrove forest lies adjacent to the Bay of Bengal and is in the southernmost part of the Cauvery delta. The rivers Paminiyar, Koraiyar, Kilaithankiyar, Marakkakoraiyar and other tributaries of the river Cauvery flow through Muthupet and adjacent villages. At the tail end, they form a lagoon named Muthupet, which is an ideal place for fishing, pearl hunting and bird hunting (Figure 1).
The International Archives of the Photogrammetry, Remote Sensing and Spatial Information Sciences, Volume XL-8, 2014 ISPRS Technical Commission VIII Symposium, 09 – 12 December 2014, Hyderabad, India
This contribution has been peer-reviewed.
Figure 1. Study Area
A natural mangrove forests in Thuraikkadu and Muthupet are one of the largest of its kind in India. It is located at the southern end of the Cauvery delta, covering an area of approximately 13,500 ha of which only 4% is occupied by well-grown mangroves. The government declared the Muthupet mangrove forest as revenue forest in February 1937 and, accordingly, the mangrove forest was handed over to the forest department of the Madras presidency.
2.2 Satellite data
The cloud free hyperspectral data of Hyperion sensor data from Earth Observing -1 (EO1) satellite dated 28/09/2012 is used for this particular study. The spatial resolution of the satellite image is 30m and contains 220 unique spectral channels on spectral range of 0.4µm to 2.5 µm. The signal noise ratio of the Hyperion sensor is 161(550 nm); 147(700nm); 110(1125 nm); 40(2125 nm) respectively at the digitization rate of 12 bits.
3. METHODS 3.1 Pre-processing of Satellite data
The HYPERION EO-1 Level 1R (L1R) data was downloaded from the United States Geological Survey website, for the study region. The atmospheric effect and geometrical distortions are removed in pre-processing. In this study, The ENVI software FLAASH module is used for atmospheric correction. FLAASH is a first-principles atmospheric correction tool that corrects wavelengths in the visible through near-infrared and shortwave infrared regions, up to 3 µm. Unlike many other atmospheric correction programs that interpolate radiation transfer properties from a pre-calculated database of modelling results. The geometric correction is completed using existing orthorectified imagery of the study area.
3.2 Band Reduction
Principal Component Analysis (PCA) is a statistical procedure that uses orthogonal transformation to convert a set of observations of possibly correlated variables into a set of values of linearly uncorrelated variables called principal components. The number of principal components is less than or equal to the number of original variables. This transformation is defined in such a way that the first principal component has the largest possible variance (that is, accounts for as much of the variability in the data as possible), and each succeeding component in turn has the highest variance possible under the constraint that it is orthogonal to (i.e., uncorrelated with) the preceding components. The forward PC rotation uses a linear transform to maximize the variance of the data. When we use forward PC rotation, The PCA allows us to calculate new statistics or to rotate from existing statistics. We also have the option to subset the output of the PC rotation based on eigenvalues, and to generate output of only the PC bands that you need. Here, we have reduced the bands to 7 by using forward PC rotations.
3.3 SAVI
The SAVI is an index that attempts to “subtract” the effects of background soil from NDVI so that impacts of soil wetness are reduced in the index. It is computed as:
SAVI= (1)
Where, ρ800, ρ670are reflectance at Near Infrared and Red band respectively. L is a constant for SAVI. If L is zero, SAVI becomes equal to NDVI. A value of 0.5 frequently appears in the literature for L.
3.4 Classification
The classification here was done using ENVI software. Region of interests of each class were given using the ROI tool. The classes which were considered are Healthy mangroves, degraded mangroves, sparse mangroves, backwater and others. The kernel type used was Radial Basis Function (RBF) kernel, which is the most widely used one. The SVM is a classification system derived from statistical learning theory. It separates the classes with decision surface that maximizes the margin between the classes. SVM uses the pair wise classification strategy for multiclass classification. The classification output is the decision values of each pixel for each class, which are used for probability estimates.
Figure 2. Reflectance spectra of different classes The International Archives of the Photogrammetry, Remote Sensing and Spatial Information Sciences, Volume XL-8, 2014
ISPRS Technical Commission VIII Symposium, 09 – 12 December 2014, Hyderabad, India
This contribution has been peer-reviewed.
The probability values, stored in ENVI as rule images, represent "true" probability in the sense that each probability falls in the range of 0 to 1, and the sum of these values for each pixel equals 1. ENVI performs classification by selecting the highest probability. An optional threshold allows reporting pixels with all probability values less than the threshold as unclassified.
The spectral angle mapper classification is performed to assess the accuracy of SVM classification results. Spectral Angle Mapper (SAM) is a physically-based spectral classification that uses an n-D angle to match pixels to reference spectra. The algorithm determines the spectral similarity between two spectra by calculating the angle between the spectra and treating them as vectors in a space with dimensionality equal to the number of bands. The SVM and SAM classification is applied on PC transformed 7 bands with optimal training sites.
3.5 Accuracy assessment
Validation is an important step, which gives the true assessment of the results obtained, i.e., it gives the accuracy of the classified image. The data required for validation was collected from M S Swaminathan Research Foundation website which is shown in Figure 3. The map was scanned and geo-referenced with WGS 84 datum. The sample points were given from the classified image and were validated by using the ground truth field map (Figure 3).
Figure 3. Ground truth field map from MSSRF
The stratified sampling approach is applied for selection of reference samples. The Stratified sampling is a method of sampling that involves the division of a population into smaller groups known as strata. A random sample from each stratum is taken in a number proportional to the stratum's size when compared to the population. The main advantage with stratified sampling is how it captures key population characteristics in the sample.
4. RESULTS
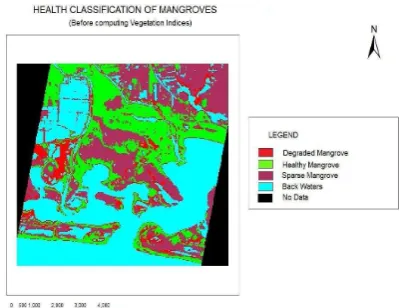
The spectral angle mapper (SAM) and SVM classifications are applied on dimensionality reduced hyperspectral data. In SAM classification the most erroneous assumption made with supposition that end members chosen to classify the image represent the pure spectra of a reference material. The spectral confusion in pixels led to underestimation and overestimation errors for a spectral class (Figure 4). The classification map generated by SVM classification are effective in high dimensional spaces, still effective in cases where number of dimensions is greater than the number of samples. It proves to be an effective method for hyperspectral data as this classifier is low sensitive to Hughes phenomenon.The classification result of Muthupet mangrove using SVM approach for dimensionally reduced data. When compared to SAM classifier, SVM classifier provided better classification results (Figure 5).
Figure 3. Health Classification of Mangroves using SAM classifier
Figure 5. Health Classification of Mangroves using SVM classifier
Figure 4. Health Classification of Mangroves using SVM including SAVI
The classification maps generated after the inclusion of soil adjusted vegetation indices (SAVI) provided better results than the previous one. The degraded and sparse mangroves were accurately classified from healthy mangroves by incorporating the indices in SVM classification. The classified result after computing the indices is shown in (Figure 6).
The stratified samples for accuracy assement in each classification image are selected from the calculated total area of different classes. The 10% of pixels we taken as stratified samples.
The International Archives of the Photogrammetry, Remote Sensing and Spatial Information Sciences, Volume XL-8, 2014 ISPRS Technical Commission VIII Symposium, 09 – 12 December 2014, Hyderabad, India
This contribution has been peer-reviewed.
Table 1. Comparison of individual accuracies for each class in the three classification methods
The Overall accuracy, producer accuracy, user accuracy and kappa statistics were calculated for each classification method. It is clearly shown that the accuracy of the SVM classified image after incorporation the vegetal index is higher than SVM and SAM classified image. The overall accuracy of SAM classified image is 70.64% and the accuracy of SVM classified image is 73.74% and this has increased to 82.60% for SVM classified image in which the vegetal index was included. The individual accuracies of the classes have also been increased.
5. CONCLUSION
The Hyperspectral remote sensing plays an important role in monitoring the diversity of species, the health status of various vegetation features and so on, which is otherwise very difficult or impossible. Thus an attempt is made in this study, which shows the effectiveness of using hyperspectral remote sensing for monitoring the health status of mangroves. Though SVM based approach was effective than SAM approach, it was found that degraded and sparse mangrove were misclassified as healthy mangrove in SVM classified image. Therefore an attempt was made to overcome this misclassification by incorporating SAVI. The results after accuracy assessment showed that the incorporation of SAVI (Soil Adjusted Vegetation Index) with the SVM classification, showed a maximum accuracy of 82.60%, over the plain SVM and SAM classification with accuracies of 73.74% and 70.64% respectively.
REFERENCES
Adam, E., Mutanga, O., & Rugege, D., 2009. Multispectral and hyperspectral remote sensing for identification and mapping of wetland vegetation: a review. Wetlands Ecology and Management, 18(3), 281–296.
Bruce, L. M., Member, S., Koger, C. H., & Li, J., 2002. Dimensionality Reduction of Hyperspectral Data Using Discrete Wavelet Transform Feature Extraction. Geoscience and Remote Sensing, IEEE Transactions 40(10), pp.2331–2338.
Camps-Valls, G., & Bruzzone, L. 2005. Kernel-based methods for hyperspectral image classification. IEEE Transactions on Geoscience and Remote Sensing, 43(6), 1351–1362.
Farrell, M.D., Mersereau, R.M.., 2005. On the impact of PCA dimension reduction for hyperspectral detection of difficult targets, Geoscience and Remote Sensing Letters, IEEE , vol. (2), 2, pp.192-195.
Green, E. P., Clark, C. D., Mumby, P. J., Edwards, A. J., & Ellis, A. C. 1998. Remote sensing techniques for mangrove mapping. International Journal of Remote Sensing, 19(5), 935– 956.
Harsanyi, J.C., Chein-I C., 1994. Hyperspectral image classification and dimensionality reduction: an orthogonal subspace projection approach, Geoscience and Remote Sensing, IEEE Transactions on , Vol. (32), 4, pp.779-785.
Huete, A. R., 1988. A soil-adjusted vegetation index (SAVI). Remote sensing of environment, 25(3), 295-309.
Jia, X., Richards, J.A., 1999. Segmented principal components transformation for efficient hyperspectral remote-sensing image display and classification. Geoscience and Remote Sensing, IEEE Transactions on, vol. (37), 1, pp.538-542.
Kuenzer, C., Bluemel, A., Gebhardt, S., Quoc, T. V., & Dech, S., 2011. Remote Sensing of Mangrove Ecosystems: A Review. Remote Sensing, Vol. (3) pp. 878–928.
Melgani, F., Bruzzone, L., 2002. Support vector machines for classification of hyperspectral remote-sensing images,
Geoscience and Remote Sensing Symposium, 2002. IGARSS '02. 2002 IEEE International , vol. (1), pp.506-508.
Mercier, G., Lennon, M., 2003. Support vector machines for hyperspectral image classification with spectral-based kernels," Geoscience and Remote Sensing Symposium, IGARSS '03. Proceedings. IEEE International , vol. (1), pp.288-290.
Saha, A. K., Arora, M. K., Csaplovics, E., & Gupta, R. P. 2005. Land cover classification using IRS LISS III image and DEM in a rugged terrain: a case study in Himalayas. Geocarto International, 20(2), 33-40.
Scott, D. W. 2008. The Curse of Dimensionality and Dimension Reduction. In Multivariate Density Estimation. John Wiley & Sons, Inc. pp. 195–217.
Sulong, I., Mohd-Lokman, H., Mohd-Tarmizi, K., & Ismail, A., 2002. Mangrove Mapping Using Landsat Imagery and Aerial Photographs: Kemaman District, Terengganu, Malaysia.
Environment, Development and Sustainability, 4(2), 135–152.
Spalding, M., Kainuma, M., Collins, L., 2010. World Atlas of Mangroves. Taylor&Francis, pp. 1.
Wang, L., Sousa, W. P., Gong, P., & Biging, G. S., 2004. Comparison of IKONOS and QuickBird images for mapping mangrove species on the Caribbean coast of Panama.
Remote Sensing of Environment, 91(3–4), 432–440.
Wang, L., & Zhang, S. 2014. Incorporation of texture information in a SVM method for classifying salt cedar in western China. Remote Sensing Letters, 5(6), 501–510.
Class SAM
The International Archives of the Photogrammetry, Remote Sensing and Spatial Information Sciences, Volume XL-8, 2014 ISPRS Technical Commission VIII Symposium, 09 – 12 December 2014, Hyderabad, India
This contribution has been peer-reviewed.