DETECTION AND QUANTIFICATION OF ROCK GLACIER CREEP
USING HIGH-RESOLUTION ORTHOIMAGES OF VIRTUAL GLOBES
V. Kaufmann
Institute of Remote Sensing and Photogrammetry
Graz University of Technology, Austria
viktor.kaufmann@tugraz.at
Working Groups IV/8 and V/6
KEY WORDS: Geomorphology, Surface, Change detection, High resolution, Matching, Environment, Climate, Visualization
ABSTRACT:
Rock glaciers are creep phenomena of mountain permafrost and are composed of ice and rocks. Active rock glaciers move downslope by force of gravity. Maximum creep/flow velocities of individual rock glaciers may vary from a few centimeters up to several meters per year, depending on the underlying terrain, mechanical parameters of the material involved, etc. Inter-annual variation of rock glacier flow has been observed and attributed to various reasons, e.g., climate change. It is believed that the observed warming of the atmosphere accelerates rock glacier flow. This paper proposes a method for detecting active rock glaciers and, where applicable, quantifying their movement relatively or absolutely using multi-temporal image data (i.e., high-resolution orthoimages/orthophotos) of virtual globes, such as Google Maps and Microsoft Bing Maps. The present work was originally triggered by the task of detecting all active rock glaciers of a larger mountain region, i.e., the western part of the Schober Mountains located in the Austrian Hohe Tauern range. In support of this task the proposed method was additionally applied to two well-studied rock glaciers, i.e., Hinteres Langtalkar (eastern part of the Schober Mountains) and Äußeres Hochebenkar (Ötztal Alps, Austria). In this paper we present the results obtained from the two rock glaciers. It can be summarized that change detection and consequently the high-precision measurement of flow velocities of active rock glaciers using image data (screen shots) of virtual globes (geobrowsers) is possible. It must be admitted, however, that the proposed method has some obvious drawbacks: (a) limited availability of high-resolution image data in high mountain areas, (b) limited availability of multi-temporal image data, (c) lack of information about exact acquisition dates or source of image data, (d) lack of information about the accuracy of the image data (orthophotos), and (e) potential legal obstacles to using the image data.
1. INTRODUCTION 1.1 Mountain Permafrost and Rock Glaciers
According to Shur et al. (2011) permafrost is ground (soil or rock and included ice and organic material) that remains at or below 0°C for at least two consecutive years, and the term “perennially cryotic ground” is synonymous with permafrost.
Permafrost must not be confused with glaciers, which belong to the hydrosphere. Permafrost can be found at high latitudes, i.e. the Arctic and Antarctic, and also in (high) mountains at low and mid-latitudes. Mountain permafrost is bound to mountainous terrain and its characteristics (Gruber & Haeberli, 2009). Active rock glaciers are the visible expression of steady-state creep of ice-supersaturated mountain permafrost bodies in unconsolidated materials. They display the whole spectrum of forms created by cohesive flows (definition by Barsch, 1996: 4). Rock glaciers look like lava flows from a bird’s eye view, and mostly exhibit tongue or lobate-shaped forms. Rock glaciers are an important system of mass transport in mountainous environments.
Mean creep/flow velocities of individual rock glaciers range from several centimeters up to several meters per year. Velocities depend on various parameters, e.g., topography, lithology, grain size distribution, ice content, hydrology, debris input, climatic factors, and change in space and time.
1.2 Impact of Climate Change
A comparative study (Delaloye et al., 2008) analyzing the mean annual flow velocity of several rock glaciers in the European Alps for the observation period 1999-2007 revealed that the surface flow velocities observed are largely synchronous, and inter-annual changes are mostly well correlated with mean annual air/ground temperature, but with a delay of several months. It is believed that atmospheric (global) warming speeds up rock glacier movement. This scientific working hypothesis is also supported by recent observations of permafrost degradation at rock glaciers, i.e., development of surface ruptures and tension cracks, landsliding, disintegration, and even complete surface collapse (cp. Roer et al., 2008 and Krysiecki, 2008). Destabilized rock glaciers due to climatic warming can cause natural hazards, such as landslides and debris flows (Kääb, 2011).
1.3 Image-based Change Detection
The kinematic state of a rock glacier can be determined using different measuring techniques as outlined in Haeberli et al. (2006). Airborne and spaceborne remote sensing techniques are preferably used in rock glacier monitoring to efficiently retrieve information about surface deformation/movement (Kääb, 2008). Multi-temporal data acquisition is a key prerequisite for any change detection. Both remote sensing techniques provide the advantage of area-wide coverage (regional to global scale), high spatial resolution, adequate accuracy, sufficient temporal
resolution, and automated information extraction. Possible solutions for the photogrammetric processing of airborne and spaceborne optical image data are outlined, e.g., in Kaufmann & Ladstädter (2002a) and Kääb (2008), which both use multi-temporal orthophotos for change detection. Furthermore, differential SAR interferometry has also been successfully applied not only to detect active rock glaciers of a larger area but also to quantify their movements (Kenyi & Kaufmann, 2003; Lambiel et al., 2008).
2. METHOD
The method developed and the examples given in this paper refer to image data of Google Maps (http://maps.google.com/) and Microsoft Bing Maps (http://www.bing.com/maps/). In 2009, the author had the task of identifying fast moving rock glaciers in the western part of the Schober Mountains, Austrian Alps, in preparation of an up-coming project. At that time, Buchenauer (1990) was the only recent literature available on rock glaciers in this area. The flow velocities of supposed active rock glaciers were not stated. Fortunately, the two geobrowsers mentioned above provide high resolution orthoimages of different acquisition times. A pre-selection of suspected fast moving rock glaciers was done using the visual method. The measuring method was applied to numerically quantify the presumed movement.
2.1 Visual Method
All rock glaciers located in the area of interest (approx. 120 km2) were checked for movement. Both geobrowsers were opened side-by-side on the computer screen. Appropriate zoom levels were selected to adjust for areal coverage (overview or details) of corresponding image parts. Since both geobrowsers use the same zoom levels, stereoscopic fusion of the bitemporal orthoimages with the naked eye can be easily facilitated by image scrolling in horizontal and vertical direction. Since the two images are assumed orthophotos, geometric differences must be due to surface change/deformation, i.e., movement. Motion parallaxes parallel to the eye base can be directly observed as “hills” or “valleys” in the virtual model. Motion parallaxes normal to the eye base hamper proper stereo fusion. Areas without any geometric changes show up as horizontal planes. In order to examine rock glaciers with a main flow direction NS or SN it is best to rotate the image data (screen shot or laser printout) accordingly for proper stereo fusion. Consequently, visible deformations (parallaxes) can also be measured and numerically quantified. For the example of the Schober Mountains the reader is referred to Kaufmann (2010).
2.2 Measuring Method
Screen shots of the areas of interest, i.e., rock glaciers subject to significant change, were used for further analysis. Ground sampling distances (GSDs) can be derived from the respective scale bars. Common zoom levels are at GSD of 20 cm, 40 cm, 80 cm, etc. Studies (details will be presented in chapters 3 and 4) carried out to investigate the geometric properties of the orthoimages used in more detail revealed that both geometries are identical and refer to the Mercator map projection. The problem of retrieval of the data acquisition dates will be addressed later in the text.
Image registration was carried out using an in-house developed Matlab-based tool box using the normalized cross-correlation
coefficient (NCC). Sub-pixel precision was obtained by parabola fitting of peak values of NCC. Back-matching enabled the detection of most of the erroneous correspondences. Removal of remaining blunders was done interactively. Debella-Gilo & Kääb (2011) is a recent review paper on the application of NCC for measuring surface displacement on mass movements. Another method of image matching could be least-squares matching (LSM) as described in Debella-Gilo & Kääb (2012). Since the screen shots (orthophotos) refer to local coordinate systems, the measured disparities need to be corrected by systematic offsets which can be determined at stable areas, i.e. areas not affected by surface movement.
The displacement vectors obtained describe the geometric differences of the two data sets. These displacements are assumed to be due to surface movement; erroneous orthophotos, however, can introduce “false” displacements, i.e., apparent movements.
Where the acquisition dates are known, displacements can be converted to velocities (m/year).
Information about the precision of the deformation measurement can be deduced from the statistics of the residual displacements of the stable points. The reliability of the result obtained over a moving rock glacier is relatively difficult to assess. Comparative data or consistency checks (flow behavior, flow direction, etc.) may help to finally validate the velocity data obtained.
3. HINTERES LANGTALKAR ROCK GLACIER 3.1 Preface
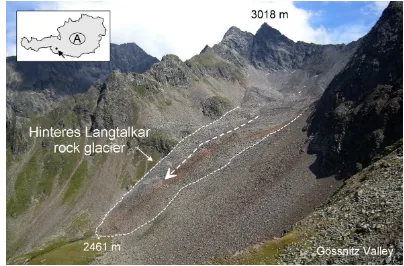
Hinteres Langtalkar rock glacier (46°59'11" N, 12°46'54" E, see Figure 1) is a fast moving, 800 m long, tongue-shaped rock glacier located in a glacially shaped cirque of the Gössnitz Valley in the eastern part of the Schober Mountains (Hohe Tauern range, Austrian Alps). Its peculiar morphodynamics has given rise to interdisciplinary research applying various observation techniques (cp. Krainer & Mostler, 2001; Avian et al., 2009; Kaufmann & Ladstädter, 2010). The kinematics of the rock glacier has been monitored using geodetic methods (annually since 1999) and aerial photogrammetry (multi-annual intervals; 1954-2006). Maximum flow velocities of up to 3 m/year were measured.
Figure 1. Terrestrial view of Hinteres Langtalkar rock glacier. The rock glacier tongue is moving over a break-in-slope into steeper terrain causing sliding of its frontal slope. Photograph taken by V. Kaufmann on 22 August 2008.
3.2 Change Detection 2002-2006
The high-resolution orthoimages of Google Maps and Microsoft Bing Maps covering Hinteres Langtalkar rock glacier date from 18 September 2002 and 21 September 2006 (see Figure 2). The original images (aerial photographs) were taken by the Austrian Federal Office of Metrology and Surveying (BEV), Vienna, and the Province of Tyrol, Innsbruck, respectively. Screen shots at 80 cm and 40 cm GSD were made. Google Maps images are watermarked and their appearance is somewhat sharper than those of Microsoft Bing Maps. Displacement vectors were computed following the procedure described in section 2.2. Image matching was carried out using grayscale images derived from the RGB data.
Figure 2. This figure shows a temporally mixed stereogram of Hinteres Langtalkar rock glacier at 80 cm GSD. a) Screen shot of Google Maps, image acquisition date: 18 September 2002, image source: aerial photograph, BEV. b) Screen shot of Microsoft Bing Maps, image acquisition date: 21 September 2006, image source: aerial photograph, Province of Tyrol. Surface deformation can be perceived quite well in the stereogram due to the large horizontal parallaxes introduced by the right-to-left movement of the rock glacier. Also notice the development of tension cracks in the permafrost body.
Figures 3 and 4 show results obtained for the two GSDs.
Figure 3. Mean annual horizontal displacement vectors of Hinteres Langtalkar rock glacier derived from image data of Google Maps (epoch 2002) and Microsoft Bing Maps (epoch 2006). GSD: 80 cm, grid spacing: 12 × 12 pixel, template size for image matching: 25 × 25 pixel, 2573 valid points, precision of measurements: ±10.0 cm/year (1 sigma), maximum displacement: 3.31 m/year.
Figure 4. Isolines of mean annual horizontal flow velocity of Hinteres Langtalkar rock glacier derived from image data of Google Maps (epoch 2002) and Microsoft Bing Maps (epoch 2006). GSD: 40 cm, grid spacing: 12 × 12 pixel, template size for image matching: 25 × 25 pixel, 4402 valid points, precision of measurements: ±7.3 cm/year (1 sigma), maximum velocity: 3.37 m/year. Image data shown: © Google Maps, 2012.
3.3 Accuracy Analysis
The result shown in Figure 4 was compared to the stringent photogrammetric solution using the original photographs (see Kaufmann & Ladstädter, 2010: Figure 5). It was found that the flow velocities obtained from the virtual globes are correct within the given error limits for most of the study area, but flow velocities obtained for a local area (dashed line in Figure 4) were obviously wrong.
Subsequently, the image data (80 cm GSD) of the geobrowsers were directly co-registered to the respective precise orthophotos obtained by Kaufmann and Ladstädter (2010). The numerical results are shown in Table 1. Sub-pixel accuracy was achieved in image registration for both geobrowsers. The plots of the residual vectors revealed that most probably both geobrowser orthophotos are based on the same digital terrain model (DTM). Computing the difference, i.e., epoch 2 minus epoch 1, (systematic) errors may have an adverse or a neutralizing effect. In this example relatively good results were obtained over the whole area of the rock glacier, except for the area mentioned above. The analysis showed that both orthophotos were systematically wrong in this region of the rock glacier: Google Maps with negative parallax differences and Microsoft Bing Maps with positive ones. The difference adds up to 2.3 pixels at most, which is equivalent to an apparent motion of +46 cm/year.
virtual globe
easting r.m.s.e. (pixel)
northing r.m.s.e.
(pixel)
scale (easting/ northing)
rotation (°) (easting/ northing) Google ±0.39 ±0.74 0.979/0.981 0.409/0.408 Microsoft ±0.37 ±0.69 0.979/0.983 0.398/0.407
Table 1. Comparison of map geometry (Mercator projection) of virtual globes with Gauss-Krüger projection (M31) of the reference orthophotos. A 6-parameter (affine) transformation was used for geometric fit.
4. ÄUSSERES HOCHEBENKAR ROCK GLACIER 4.1 Preface
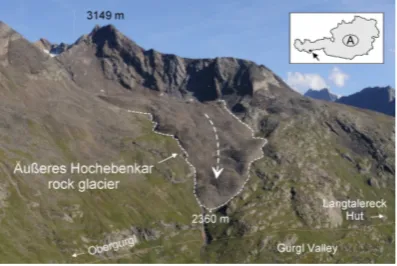
The second test site is Äußeres Hochebenkar rock glacier (46°50'01" N, 11°00'30" E, see Figure 5), which is geomorphologically very similar to Hinteres Langtalkar rock glacier. Äußeres Hochebenkar rock glacier is located in a cirque of the Gurgl Valley, Ötztal Alps, Austria. Its impressive tongue is approximately 1100 m long and also moves over a break-in-slope into steeper terrain, and its frontal break-in-slope is also affected by landsliding. Äußeres Hochebenkar rock glacier benefits from a remarkably long record of geodetic and photogrammetric measurements dating back over 70 years (Pillewizer, 1957; Vietoris 1972; Schneider & Schneider 2001; Kaufmann & Ladstädter, 2002a; Ladstädter & Kaufmann, 2004). The flow velocities of Äußeres Hochebenkar rock glacier increase from the rooting zone towards the break-in-slope, reach their maximum values near the centerline, and are subject to temporal change. The dependence of the mean annual flow velocity on the mean annual air temperature has already been addressed by Schneider & Schneider (2001). Maximum flow velocities of up to 6.6 m/year (at the frontal slope) have been measured over time. Additional references to other studies conducted at this rock glacier are given, e.g., in Kaufmann (2012).
Figure 5. Terrestrial view of Äußeres Hochebenkar rock glacier. The rock glacier is nourished by debris from the surrounding headwalls and moves from a low inclined cirque floor into steeper terrain. Its frontal slope is prone to landsliding. Photograph taken by V. Kaufmann on 10 August 2008.
4.2 Change Detection 1997-2003
Results on the deformation analysis of Äußeres Hochebenkar rock glacier based on multi-temporal aerial photographs (8 epochs, 1954-1997) were published by Kaufmann & Ladstädter (2002a, 2002b, and 2003). In preparation for the continuation of this monitoring program, the author found out that the aerial photographs used by Google Maps and Microsoft Bing Maps were more recent than 1997. Most interestingly, both geobrowsers built (2009) and still build (2012) on the same image data for the area under study. The image copyright information provided by both geobrowsers gave the Federal Office of Metrology and Survey (BEV), Vienna, as the provider and owner of the original (ortho)images. The acquisition date (aerial flight) was 5 September 2003. The original aerial photographs were subsequently acquired by the author, however, time and cost constraints have not allowed a stringent photogrammetric evaluation to date. Instead, we decided to
retrieve the orthophotos from the geobrowsers. Change detection is restricted to 2D as already outlined in the previous example of Hinteres Langtalkar rock glacier. Screen shots of the geobrowsers' orthophotos were made at different resolutions, i.e., 20 cm, 40 cm, 80 cm, and 160 cm GSD. The Earth's surface coverage of the screen shots varies according to the zoom level selected.
4.2.1 Google Maps versus Microsoft Bing Maps
In a pre-study we investigated whether both map/image geometries are the same or different. Corresponding image data/orthophotos were co-registered at all zoom levels mentioned following the same procedure as outlined in section 2.2. Image translation was determined by a least-squares adjustment. From the results obtained (see Table 2) we concluded that the image geometries of both geobrowsers are identical within approx. ±10 cm in easting and northing at all zoom levels tested. Change detection for the period 1997-2003 was thus carried out with just one data set, that of Microsoft Bing Maps.
Table 2. Precision of relative registration of screen shots (covering Äußeres Hochebenkar rock glacier) of Google Maps and Microsoft Bing Maps applying simple translation only. Mean size of the screen shots: 1280 × 700 pixel, grid spacing: 25 × 25 pixel, template size: 51 × 51 pixel, similarity measure: NCC. No blunders were detected.
4.2.2 160 cm Ground Sampling Distance
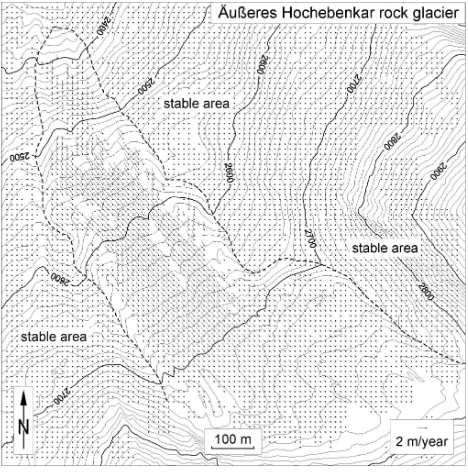
In order to compute flow velocities for the time period 1997-2003 a black-and-white orthophoto at 100 cm GSD was made available from a previous study (see Figure 6a and Kaufmann & Ladstädter, 2002a, for technical details). The acquisition date is 11 September 1997. The original aerial photographs were acquired from the Federal Office of Metrology and Surveying (BEV), Vienna. The areal extent (1100 m x 1100 m) of the reference orthophoto from 1997 requires a minimum GSD of 160 cm in Microsoft Bing Maps for full coverage. A higher resolution of the monitor would, of course, allow enhancing the level of detail to 80 cm GSD. In a first step the screen shot of the Microsoft data was re-scaled to a GSD of 100 cm in order to facilitate image matching with the 1997 image data. 2D displacement vectors were computed following the procedure described in section 2.2. 3405 stable points in the surroundings of the rock glaciers were used to estimate the 6 parameters of an affine transformation to register both geometries (see Table 3). Finally, the Microsoft image data of 2003 was rectified to fit the image reference geometry, which is a Gauss-Krüger map projection (see Figure 6b). Figure 7 shows the 2D field of displacement vectors. Figure 8 is a color-coded map showing the spatial distribution of the mean annual flow velocity for the time period 1997-2003. The results obtained compare very well to evaluations of terrestrial photogrammetric surveys (Kaufmann, 2012).
Figure 6. This figure shows a temporally mixed stereogram of Äußeres Hochebenkar rock glacier at 100 cm GSD. a) In-house produced orthophoto, image acquisition date: 11 September 1997, image source: aerial photograph, © BEV. b) Screen shot of Microsoft Bing Maps, image acquisition date: 5 September 2003, image source: aerial photograph, © BEV. Surface deformation can be perceived quite well in the stereogram due to the large horizontal parallaxes introduced by the (diagonal) movement of the rock glacier. Also notice the landslide-prone area at the snout of the rock glacier. A computer animation of the stereogram can be downloaded from http://www. geoimaging.tugraz.at/viktor.kaufmann/animations.html.
Figure 7. Mean annual horizontal displacement vectors at Äußeres Hochebenkar rock glacier for the time period 1997-2003 derived from orthophotos. Image data 1997: BEV, 100 cm GSD, image data 2003: Microsoft Bing Maps, 100 (160) cm GSD, grid spacing: 12 × 12 pixel, template size for image matching: 25 × 25 pixel, 6044 valid points, precision of measurements: ±9.2 cm/year (1 sigma), maximum velocity: 2.12 m/year.
4.3 Accuracy Analysis
Based on Table 3, the precision of measurements is ±9.2 cm/year (1 sigma). The reliability of the flow velocities obtained over the rock glacier depends primarily on the geometric quality of the image data of Microsoft Bing Maps, a factor which is difficult to assess. A good guess might be the error statistics of the stable points. As already outlined in the
Hinteres Langtalkar example the use of additional information for validation, e.g., time series results is recommended.
Figure 8. Mean annual horizontal flow velocity at Äußeres Hochebenkar rock glacier for the time period 1997-2003 (derived from Figure 7). Equidistance of isolines is 10 cm/year. Flow velocity has nearly doubled compared to the time period 1990-1997.
virtual globe
easting r.m.s.e. (pixel)
northing r.m.s.e.
(pixel)
scale (easting/ northing)
rotation (°) (easting/ northing)
Microsoft ±0.39 ±0.39 0.977/0.980 -0.513/ -0.477
Table 3. Comparison of map geometry (Mercator projection) of Microsoft Bing Maps with Gauss-Krüger projection (M28). A 6-parameter (affine) transformation was used for geometric fit.
5. CONCLUSIONS AND OUTLOOK
It can be concluded that change detection and consequently the high-precision measurement of flow velocities of active rock glaciers using image data (screen shots) of virtual globes (geobrowsers) is possible. It must be admitted, however, that the proposed method has some obvious drawbacks: (a) limited availability of high-resolution image data in high mountain areas, (b) limited availability of multi-temporal image data, (c) lack of information about exact acquisition dates or source of image data, (d) lack of information about the accuracy of the image data (orthophotos), and (e) potential legal obstacles to using the image data as shown above.
The idea of image data acquisition presented in this paper can be transferred directly to any kind of public or commercial GIS provider. If precise multi-temporal orthophotos are provided for change detection analysis then automatic screening of large areas for moving rock glaciers or any other kind of mass movements is feasible. Meanwhile, we have completely automated the measuring scheme presented using additional computer vision algorithms.
REFERENCES
Avian, M., Kellerer-Pirklbauer, A. & Bauer, A., 2009. LiDAR for monitoring mass movements in permafrost environments at the cirque Hinteres Langtal, Austria, between 2000 and 2008. Natural
Hazards and Earth System Sciences, 9(4), pp. 1087-1094.
Barsch, D., 1996. Rockglaciers. Indicators for the Present and
Former Geoecology in High Mountain Environments. Springer
Series in Physical Environment, 16, Springer, 331 pages.
Buchenauer, H.W., 1990. Gletscher- und Blockgletschergeschichte
der westlichen Schobergruppe (Osttirol). Marburger
Geographische Schriften, 117, Philipps-Universität Marburg, in
German, 276 pages.
Debella-Gilo, M. & Kääb, A., 2011. Sub-pixel precision image matching for measuring surface displacement on mass movements
using normalized cross-correlation. Remote Sensing of
Environment, 115(1), pp. 130-142.
Debella-Gilo, M. & Kääb, A., 2012. Measurement of Surface Displacement and Deformation of Mass Movements Using Least Squares Matching of Repeat High Resolution Satellite and Aerial Images. Remote Sensing, 4(1), pp. 43-67.
Delaloye, R. et al., 2008. Recent Interannual Variations of Rock Glacier Creep in the European Alps. In: Kane, D.L. and Hinkel K.M. (eds.), Ninth International Conference on Permafrost, Vol. 1, Institute of Northern Engineering, University of Alaska Fairbanks, pp. 343-348.
Gruber, S. & Haeberli, W., 2009. Mountain Permafrost. In: Margesin, R. (ed.), Permafrost Soils. Soil Biology, 16, Springer-Verlag Berlin Heidelberg, pp. 33-44.
Haeberli, W., Hallet, B., Arenson, L., Elconin, R., Humlum, O., Kääb, A., Kaufmann, V., Ladanyi, B., Matsuoka, N., Springman, S. & Vonder Mühll, D., 2006. Permafrost Creep and Rock Glacier Dynamics. Permafrost and Periglacial Processes, 17(3), pp. 189-214.
Kääb, A., 2008. Remote Sensing of Permafrost-related Problems and Hazards. Permafrost and Periglacial Processes, 19(2), pp. 107-136.
Kääb, A., 2011. Natural hazards associated with glaciers and permafrost. In: Singh, V.P., Singh, P. & Haritashya, U.K. (eds.),
Encyclopedia of Snow, Ice and Glaciers. Encyclopedia of Earth
Sciences Series, Springer, pp. 763-775.
Kaufmann, V. 2010. Measurement of surface flow velocity of active rock glaciers using orthophotos of virtual globes.
Geographia Technica, Special Issue, pp. 68-81.
Kaufmann, V., 2012. Rock glacier monitoring using terrestrial photogrammetry: Visualization and quantification of the spatio-temporal change of Äußeres Hochebenkar rock glacier (1986-2008). Austrian Journal of Earth Sciences, submitted.
Kaufmann, V. & Ladstädter, R., 2002a. Spatio-temporal analysis of the dynamic behaviour of the Hochebenkar rock glaciers (Oetztal Alps, Austria) by means of digital photogrammetric methods.
Grazer Schriften der Geographie und Raumforschung, Band 37,
Institute of Geography and Regional Sciences, University of Graz, pp. 119-139.
Kaufmann, V. & Ladstädter, R., 2002b. Monitoring of active rock glaciers by means of digital photogrammetry. IAPRS, Graz, Austria, XXXIV, Part 3B, pp. 108-111.
Kaufmann, V. & Ladstädter, R., 2003. Quantitative analysis of rock glacier creep by means of digital photogrammetry using multi-temporal aerial photographs: two case studies in the Austrian Alps. In: M. Phillips, S.M. Springman & Arenson, L.U. (eds.),
Permafrost. Proceedings of the 8th International Conference on
Permafrost, Vol. 1, Zurich, Switzerland, Swets & Zeitlinger
Publishers, pp. 525-530.
Kaufmann, V. & Ladstädter, R., 2010. Documentation and visualization of the morphodynamics of Hinteres Langtalkar rock glacier (Hohe Tauern range, Austrian Alps) based on aerial photographs (1954-2006) and geodetic measurements (1999-2007).
Grazer Schriften der Geographie und Raumforschung, Band 45,
Institute of Geography and Regional Science, University of Graz, pp. 103-116.
Kenyi, L.W. & Kaufmann, V., 2003. Estimation of Rock Glacier
Surface Deformation Using SAR Interferometry Data. IEEE
Transactions on Geoscience and Remote Sensing, 41(6), pp.
1512-1515.
Krainer, K. & Mostler, W., 2001. Der aktive Blockgletscher im Hinteren Langtalkar, Gößnitztal (Schobergruppe, Nationalpark Hohe Tauern, Österreich). Wissenschaftliche Mitteilungen aus dem
Nationalpark Hohe Tauern, 6, in German, 139-168.
Krysiecki, J.-M., Bodin, X. & Schoeneich, P., 2008. Collapse of the Bérard Rock Glacier (Southern French Alps). In: Kane, D.L. and Hinkel, K.M. (eds.), Ninth International Conference on Permafrost, Extended Abstracts, Institute of Northern Engineering, University of Alaska Fairbanks, pp. 1505-1510.
Ladstädter, R. & Kaufmann, V., 2004. Change detection of a mountain slope by means of ground-based photogrammetry: A case
study in the Austrian Alps. Monografies tècniques, 8, Institut
Cartogràfic de Catalunya, Barcelona, pp. 65-76.
Lambiel, C., Delaloye, R., Strozzi, T., Lugon, R. & Raetzo, H., 2008. ERS InSAR for Assessing Rock Glacier Activity. In: Kane, D.L. & Hinkel K.M. (eds.), Ninth International Conference on
Permafrost. Institute of Northern Engineering, University of
Alaska, Fairbanks, Vol. 1, pp. 1019-1024.
Pillewizer, W., 1957. Untersuchungen an Blockströmen der
Ötztaler Alpen. Abhandlungen des Geographischen Instituts der
Freien Universität Berlin, 5, in German, pp. 37-50.
Roer, I., Haeberli, W., Avian, M., Kaufmann, V., Delaloye, R., Lambiel, C. & Kääb, A., 2008. Observations and Considerations on Destabilizing Active Rock Glaciers in the European Alps. In: Kane, D.L. & Hinkel K.M. (eds.), Ninth International Conference on
Permafrost. Institute of Northern Engineering, University of
Alaska, Fairbanks, Vol. 2, pp. 1505-1510.
Schneider, B. & Schneider, H., 2001. Zur 60jährigen Messreihe der kurzfristigen Geschwindigkeitsschwankungen am Blockgletscher
im Äusseren Hochebenkar, Ötztaler Alpen, Tirol. Zeitschrift für
Gletscherkunde und Glazialgeologie, 37(1), in German, abstract in
English, pp. 1-33.
Shur, Y., Jorgenson, M.T. & Kanevskiy, M.Z., 2011. Permafrost. In: Singh, V.P., Singh, P. & Haritashya, U.K. (eds.), Encyclopedia
of Snow, Ice and Glaciers. Encyclopedia of Earth Sciences Series,
Springer, pp. 841-848.
Vietoris, L., 1972. Über den Blockgletscher des Äußeren Hochebenkars. Zeitschrift für Gletscherkunde und Glazialgeologie, 8(1-2), in German, pp. 169-188.