CLASSIFICATION OF ACTIVE MICROWAVE AND PASSIVE OPTICAL DATA BASED
ON BAYESIAN THEORY AND MRF
F. Yu*, H. T. Li, Y. S. Han,H. Y. Gu
Chinese Academy of Surveying and Mapping, Beijing 100830, P. R. China – (yufan, lhtao, hys_han, guhy)@casm.ac.cn
Commission VII, WG VII/4
KEY WORDS: Active and passive remote sensing, Classification, Bayesian theory, MRF, ASAR, TM.
ABSTRACT
A classifier based on Bayesian theory and Markov random field (MRF) is presented to classify the active microwave and passive optical remote sensing data, which have demonstrated their respective advantages in inversion of surface soil moisture content. In the method, the VV, VH polarization of ASAR and all the 7 TM bands are taken as the input of the classifier to get the class labels of each pixel of the images. And the model is validated for the necessities of integration of TM and ASAR, it shows that, the total precision of classification in this paper is 89.4%. Comparing with the classification with single TM, the accuracy increase 11.5%, illustrating that synthesis of active and passive optical remote sensing data is efficient and potential in classification.
*
Corresponding author, Ph. D, majors in classification with active microwave and passive optical remote sensing data. 1. INTRODUCTION
A range of remotely sensed data from sensors differing in terms of their spectral, spatial, and temporal resolution is now widely available. Given the large size of such multisource data sets, the immediate problem is how to choose and apply a suitable classification algorithm in order to achieve a level of accuracy that is acceptable for the given application.
Optic and microwave remote sensing are two common methods to obtain the land surface information. The optic remote sensing data, with rich spectral information, represents the surface reflective spectral or the emission spectral; Microwave remote sensing has the characteristics of strong penetration, and it is the general information of vegetation coverage, surface roughness, dielectric constant, structure and so on. When the optic images are helpless with the problems of ‘foreign objects with the same spectrum’ and ‘identical objects with the different spectrum’ in the earth observation, the microwave images can distinguish the objects by its surface roughness, structure, shape, water content and so on. Therefore, the integration of optic and microwave remote sensing data can gain the features of objects in different aspects, and do well in the classification or feature extraction.
Currently, integration of optical and microwave remote sensing in classification is attracting increasing attention, Reference (jia et al, 1995) used modified Bayesian Network to classify the Landsat TM and Aircraft SAR images, and found the precision of the classification by fusion TM and ASR are 20% higher than the single TM. The decision level fusion of TM and SAR images was applied to classification (Solberg, 1994), and further improved by adding the Markov random field; Storvik (Storvik, 2005) proposed Bayesian network to classify the multisource remote sensing with different spatial
resolution and get an accuracy of 88.7%. However, the above reference can not handle the SAR image speckle noise, and discuss less of the extraction of the multi-feature of SAR, so they didn’t set up the appropriate conditional probability density model.
Consequently, we have developed a new classification model for multisource data based on the Markov Random Field (MRF) and Bayesian theory. In the model, a Bayesian classifier based on MRF is developed, the VV, VH polarization of ASAR and all the TM bands are taken as the input of the Bayesian classifier to get the class label of each pixels of the mutilsource images. At last, the model is validated by the field measurements.
2. CLASSIFIER BASED ON BAYESIAN THEORY AND MRF
Bayesian statistical theory has been widely used as a theoretically robust foundation for the classification of remotely sensed data. The matter of multi-source remote sensing imagery is : suppose multivariate image X is composed of N-dimensional pixels where Xk(s) denotes the eigenvector of X, k = 1, 2, …, N, presents the N dimensions, and s = (i , j)denotes the coordinate on image X. w denotes the field which contains the classification of each pixel in X;points in w can take values in the set {1, 2, . . . , L}, where L is the number of classes. The multivariate image X is then classified by finding a field of class labels
w
ˆ
Map such that:International Archives of the Photogrammetry, Remote Sensing and Spatial Information Sciences, Volume XXXIX-B7, 2012 XXII ISPRS Congress, 25 August – 01 September 2012, Melbourne, Australia
ˆMap arg max{ ( | )} arg max{ ( | ) ( )}
w w
w = p w X = p X w p w (1)
where wˆMap
=
MAP (Maximum a Posteriori) estimation of the field of class labels which maximizes the posterior cost function (1).p(w)= prior probability distribution p(X|w)= class-conditional distribution
Therefore, the modeling of both the p(w)and p(X|w)becomes an essential task.
2.1. Prior Distribution Model-MRF
The introduction of MRF can be found in many texts (Chellappa, 1983; 1985). The image function w(s) can be taken a two-dimensional random, and expressed by Markov random field as:
{ ( ) | ( )} {( ( ) | ( )}
p w s w S
−
s=
p w s w s∂
(2)where S = image lattice s
∂ =
neighborhood systemSo for a given point in a two-dimensional random, its class label is only dependent on its neighbors and unrelated with other pixels of image.
For a given neighborhood system, a Gibbs distribution is defined as any distribution p(w)that can be expressed in (Julian, 1986) as:
z = normalizing constant called a partition coefficient T = analogous to temperature.
The prior distribution based on the first order neighborhood system as:
where β = weight emphasizing the significance of interactions among adjacent pixels inside the clique,
tc(w) = Vc(w) mathematically.
2.2. Modeling the Conditional Probability Density Function
As the impact of speckle noise of SAR image in synthesizing classification of the optical and microwave images, it is difficult to obtain the conditional probability density function of the multisource remote sensing data, maximum likelihood classifier with modified M-estimates of mean and covariance (MMLM) can be used to classify the multisource images and get the initial class labels and the conditional probability density function of each class. From the Reference (Yonhong, 1996), we see that MLMM can obtain a good precision of classification and proper conditional probability density function, also restrain the speckle noise of SAR images.
2.3. Classification by Iterated Conditional Modes (ICM) The ICM is computationally feasible since it updates the class assignments iteratively (Julian, 1986), the objective is to estimate the class label of a pixel given the estimates of class labels for all other pixels inside the rectangular lattice. Then the optimization problem of (5) becomes:
( )
ˆ
( )
arg max[ ( ( ) |
, (
ˆ
))]
w s
w s
=
p w s
X w S
−
s
(6)Applying the Bayes' rule and considering the Markov property (Julian, 1986), the argument of (6)becomes:
( )
ˆ
( )
arg max[ { ( ) | ( )} { ( ) | (
ˆ
ˆ
)}]
w s
w s
=
p X s
w s
p w s
w s
∂
(7)From the Hammersley-Clifford theory (Geman, 1984) we know: International Archives of the Photogrammetry, Remote Sensing and Spatial Information Sciences, Volume XXXIX-B7, 2012
XXII ISPRS Congress, 25 August – 01 September 2012, Melbourne, Australia
where δk = Dirac-delta function, if k=0, δk=1; k≠0, δk=0.
cs= {c | c Є C, s Є c}.
Therefore, from (5) and (7) we know:
ˆ ( ) ( ) ( )
ˆ ( ) arg min ( ln ( | ( )) (1 w s w s )]
w s s S c C
w s p X w s
β
δ
− ∂∈ ∈
=
∑
− +∑
−(10)
3. EXPERIMENTS 3.1. Study Area and Database
The measures reports in this study are conducted during the Watershed Airborne Telemetry Experiment. The study area locates in Grass Station of Lanzhou University in Zhang Ye district, Gansu province. Its geographical coordinates are 39.25043°N, 100.005871°E, the altitude is 1385 meters. Land use mainly consists of country, bare salinization land and irrigative agricultural fields. The field experiment was conducted from June to July in 2008, at which time the crops were corn, clove, barley and other crops.
Satellites over the study area provided TM and ASAR data on 7 July 2008 and 11 July 2008, respectively. ASAR (Advanced Synthetic Aperture Radar) is a synthetic aperture radar carried by the ENVISAT-1 satellite and operates in the C-band (central wavelength 5.63 cm), with multi-polarization, seven observation angles and five operating modes. In this study, we chose to use the ASAR data, and the operating mode was Alternation Polarization corresponding to two kinds of polarization (VV and VH) and high space resolution (12.5×12.5 m per pixel). Figure 1(a) and 1(b) illustrate the false color composite image composed by TM3, 4, 5 and ASAR image in VV polarization.
(a) The false color composite image (b) ASAR image in VV polarization
Figure 1. The images used in the paper
When the initial class labels and conditional probability density function of the multi-source remote sensing data are determined by MLMM, formulation (10) is used to perform the local minimization at each pixel in a specified order and get the updated category. If changes occur then repeat estimating. The iteration continues until no more updates occur for all the pixels inside the lattice, then, the classification completes.
Comparing with the conventional Markov model for iterative classification, our method needn’t to assume the conditional probability density function in advance; With joining the spatial
correlation of the class labels, our method also can get a better classification accuracy than the ordinary maximum likelihood classification model. Moreover, the classification is achieved through the iterative process, which takes into account the characteristics of pixel attributes.
3.2. Classification experiment
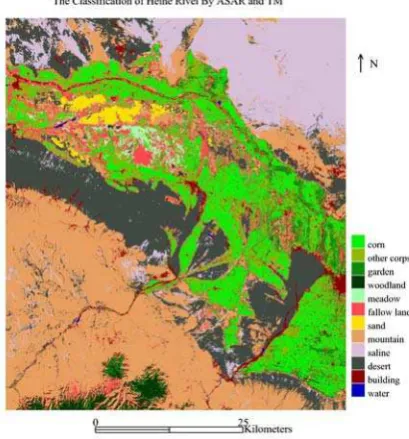
VV, VH polarization of ASAR and all the TM bands are taken as the input of the classifier, and the multisource images are resampled to 30m*30m and geometrically corrected. The study area is separated to 12 classes, which are corn, other corps, garden, woodland, meadow, fallow land, sand, mountain, saline, desert, building, and water. The training samples and validation samples are shown in Table 1. When the training samples and validation samples are selected, we use the method in Section 2 to classify the TM and ASAR images, the results are shown in Figure 2, In which, the basic form of oasis is similar with the Figure 1(a), which is consistent with the dual ecological environment of western semiarid regions, “oasis accompanies with water, and desert accompanies with no water”.
Figure 2. The Classification map of study area
3.3. Validation
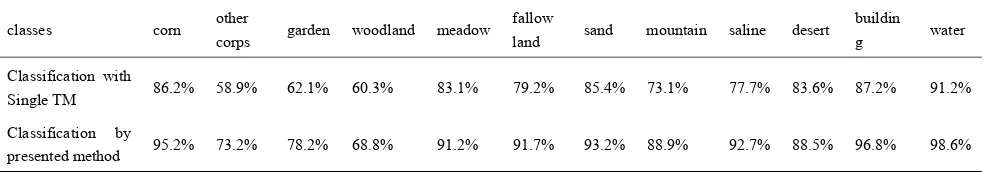
To verify the necessity of coupling optical radar data for classification, the output of the classification of ASAR and TM in Section 3 were compared with the classification only by TM,
all using Bayesian and MRF classifier. Table 2 presents the statistical errors among the three algorithms.
In Table 2, the accuracy of each type of classification with single TM is lower, and reaches a total precision of 77.9%. When the ASAR dual polarization is jointed, the total precision increases to 89.4%. The reason may be that the ASAR information can increase the surface characteristics and make them easy to distinguish, for example, corn, other corps, garden and woodland are similar in spectrum, and we can identify them by their various structural features revealed by their ASAR backscattering coefficients and finally obtain a better accuracy. International Archives of the Photogrammetry, Remote Sensing and Spatial Information Sciences, Volume XXXIX-B7, 2012
XXII ISPRS Congress, 25 August – 01 September 2012, Melbourne, Australia
classes corn other
corps garden woodland meadow
fallow
land sand mountain saline desert
buildin
g water
Training samples 538
5 1615 495 679 1642 1483
321
7 4810 4690 3612 587 805
validation samples
280
4 1056 229 335 1180 1176
224
6 3202 2146 2484 327 479
sum 882
5 2671 724 1014 2822 2659
546
3 8012 6836 6096 914 1284
Table. 1 Training and Validation Samples
classes corn other
corps garden woodland meadow
fallow
land sand mountain saline desert
buildin
g water
Classification with
Single TM 86.2% 58.9% 62.1% 60.3% 83.1% 79.2% 85.4% 73.1% 77.7% 83.6% 87.2% 91.2%
Classification by
presented method 95.2% 73.2% 78.2% 68.8% 91.2% 91.7% 93.2% 88.9% 92.7% 88.5% 96.8% 98.6%
Table. 2 Statistical Errors for the Two Algorithms
4. CONCLUSION
A new classification model for active and passive remote sensing data is developed in this paper. In the model, a classifier based on the Bayesian theory and MRF is set up, ASAR in VV, VH polarization and 7 bands of TM are taken as the input of the classifier. The validation by field measurements shows that:
1) The classification model based on Bayesian and MRF in this paper not only need not to assume the conditional probability density function in advance, but also joining the spatial correlation of the class labels, the model can get a better classification accuracy of 89.4%.
2) Comparing with the Classification with single TM, the total precision of classification by active and passive remote sensing increase 11.5%, it shows the integration of TM and ASAR data can increase the information of the surface objects, make them easier to distinguish, and finally reach a better classification precision.
The study area is a typical ‘oasis-desert’ dual ecological environment in the paper, and terrain of the oasis is relatively flat. These are conductive to identify and classify the objects in ASAR image. But when the study area is selected a densely populated plains or urban areas, the accuracy of classification by active and passive remote sensing data needs to be further verified.
REFERENCES
[1] Jia, Y., Li, D. R., 1995. Multisource classification of remotely sensed data based on Bayesian data fusion method, Journal of Wuhan Technical University of surveying and Mapping, 22(3), pp. 248-251.
[2] Solberg, A. H., 1994. Multisource Classification of Remotely Sensed Data: Fusion of Landsat TM and SAR Images. IEEE Trans. Geosci. Remote Sens., 32(1), pp. 766-778.
[3] Storvik, G., Roger, F., Solberg, A. H., 2005. A Bayesian approach to classification of multi-resolution remote sensing data. IEEE Trans. Geosci. Remote Sens., 43(3), pp. 539-547.
[4] Chellappa, R., Chatterjee, S., 1985. Classification of Textures Using Gaussian Markov Random Fields. IEEE Trans. Acous. Speech. Signal Process., 33(2), pp. 959— 963.
[5] Chellappa, R., Hu, T., 1983. On two-dimensional Markov spectral estimation. IEEE Trans. Acous. Speech. Signal Process., 31(4), pp. 836-841.
[6] Julian, H., 1986. On the statistical analysis of dirty pictures. J. Roy. Statist. Soc, 48(1), pp. 259-302.
[7] Yonhong, J., Philip, H., 1996. Bayesian Contextual Classification Based on Modified M-Estimates and Markov Random Fields. IEEE Trans. Geosci. Remote Sens., 34(1), pp. 67-75.
[8] Geman, S., 1984. Markov random field image models and their applications to computer vision. IEEE Trans. Pattern Anal. Mach intell., 26(2), pp. 721-743,
ACKNOWLEDGMENT
This work is supported by the National Science Foundation for Young Scientists of China (Grant number: 41101321) and the Key Projects in the National Science & Technology Pillar Program (2009BAG18B01and 2012BAH28B03).
International Archives of the Photogrammetry, Remote Sensing and Spatial Information Sciences, Volume XXXIX-B7, 2012 XXII ISPRS Congress, 25 August – 01 September 2012, Melbourne, Australia